Estimated zip code population in 2022: 3,150 Zip code population in 2010: 3,281 Zip code population in 2000: 3,337
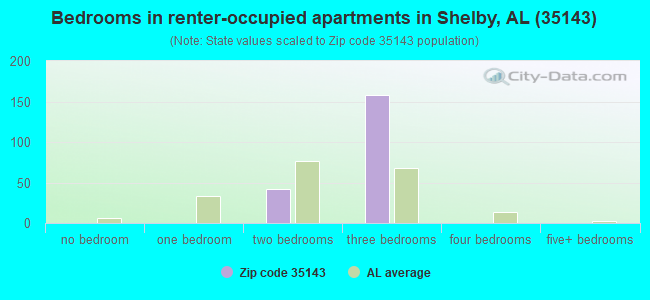
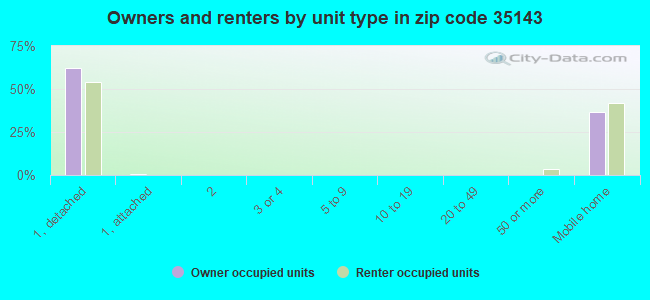
Houses and condos: 2,066 Renter-occupied apartments: 201
% of renters here:
15%
State:
30%
March 2022 cost of living index in zip code 35143: 81.8 (low, U.S. average is 100)
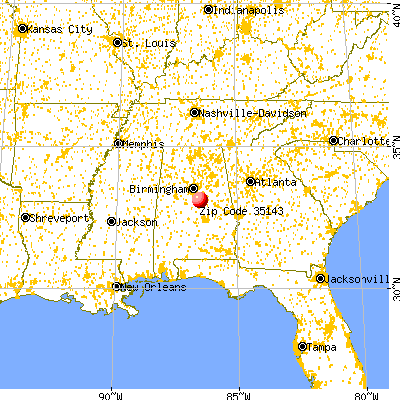
Land area: 42.3 sq. mi. Water area: 5.6 sq. mi.
Population density: 74 people per square mile
(very low).
OSM Map
General Map
Google Map
MSN Map
OSM Map
General Map
Google Map
MSN Map
OSM Map
General Map
Google Map
MSN Map
OSM Map
General Map
Google Map
MSN Map
Please wait while loading the map...
Real estate property taxes paid for housing units in 2022:
This zip code:
0.5% ($1,110)
Alabama:
0.4% ($718)
Median real estate property taxes paid for housing units with mortgages in 2022: $1,277 (0.4%) Median real estate property taxes paid for housing units with no mortgage in 2022: $734 (0.7%)
Business Search- 14 Million verified businesses
Males: 1,725
(54.8%)
Females: 1,423
(45.2%)
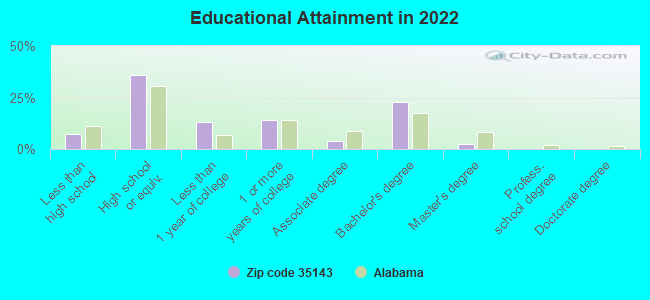
For population 25 years and over in 35143:
High school or higher: 92.5%
Bachelor's degree or higher: 25.3%
Graduate or professional degree: 2.5%
Unemployed: 0.6%
Mean travel time to work (commute): 28.4 minutes
For population 15 years and over in 35143:
Never married: 20.4%
Now married: 64.8%
Separated: 0.0%
Widowed: 4.2%
Divorced: 10.6%
Zip code 35143 compared to state average:
Unemployed percentage significantly below state average.
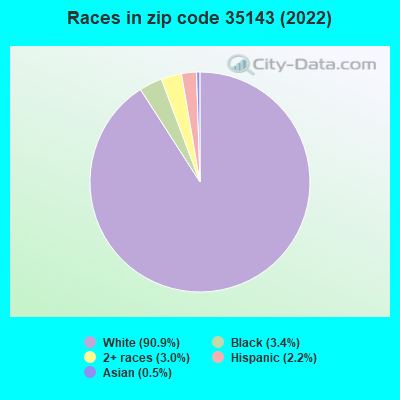
Black race population percentage significantly below state average.
Hispanic race population percentage below state average.
Median age significantly above state average.
Foreign-born population percentage significantly below state average.
Renting percentage below state average.
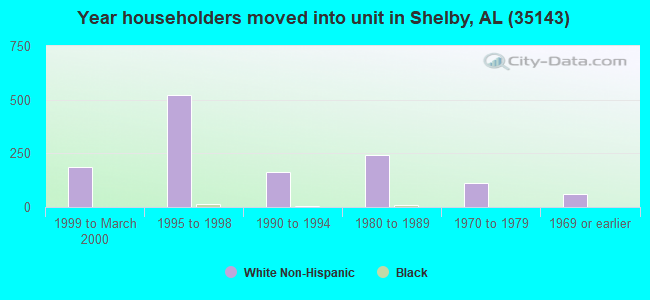
Length of stay since moving in significantly above state average.
Averages for the 2020 tax year for zip code 35143, filed in 2021:
Average Adjusted Gross Income (AGI) in 2020: $63,051 (Individual Income Tax Returns)
Here:
$63,051
State:
$63,984
Salary/wage: $53,777 (reported on 77.7% of returns)
Here:
$53,777
State:
$52,834
(% of AGI for various income ranges: 1142.1% for AGIs below $25k, 3253.0% for AGIs $25k-50k, 6219.2% for AGIs $50k-75k, 9955.7% for AGIs $75k-100k, 15425.8% for AGIs $100k-200k)
Taxable interest for individuals: $1,268 (reported on 28.8% of returns)
This zip code:
$1,268
Alabama:
$1,615
(% of AGI for various income ranges: 19.7% for AGIs below $25k, 23.7% for AGIs $25k-50k, 20.0% for AGIs $50k-75k, 38.6% for AGIs $75k-100k, 158.3% for AGIs $100k-200k)
Ordinary dividends: $5,075 (reported on 14.4% of returns)
Here:
$5,075
State:
$7,660
(% of AGI for various income ranges: 33.5% for AGIs below $25k, 17.8% for AGIs $25k-50k, 106.9% for AGIs $50k-75k, 71.4% for AGIs $75k-100k, 268.3% for AGIs $100k-200k)
Net capital gain/loss in AGI: +$11,718 (reported on 12.2% of returns)
Here:
+$11,718
State:
+$23,528
(% of AGI for various income ranges: 3.8% for AGIs below $25k, 68.1% for AGIs $25k-50k, 48.6% for AGIs $75k-100k, 485.0% for AGIs $100k-200k)
Profit/loss from business: +$8,125 (reported on 14.4% of returns)
Here:
+$8,125
State:
+$9,534
(% of AGI for various income ranges: 154.4% for AGIs below $25k, 139.3% for AGIs $25k-50k, 226.9% for AGIs $50k-75k, 365.7% for AGIs $75k-100k, 144.2% for AGIs $100k-200k)
Taxable individual retirement arrangement distribution: $21,236 (reported on 10.1% of returns)
35143:
$21,236
Alabama:
$19,004
(% of AGI for various income ranges: 64.4% for AGIs below $25k, 159.6% for AGIs $25k-50k, 523.1% for AGIs $50k-75k, 1369.2% for AGIs $100k-200k)
Total itemized deductions: $34,038 (reported on 5.8% of returns)
Here:
$34,038
State:
$37,338
(% of AGI for various income ranges: 239.3% for AGIs $25k-50k, 749.2% for AGIs $100k-200k)
Charity contributions: $14,314 (reported on 5.0% of returns)
Here:
$14,314
State:
$18,005
(% of AGI for various income ranges: 74.4% for AGIs $25k-50k, 282.5% for AGIs $100k-200k)
Taxes paid: $6,188 (reported on 5.8% of returns)
35143:
$6,188
State:
$6,484
(% of AGI for various income ranges: 30.0% for AGIs $25k-50k, 175.0% for AGIs $100k-200k)
Earned income credit: $2,292 (reported on 18.7% of returns)
Here:
$2,292
State:
$2,628
(% of AGI for various income ranges: 115.3% for AGIs below $25k, 75.6% for AGIs $25k-50k)
Percentage of individuals using paid preparers for their 2020 taxes: 93.5%
Here:
94%
State:
93%
(% for various income ranges: 91.8% for AGIs below $25k, 91.2% for AGIs $25k-50k, 94.7% for AGIs $50k-75k, 100.0% for AGIs $75k-100k, 95.0% for AGIs $100k-200k, 100.0% for AGIs over 200k)
Averages for the 2012 tax year for zip code 35143, filed in 2013:
Average Adjusted Gross Income (AGI) in 2012: $46,909 (Individual Income Tax Returns)
Here:
$46,909
State:
$52,001
Salary/wage: $41,583 (reported on 79.7% of returns)
Here:
$41,583
State:
$43,822
(% of AGI for various income ranges: 69.7% for AGIs below $25k, 76.1% for AGIs $25k-50k, 70.2% for AGIs $50k-75k, 74.2% for AGIs $75k-100k, 66.8% for AGIs $100k-200k)
Taxable interest for individuals: $1,387 (reported on 30.9% of returns)
This zip code:
$1,387
Alabama:
$1,592
(% of AGI for various income ranges: 1.3% for AGIs below $25k, 0.8% for AGIs $25k-50k, 0.9% for AGIs $50k-75k, 1.5% for AGIs $75k-100k, 0.6% for AGIs $100k-200k)
Ordinary dividends: $2,506 (reported on 14.6% of returns)
Here:
$2,506
State:
$5,697
(% of AGI for various income ranges: 1.5% for AGIs below $25k, 0.6% for AGIs $25k-50k, 1.2% for AGIs $50k-75k, 0.5% for AGIs $75k-100k, 0.5% for AGIs $100k-200k)
Net capital gain/loss in AGI: +$800 (reported on 8.9% of returns)
Here:
+$800
State:
+$13,286
(% of AGI for various income ranges: 0.7% for AGIs $25k-50k, 0.2% for AGIs $100k-200k)
Profit/loss from business: +$8,829 (reported on 17.1% of returns)
Here:
+$8,829
State:
+$9,151
(% of AGI for various income ranges: 10.0% for AGIs below $25k, 1.7% for AGIs $25k-50k, 2.7% for AGIs $50k-75k, 3.5% for AGIs $100k-200k)
Taxable individual retirement arrangement distribution: $17,881 (reported on 13.0% of returns)
35143:
$17,881
Alabama:
$14,992
(% of AGI for various income ranges: 4.9% for AGIs below $25k, 4.6% for AGIs $25k-50k, 6.1% for AGIs $50k-75k, 6.6% for AGIs $100k-200k)
Total itemized deductions: $19,284 (23% of AGI, reported on 30.1% of returns)
Here:
$19,284
State:
$21,388
Here:
23.5% of AGI
State:
20.1% of AGI
(% of AGI for various income ranges: 9.5% for AGIs below $25k, 11.9% for AGIs $25k-50k, 12.9% for AGIs $50k-75k, 13.6% for AGIs $75k-100k, 12.7% for AGIs $100k-200k)
Charity contributions: $4,239 (reported on 25.2% of returns)
Here:
$4,239
State:
$5,925
(% of AGI for various income ranges: 1.6% for AGIs below $25k, 2.0% for AGIs $25k-50k, 2.2% for AGIs $50k-75k, 3.4% for AGIs $75k-100k, 2.2% for AGIs $100k-200k)
Taxes paid: $4,138 (reported on 30.1% of returns)
35143:
$4,138
State:
$5,272
(% of AGI for various income ranges: 1.1% for AGIs below $25k, 1.4% for AGIs $25k-50k, 2.4% for AGIs $50k-75k, 2.9% for AGIs $75k-100k, 3.9% for AGIs $100k-200k)
Earned income credit: $2,230 (reported on 22.0% of returns)
Here:
$2,230
State:
$2,646
(% of AGI for various income ranges: 7.7% for AGIs below $25k, 1.1% for AGIs $25k-50k)
Percentage of individuals using paid preparers for their 2012 taxes: 61.0%
Here:
61%
State:
60%
(% for various income ranges: 60.0% for AGIs below $25k, 58.1% for AGIs $25k-50k, 63.2% for AGIs $50k-75k, 60.0% for AGIs $75k-100k, 69.2% for AGIs $100k-200k)
Averages for the 2004 tax year for zip code 35143, filed in 2005:
Average Adjusted Gross Income (AGI) in 2004: $40,823 (Individual Income Tax Returns)
Here:
$40,823
State:
$42,302
Salary/wage: $36,934 (reported on 80.1% of returns)
Here:
$36,934
State:
$36,626
(% of AGI for various income ranges: 91.6% for AGIs below $10k, 72.7% for AGIs $10k-25k, 82.0% for AGIs $25k-50k, 77.1% for AGIs $50k-75k, 80.8% for AGIs $75k-100k, 55.5% for AGIs over 100k)
Taxable interest for individuals: $1,744 (reported on 34.5% of returns)
This zip code:
$1,744
Alabama:
$1,827
(% of AGI for various income ranges: 7.2% for AGIs below $10k, 1.8% for AGIs $10k-25k, 1.0% for AGIs $25k-50k, 1.2% for AGIs $50k-75k, 1.6% for AGIs $75k-100k, 1.5% for AGIs over 100k)
Taxable dividends: $2,195 (reported on 14.7% of returns)
Here:
$2,195
State:
$4,206
(% of AGI for various income ranges: 4.1% for AGIs below $10k, 0.4% for AGIs $10k-25k, 1.0% for AGIs $25k-50k, 0.6% for AGIs $50k-75k, 0.5% for AGIs $75k-100k, 0.9% for AGIs over 100k)
Net capital gain/loss: +$12,792 (reported on 10.3% of returns)
Here:
+$12,792
State:
+$13,031
(% of AGI for various income ranges: 0.3% for AGIs $10k-25k, 0.3% for AGIs $25k-50k, -0.0% for AGIs $50k-75k, 0.5% for AGIs $75k-100k, 10.8% for AGIs over 100k)
Profit/loss from business: +$9,245 (reported on 17.5% of returns)
Here:
+$9,245
State:
+$8,302
(% of AGI for various income ranges: 12.7% for AGIs below $10k, 9.6% for AGIs $10k-25k, 3.6% for AGIs $25k-50k, 3.2% for AGIs $50k-75k, 0.2% for AGIs $75k-100k, 4.4% for AGIs over 100k)
IRA payment deduction: $3,062 (reported on 1.3% of returns)
35143:
$3,062
Alabama:
$3,006
Total itemized deductions: $16,593 (22% of AGI, reported on 30.0% of returns)
Here:
$16,593
State:
$17,623
Here:
22.3% of AGI
State:
20.8% of AGI
(% of AGI for various income ranges: 11.9% for AGIs $10k-25k, 9.8% for AGIs $25k-50k, 14.4% for AGIs $50k-75k, 14.4% for AGIs $75k-100k, 12.3% for AGIs over 100k)
Charity contributions deductions: $4,215 (5% of AGI, reported on 26.6% of returns)
Here:
$4,215
State:
$4,768
Here:
5.4% of AGI
State:
5.4% of AGI
(% of AGI for various income ranges: 1.7% for AGIs $10k-25k, 1.7% for AGIs $25k-50k, 2.1% for AGIs $50k-75k, 4.0% for AGIs $75k-100k, 3.8% for AGIs over 100k)
Total tax: $5,845 (reported on 72.7% of returns)
35143:
$5,845
State:
$6,905
(% of AGI for various income ranges: 3.3% for AGIs below $10k, 4.7% for AGIs $10k-25k, 6.6% for AGIs $25k-50k, 8.8% for AGIs $50k-75k, 10.6% for AGIs $75k-100k, 17.1% for AGIs over 100k)
Earned income credit: $1,802 (reported on 19.3% of returns)
Here:
$1,802
State:
$2,048
Percentage of individuals using paid preparers for their 2004 taxes: 64.2%
Here:
64%
State:
65%
(% for various income ranges: 59.4% for AGIs below $10k, 62.9% for AGIs $10k-25k, 65.8% for AGIs $25k-50k, 67.3% for AGIs $50k-75k, 66.3% for AGIs $75k-100k, 68.5% for AGIs over 100k)
Household received Food Stamps/SNAP in the past 12 months: 49 Household did not receive Food Stamps/SNAP in the past 12 months: 1,293
Women who had a birth in the past 12 months: 31 (0 now married, 24 unmarried) Women who did not have a birth in the past 12 months: 492 (311 now married, 179 unmarried)
Housing units in zip code 35143 with a mortgage: 557 (33 second mortgage, 35 both second mortgage and home equity loan) Houses without a mortgage: 10
Median monthly owner costs for units with a mortgage: $1,706 Median monthly owner costs for units without a mortgage: $415
Residents with income below the poverty level in 2022:
This zip code:
7.5%
Whole state:
16.2%
Residents with income below 50% of the poverty level in 2022:
This zip code:
3.1%
Whole state:
8.6%
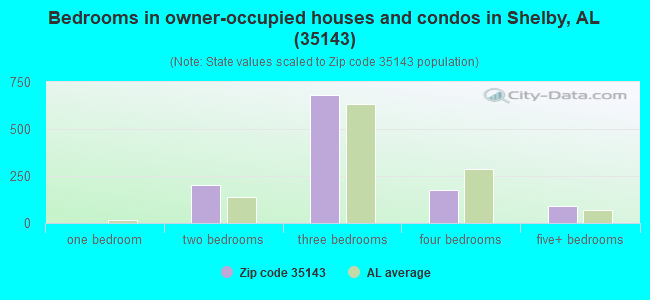
Median number of rooms in houses and condos:
Here:
5.9
State:
6.5
Median number of rooms in apartments:
Here:
4.9
State:
4.7
Notable locations in this zip code not listed on our city pages
Notable locations in zip code 35143: Etress Fish Camp (A), Joe Whites Fish Camp (B), Okomo Marina (C), Camp Waxahatchee Marina (D), Bozos Camp (E), Waxahatchee Camp (F), Spring Creek Camp (G), Okomo Camp (H), Lacoosa Marina (I), Glascock Camp (J), Armstrong Camp (K), Shelby Volunteer Fire and Rescue Department Station 1 (L), Shelby Volunteer Fire and Rescue Department Station 2 (M), Shelby Volunteer Fire and Rescue Department Station 3 (N). Display/hide their locations on the map
Churches in zip code 35143 include: Providence Church (A), Cole Temple Church (B), Bay Spring Church (C), Bethlehem Church (D), First Baptist Church (E). Display/hide their locations on the map
Streams, rivers, and creeks: Spring Creek (A), Kelley Branch (B), Reed Creek (C), Mill Creek (D), Kates Branch (E), Waxahatchee Creek (F), Duck Branch (G), Camp Branch (H), Beaver Creek (I). Display/hide their locations on the map
Tourist attractions (not listed on the city page) : Shelby Iron Works Parks (Cultural Attractions- Events- & Facilities; 10268 Highway 42) (1), Bailey Electronic Services (Amusement & Theme Parks; 16230 Highway 42) (2). Display/hide their approximate locations on the map
Size of family households: 466 2-persons, 183 3-persons, 236 4-persons, 35 5-persons, 13 7-or-more-persons
Size of nonfamily households: 387 1-person, 17 2-persons, 5 3-persons
501 married couples with children.
5 single-parent households (5 men).
99.0% of residents of 35143 zip code speak English at home.
0.6% of residents speak Spanish at home (100% very well).
0.6% of residents speak Asian or Pacific Island language at home (100% well).
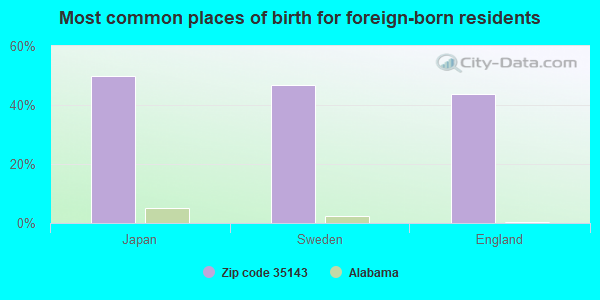
Foreign born population: 34 (1.1%) (49.7% of them are naturalized citizens)
This zip code:
1.1%
Whole state:
3.8%
50%Japan
47%Sweden
44%England
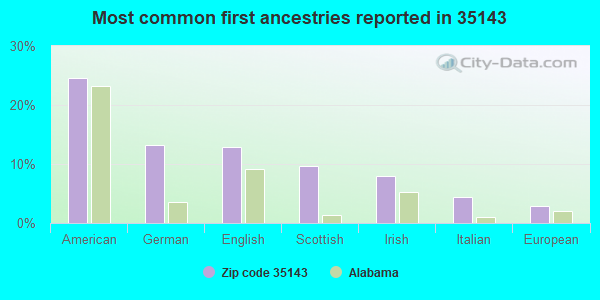
25%American
13%German
13%English
10%Scottish
8%Irish
4%Italian
3%European
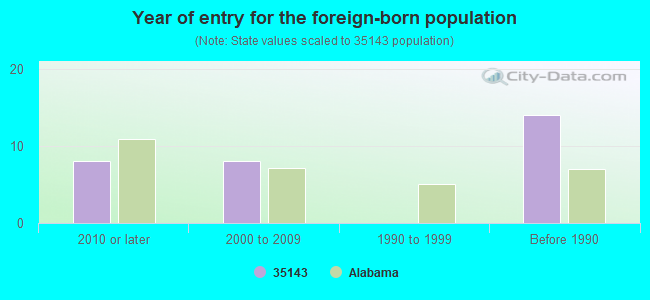
Year of entry for the foreign-born population
82010 or later
82000 to 2009
01990 to 1999
14Before 1990
Major facilities with environmental interests located in this zip code:
KODIAK MINE 1 (NEW CENTURY MINING INCORP in SHELBY COUNTY, AL)
National Pollutant Discharge Elimination System NON-MAJOR (Tracking pollutant discharge elimination systems) - permit Business SIC classification: BITUMINOUS COAL AND LIGNITE SURFACE MINING Organizations: NEW CENTURY MINING INCORP (CONTACT/OPERATOR)
Alternative names: NEW CENTURY MINING INCORP, NEW CENTURY MINING KODIAK MN 1
AEI LLC PROPERTY (ELLARD CONSTRUCTION in SHELBY COUNTY, AL)
National Pollutant Discharge Elimination System NON-MAJOR (Tracking pollutant discharge elimination systems) - permit Business SIC classification: GENERAL CONTRACTORS-NONRESIDENTIAL BUILDINGS, OTHER THAN INDUSTRIAL BUILDINGS AND WAREHOUSES Alternative names: ELLARD CONST AEI LLC PROPERTY
ALDOT HWY PROJECT (COLONIAL PROPERTIES TRUST in SHELBY COUNTY, AL)
National Pollutant Discharge Elimination System NON-MAJOR (Tracking pollutant discharge elimination systems) - permit Business SIC classification: HIGHWAY AND STREET CONSTRUCTION, EXCEPT ELEVATED HIGHWAYS Alternative names: ALDOT HIGHWAY 31 AND I 65, COLONIAL PROP TRUST ALDOT HWY, COLONIAL PROPERTIES TRUST
AMSOUTH GREYSTONE (AMSOUTH BANK in SHELBY COUNTY, AL)
National Pollutant Discharge Elimination System NON-MAJOR (Tracking pollutant discharge elimination systems) - permit Business SIC classification: GENERAL CONTRACTORS-NONRESIDENTIAL BUILDINGS, OTHER THAN INDUSTRIAL BUILDINGS AND WAREHOUSES Alternative names: AMSOUTH BANK GREYSTONE
ARBOR PLACE (MOIZ FOULAD in SHELBY COUNTY, AL)
National Pollutant Discharge Elimination System NON-MAJOR (Tracking pollutant discharge elimination systems) - permit Business SIC classification: GENERAL CONTRACTORS-NONRESIDENTIAL BUILDINGS, OTHER THAN INDUSTRIAL BUILDINGS AND WAREHOUSES Alternative names: MOIZ FOULAD ARBOR PLACE
BENT CREEK SD (BENT CREEK LLC in SHELBY COUNTY, AL)
National Pollutant Discharge Elimination System NON-MAJOR (Tracking pollutant discharge elimination systems) - permit Business SIC classification: GENERAL CONTRACTORS-SINGLE-FAMILY HOUSES Alternative names: BENT CREEK SD BENT CREEK LLC
BIRCH CREEK PHASE 2 (B HULSEY CO LLC in SHELBY COUNTY, AL)
National Pollutant Discharge Elimination System NON-MAJOR (Tracking pollutant discharge elimination systems) - permit Business SIC classification: GENERAL CONTRACTORS-SINGLE-FAMILY HOUSES Alternative names: B HULSEY CO LLC BIRCH CREEK
BIRCH CREEK SUBDIVISION (BIRCH CREEK DEVELOPMENT CO INC in SHELBY COUNTY, AL)
National Pollutant Discharge Elimination System NON-MAJOR (Tracking pollutant discharge elimination systems) - permit Business SIC classification: GENERAL CONTRACTORS-SINGLE-FAMILY HOUSES
BRIARWOOD CHRISTIAN HIGH SCHL (STONE BUILDING CO in SHELBY COUNTY, AL)
National Pollutant Discharge Elimination System NON-MAJOR (Tracking pollutant discharge elimination systems) - permit Business SIC classification: GENERAL CONTRACTORS-NONRESIDENTIAL BUILDINGS, OTHER THAN INDUSTRIAL BUILDINGS AND WAREHOUSES Alternative names: STONE BLDG CO BRIARWOOD CH SCH
CALERA COMMONS CENTER (LOVELADY PROPERTIES LLC in SHELBY COUNTY, AL)
National Pollutant Discharge Elimination System NON-MAJOR (Tracking pollutant discharge elimination systems) - permit Business SIC classification: HEAVY CONSTRUCTION Alternative names: LOVELADY PROP LLC CALERA COMMN
CEDAR LANE (CEDAR LANE LLC in SHELBY COUNTY, AL)
National Pollutant Discharge Elimination System NON-MAJOR (Tracking pollutant discharge elimination systems) - permit Business SIC classification: HEAVY CONSTRUCTION Alternative names: ADRIAN SUBDIVISION, CEDAR LANE LLC CEDAR LANE
CHADD PARKER CHERT PIT (CHADD PARKER CONSTRUCTION in SHELBY COUNTY, AL)
National Pollutant Discharge Elimination System NON-MAJOR (Tracking pollutant discharge elimination systems) - permit Business SIC classification: CRUSHED AND BROKEN STONE
CHINABERRY PHASE 2 (STAN PARKER DEVELOPMENT LLC in SHELBY, AL)
National Pollutant Discharge Elimination System NON-MAJOR (Tracking pollutant discharge elimination systems) - permit Business SIC classification: LAND SUBDIVIDERS AND DEVELOPERS, EXCEPT CEMETERIES Alternative names: S PARKER DEV LLC CHINABERRY
Housing units lacking complete plumbing facilities: 6.4% Housing units lacking complete kitchen facilities: 3.0%
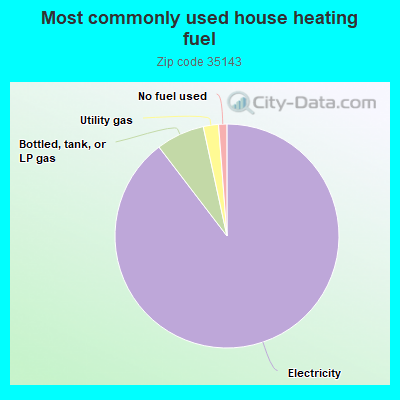
89.7%Electricity
7.0%Bottled, tank, or LP gas
2.2%Utility gas
1.2%No fuel used
Population in 1990: 1,846. Population change in the 1990s: +1,491 (+80.8%).
Place of birth for U.S.-born residents:
This state: 2,377
Northeast: 148
Midwest: 82
South: 435
West: 59
61% of the 35143 zip code residents lived in the same house 5 years ago. Out of people who lived in different houses, 60% lived in this county. Out of people who lived in different counties, 50% lived in Alabama.
94% of the 35143 zip code residents lived in the same house 1 year ago. Out of people who lived in different houses, 69% moved from this county. Out of people who lived in different houses, 15% moved from different county within same state. Out of people who lived in different houses, 12% moved from abroad.
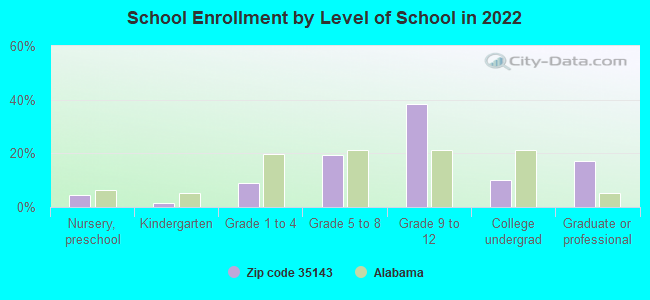
Private vs. public school enrollment:
Students in private schools in grades 1 to 8 (elementary and middle school):
Here:
0.0%
Alabama:
14.7%
Students in private schools in grades 9 to 12 (high school): 217
Here:
72.6%
Alabama:
16.3%
Students in private undergraduate colleges:
Here:
0.0%
Alabama:
14.6%
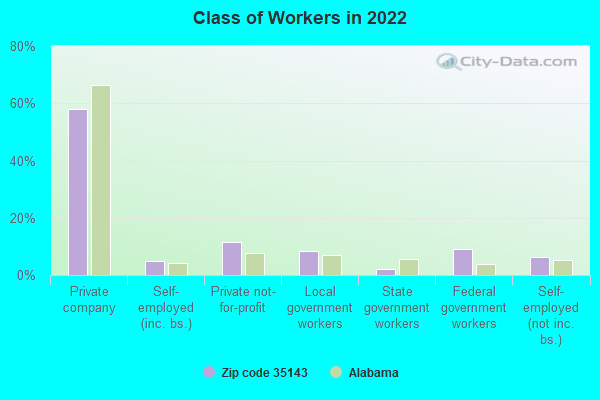
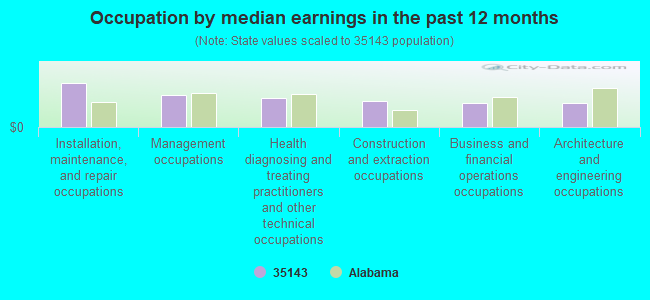
Occupation by median earnings in the past 12 months ($)
106,095Installation, maintenance, and repair occupations
77,083Management occupations
68,909Health diagnosing and treating practitioners and other technical occupations
63,586Construction and extraction occupations
57,989Business and financial operations occupations
56,899Architecture and engineering occupations
Top industries in this zip code by the number of employees in 2005:
Construction: Commercial and Institutional Building Construction (20-49 employees: 1 establishment)
Other Services (except Public Administration): Religious Organizations (1-4: 4)
Construction: Framing Contractors (5-9: 1)
Other Services (except Public Administration): Other Electronic and Precision Equipment Repair and Maintenance (5-9: 1)
Construction: Site Preparation Contractors (5-9: 1)
Other Services (except Public Administration): Beauty Salons (5-9: 1)
Fatal accident statistics in 2012:
Fatal accident count: 1
Vehicles involved in fatal accidents: 2
Fatal accidents caused by drunken drivers: 0
Fatalities: 1
Persons involved in fatal accidents: 5
Pedestrians involved in fatal accidents: 0
Home Mortgage Disclosure Act Aggregated Statistics For Year 2009 (Based on 1 partial tract)
A) FHA, FSA/RHS & VA Home Purchase Loans
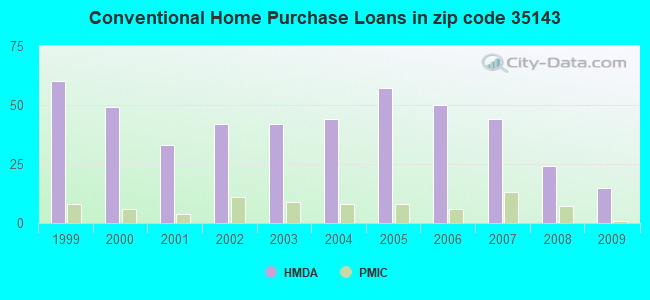
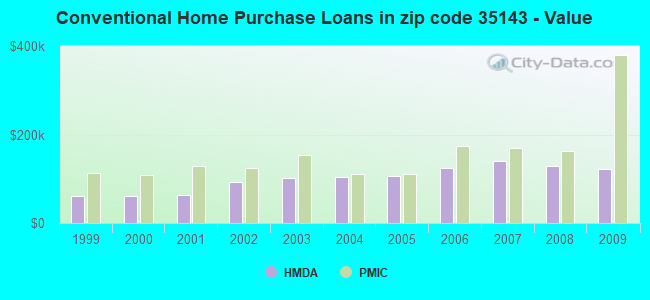
B) Conventional Home Purchase Loans
C) Refinancings
D) Home Improvement Loans
F) Non-occupant Loans on < 5 Family Dwellings (A B C & D)
G) Loans On Manufactured Home Dwelling (A B C & D)
Number
Average Value
Number
Average Value
Number
Average Value
Number
Average Value
Number
Average Value
Number
Average Value
LOANS ORIGINATED
9
$131,696
15
$121,628
61
$164,345
5
$18,340
13
$151,250
7
$50,010
APPLICATIONS APPROVED, NOT ACCEPTED
0
$0
3
$43,967
5
$150,596
0
$0
1
$76,340
2
$52,395
APPLICATIONS DENIED
5
$117,804
9
$109,010
26
$147,637
4
$18,745
2
$170,515
5
$47,970
APPLICATIONS WITHDRAWN
2
$132,575
2
$420,080
24
$183,522
0
$0
3
$156,440
0
$0
FILES CLOSED FOR INCOMPLETENESS
0
$0
0
$0
2
$126,250
0
$0
0
$0
0
$0
Aggregated Statistics For Year 2008 (Based on 1 partial tract)
A) FHA, FSA/RHS & VA Home Purchase Loans
B) Conventional Home Purchase Loans
C) Refinancings
D) Home Improvement Loans
F) Non-occupant Loans on < 5 Family Dwellings (A B C & D)
G) Loans On Manufactured Home Dwelling (A B C & D)
Number
Average Value
Number
Average Value
Number
Average Value
Number
Average Value
Number
Average Value
Number
Average Value
LOANS ORIGINATED
9
$104,242
24
$128,132
56
$134,260
9
$31,017
14
$131,412
16
$52,906
APPLICATIONS APPROVED, NOT ACCEPTED
1
$87,180
3
$116,990
4
$105,245
1
$56,010
1
$117,890
3
$66,400
APPLICATIONS DENIED
4
$101,520
12
$95,497
29
$135,230
12
$53,790
5
$83,654
12
$81,607
APPLICATIONS WITHDRAWN
1
$216,820
4
$151,208
13
$138,463
1
$174,810
1
$225,850
2
$110,890
FILES CLOSED FOR INCOMPLETENESS
1
$151,770
2
$89,890
4
$134,720
0
$0
0
$0
1
$93,950
Aggregated Statistics For Year 2007 (Based on 1 partial tract)
A) FHA, FSA/RHS & VA Home Purchase Loans
B) Conventional Home Purchase Loans
C) Refinancings
D) Home Improvement Loans
F) Non-occupant Loans on < 5 Family Dwellings (A B C & D)
G) Loans On Manufactured Home Dwelling (A B C & D)
Number
Average Value
Number
Average Value
Number
Average Value
Number
Average Value
Number
Average Value
Number
Average Value
LOANS ORIGINATED
4
$112,022
44
$139,021
57
$127,443
16
$34,499
14
$124,056
13
$52,085
APPLICATIONS APPROVED, NOT ACCEPTED
0
$0
10
$78,054
10
$132,529
1
$49,240
2
$149,285
8
$60,754
APPLICATIONS DENIED
1
$71,370
16
$93,926
33
$140,958
14
$57,431
5
$124,218
11
$75,804
APPLICATIONS WITHDRAWN
0
$0
5
$116,538
18
$164,118
2
$109,085
1
$119,700
1
$4,520
FILES CLOSED FOR INCOMPLETENESS
0
$0
1
$132,350
9
$165,874
0
$0
0
$0
1
$69,560
Aggregated Statistics For Year 2006 (Based on 1 partial tract)
A) FHA, FSA/RHS & VA Home Purchase Loans
B) Conventional Home Purchase Loans
C) Refinancings
D) Home Improvement Loans
F) Non-occupant Loans on < 5 Family Dwellings (A B C & D)
G) Loans On Manufactured Home Dwelling (A B C & D)
Number
Average Value
Number
Average Value
Number
Average Value
Number
Average Value
Number
Average Value
Number
Average Value
LOANS ORIGINATED
1
$114,730
50
$124,516
59
$129,010
11
$44,718
16
$110,384
10
$44,809
APPLICATIONS APPROVED, NOT ACCEPTED
1
$30,720
14
$94,211
10
$173,950
3
$37,190
3
$121,207
9
$47,680
APPLICATIONS DENIED
0
$0
23
$73,352
33
$132,430
15
$52,156
4
$83,790
15
$47,489
APPLICATIONS WITHDRAWN
0
$0
8
$118,966
17
$122,809
3
$54,807
4
$112,360
1
$15,810
FILES CLOSED FOR INCOMPLETENESS
0
$0
4
$136,300
7
$130,477
1
$79,050
2
$140,025
0
$0
Aggregated Statistics For Year 2005 (Based on 1 partial tract)
A) FHA, FSA/RHS & VA Home Purchase Loans
B) Conventional Home Purchase Loans
C) Refinancings
D) Home Improvement Loans
F) Non-occupant Loans on < 5 Family Dwellings (A B C & D)
G) Loans On Manufactured Home Dwelling (A B C & D)
Number
Average Value
Number
Average Value
Number
Average Value
Number
Average Value
Number
Average Value
Number
Average Value
LOANS ORIGINATED
3
$118,797
57
$106,474
56
$121,870
19
$32,118
15
$104,102
21
$42,524
APPLICATIONS APPROVED, NOT ACCEPTED
0
$0
16
$82,520
12
$103,062
2
$35,460
5
$80,584
11
$57,284
APPLICATIONS DENIED
1
$43,810
36
$69,135
42
$93,523
14
$45,073
2
$18,520
29
$43,176
APPLICATIONS WITHDRAWN
0
$0
12
$109,349
27
$149,346
3
$133,403
1
$64,590
4
$85,598
FILES CLOSED FOR INCOMPLETENESS
0
$0
1
$344,650
8
$124,388
0
$0
1
$142,740
0
$0
Aggregated Statistics For Year 2004 (Based on 1 partial tract)
A) FHA, FSA/RHS & VA Home Purchase Loans
B) Conventional Home Purchase Loans
C) Refinancings
D) Home Improvement Loans
F) Non-occupant Loans on < 5 Family Dwellings (A B C & D)
G) Loans On Manufactured Home Dwelling (A B C & D)
Number
Average Value
Number
Average Value
Number
Average Value
Number
Average Value
Number
Average Value
Number
Average Value
LOANS ORIGINATED
2
$134,155
44
$104,353
67
$108,651
21
$17,036
12
$114,355
24
$39,392
APPLICATIONS APPROVED, NOT ACCEPTED
0
$0
11
$76,173
14
$94,276
2
$49,235
0
$0
9
$48,833
APPLICATIONS DENIED
1
$70,010
22
$85,269
42
$111,753
10
$29,225
3
$69,713
15
$42,189
APPLICATIONS WITHDRAWN
0
$0
5
$139,484
24
$123,314
1
$134,150
1
$219,070
3
$47,580
FILES CLOSED FOR INCOMPLETENESS
0
$0
1
$47,880
25
$112,455
0
$0
0
$0
3
$102,837
Aggregated Statistics For Year 2003 (Based on 1 partial tract)
A) FHA, FSA/RHS & VA Home Purchase Loans
B) Conventional Home Purchase Loans
C) Refinancings
D) Home Improvement Loans
F) Non-occupant Loans on < 5 Family Dwellings (A B C & D)
Number
Average Value
Number
Average Value
Number
Average Value
Number
Average Value
Number
Average Value
LOANS ORIGINATED
5
$108,408
42
$102,299
119
$102,115
14
$17,519
16
$92,655
APPLICATIONS APPROVED, NOT ACCEPTED
1
$133,250
8
$74,756
20
$98,290
1
$42,010
2
$114,055
APPLICATIONS DENIED
0
$0
15
$71,218
41
$87,949
8
$25,578
3
$58,270
APPLICATIONS WITHDRAWN
1
$123,310
6
$113,227
33
$103,248
1
$58,720
1
$146,800
FILES CLOSED FOR INCOMPLETENESS
0
$0
0
$0
4
$93,275
0
$0
0
$0
Aggregated Statistics For Year 2002 (Based on 1 partial tract)
A) FHA, FSA/RHS & VA Home Purchase Loans
B) Conventional Home Purchase Loans
C) Refinancings
D) Home Improvement Loans
F) Non-occupant Loans on < 5 Family Dwellings (A B C & D)
Number
Average Value
Number
Average Value
Number
Average Value
Number
Average Value
Number
Average Value
LOANS ORIGINATED
6
$102,160
42
$92,749
87
$107,079
16
$10,841
10
$86,184
APPLICATIONS APPROVED, NOT ACCEPTED
0
$0
10
$81,622
11
$96,376
0
$0
1
$67,300
APPLICATIONS DENIED
2
$54,430
24
$50,572
25
$86,835
4
$29,472
2
$48,560
APPLICATIONS WITHDRAWN
0
$0
5
$109,944
16
$86,275
1
$89,440
1
$163,060
FILES CLOSED FOR INCOMPLETENESS
0
$0
0
$0
9
$96,764
0
$0
0
$0
Aggregated Statistics For Year 2001 (Based on 1 partial tract)
A) FHA, FSA/RHS & VA Home Purchase Loans
B) Conventional Home Purchase Loans
C) Refinancings
D) Home Improvement Loans
F) Non-occupant Loans on < 5 Family Dwellings (A B C & D)
Number
Average Value
Number
Average Value
Number
Average Value
Number
Average Value
Number
Average Value
LOANS ORIGINATED
5
$91,696
33
$63,745
84
$90,716
14
$12,551
8
$71,764
APPLICATIONS APPROVED, NOT ACCEPTED
0
$0
7
$34,329
7
$103,891
0
$0
0
$0
APPLICATIONS DENIED
1
$102,990
45
$37,662
27
$75,032
6
$17,315
4
$27,552
APPLICATIONS WITHDRAWN
0
$0
2
$98,020
15
$89,707
2
$57,820
0
$0
FILES CLOSED FOR INCOMPLETENESS
0
$0
0
$0
5
$81,668
0
$0
0
$0
Aggregated Statistics For Year 2000 (Based on 1 partial tract)
A) FHA, FSA/RHS & VA Home Purchase Loans
B) Conventional Home Purchase Loans
C) Refinancings
D) Home Improvement Loans
F) Non-occupant Loans on < 5 Family Dwellings (A B C & D)
Number
Average Value
Number
Average Value
Number
Average Value
Number
Average Value
Number
Average Value
LOANS ORIGINATED
3
$89,737
49
$59,966
40
$74,530
28
$8,905
6
$64,443
APPLICATIONS APPROVED, NOT ACCEPTED
3
$34,630
14
$48,977
8
$71,820
0
$0
1
$58,270
APPLICATIONS DENIED
1
$130,990
56
$36,475
13
$72,237
2
$4,745
1
$44,270
APPLICATIONS WITHDRAWN
1
$53,750
3
$110,367
5
$69,200
0
$0
0
$0
FILES CLOSED FOR INCOMPLETENESS
0
$0
0
$0
5
$80,132
0
$0
0
$0
Aggregated Statistics For Year 1999 (Based on 1 partial tract)
A) FHA, FSA/RHS & VA Home Purchase Loans
B) Conventional Home Purchase Loans
C) Refinancings
D) Home Improvement Loans
F) Non-occupant Loans on < 5 Family Dwellings (A B C & D)
Detailed PMIC statistics for the following Tracts:0307.02
2005 - 2018 National Fire Incident Reporting System (NFIRS) incidents
Based on the data from the years 2005 - 2018 the average number of fire incidents per year is 31. The highest number of fire incidents - 61 took place in 2007, and the least - 11 in 2005. The data has an increasing trend.
When looking into fire subcategories, the most incidents belonged to: Outside Fires (54.1%), and Structure Fires (30.5%).
Fire incident types reported to NFIRS in Zip Code 35143


 Nearest zip codes: 35051, 35151, 35186, 35046, 35040, 35183.


 Based on the data from the years 2005 - 2018 the average number of fire incidents per year is 31. The highest number of fire incidents - 61 took place in 2007, and the least - 11 in 2005. The data has an increasing trend.
 When looking into fire subcategories, the most incidents belonged to: Outside Fires (54.1%), and Structure Fires (30.5%).