Estimated zip code population in 2022: 27,156 Zip code population in 2010: 24,267 Zip code population in 2000: 21,124
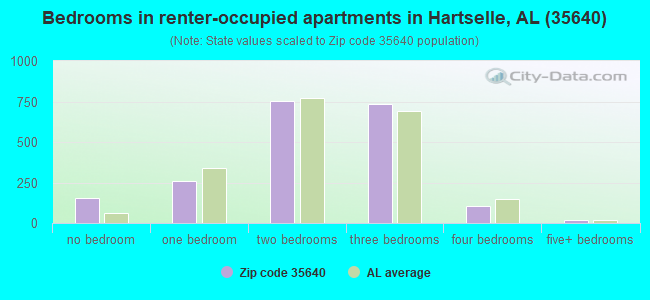
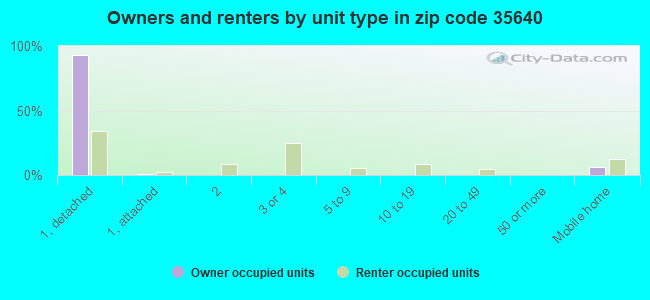
Houses and condos: 11,467 Renter-occupied apartments: 2,041
% of renters here:
19%
State:
30%
March 2022 cost of living index in zip code 35640: 81.3 (low, U.S. average is 100)
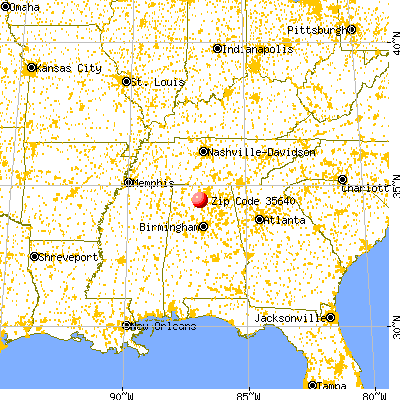
Land area: 109.9 sq. mi. Water area: 1.1 sq. mi.
Population density: 247 people per square mile
(very low).
OSM Map
General Map
Google Map
MSN Map
OSM Map
General Map
Google Map
MSN Map
OSM Map
General Map
Google Map
MSN Map
OSM Map
General Map
Google Map
MSN Map
Please wait while loading the map...
Real estate property taxes paid for housing units in 2022:
This zip code:
0.3% ($639)
Alabama:
0.4% ($718)
Median real estate property taxes paid for housing units with mortgages in 2022: $711 (0.3%) Median real estate property taxes paid for housing units with no mortgage in 2022: $566 (0.3%)
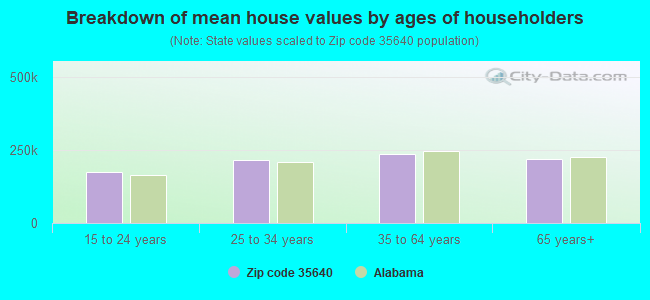
Estimated median house/condo value in 2022: $198,100
35640:
$198,100
Alabama:
$200,900
According to our research of Alabama and other state lists, there were 39 registered sex offenders living in 35640 zip code as of April 27, 2024. The ratio of all residents to sex offenders in zip code 35640 is 655 to 1. The ratio of registered sex offenders to all residents in this zip code is lower than the state average.
Median resident age:
This zip code:
41.1 years
Alabama median age:
39.6 years
Average household size:
This zip code:
2.6 people
Alabama:
2.5 people
Averages for the 2020 tax year for zip code 35640, filed in 2021:
Average Adjusted Gross Income (AGI) in 2020: $72,741 (Individual Income Tax Returns)
Here:
$72,741
State:
$63,984
Salary/wage: $56,782 (reported on 82.7% of returns)
Here:
$56,782
State:
$52,834
(% of AGI for various income ranges: 1140.6% for AGIs below $25k, 3596.3% for AGIs $25k-50k, 6569.1% for AGIs $50k-75k, 9428.4% for AGIs $75k-100k, 17398.3% for AGIs $100k-200k, 62945.0% for AGIs over 200k)
Taxable interest for individuals: $1,540 (reported on 30.3% of returns)
This zip code:
$1,540
Alabama:
$1,615
(% of AGI for various income ranges: 16.7% for AGIs below $25k, 22.9% for AGIs $25k-50k, 46.4% for AGIs $50k-75k, 61.4% for AGIs $75k-100k, 86.6% for AGIs $100k-200k, 1950.0% for AGIs over 200k)
Ordinary dividends: $2,955 (reported on 13.0% of returns)
Here:
$2,955
State:
$7,660
(% of AGI for various income ranges: 12.6% for AGIs below $25k, 21.2% for AGIs $25k-50k, 52.8% for AGIs $50k-75k, 70.5% for AGIs $75k-100k, 115.2% for AGIs $100k-200k, 884.2% for AGIs over 200k)
Net capital gain/loss in AGI: +$17,714 (reported on 11.7% of returns)
Here:
+$17,714
State:
+$23,528
(% of AGI for various income ranges: 9.2% for AGIs below $25k, 16.1% for AGIs $25k-50k, 53.4% for AGIs $50k-75k, 124.4% for AGIs $75k-100k, 385.8% for AGIs $100k-200k, 14460.0% for AGIs over 200k)
Profit/loss from business: +$8,670 (reported on 15.0% of returns)
Here:
+$8,670
State:
+$9,534
(% of AGI for various income ranges: 117.1% for AGIs below $25k, 96.7% for AGIs $25k-50k, 165.8% for AGIs $50k-75k, 173.9% for AGIs $75k-100k, 263.3% for AGIs $100k-200k, 2577.5% for AGIs over 200k)
Taxable individual retirement arrangement distribution: $16,147 (reported on 8.7% of returns)
35640:
$16,147
Alabama:
$19,004
(% of AGI for various income ranges: 51.2% for AGIs below $25k, 105.6% for AGIs $25k-50k, 199.8% for AGIs $50k-75k, 280.9% for AGIs $75k-100k, 548.0% for AGIs $100k-200k, 1256.7% for AGIs over 200k)
Total itemized deductions: $33,199 (reported on 6.0% of returns)
Here:
$33,199
State:
$37,338
(% of AGI for various income ranges: 41.8% for AGIs below $25k, 78.3% for AGIs $25k-50k, 137.0% for AGIs $50k-75k, 244.6% for AGIs $75k-100k, 740.5% for AGIs $100k-200k, 6772.5% for AGIs over 200k)
Charity contributions: $15,882 (reported on 5.3% of returns)
Here:
$15,882
State:
$18,005
(% of AGI for various income ranges: 2.7% for AGIs below $25k, 15.3% for AGIs $25k-50k, 48.4% for AGIs $50k-75k, 79.4% for AGIs $75k-100k, 310.5% for AGIs $100k-200k, 3833.3% for AGIs over 200k)
Taxes paid: $6,056 (reported on 5.9% of returns)
35640:
$6,056
State:
$6,484
(% of AGI for various income ranges: 1.4% for AGIs below $25k, 6.4% for AGIs $25k-50k, 19.1% for AGIs $50k-75k, 40.7% for AGIs $75k-100k, 161.6% for AGIs $100k-200k, 1321.7% for AGIs over 200k)
Earned income credit: $2,336 (reported on 16.3% of returns)
Here:
$2,336
State:
$2,628
(% of AGI for various income ranges: 96.1% for AGIs below $25k, 76.9% for AGIs $25k-50k, 1.5% for AGIs $50k-75k)
Percentage of individuals using paid preparers for their 2020 taxes: 95.2%
Here:
95%
State:
93%
(% for various income ranges: 94.2% for AGIs below $25k, 95.7% for AGIs $25k-50k, 95.3% for AGIs $50k-75k, 95.9% for AGIs $75k-100k, 96.0% for AGIs $100k-200k, 94.6% for AGIs over 200k)
Averages for the 2012 tax year for zip code 35640, filed in 2013:
Average Adjusted Gross Income (AGI) in 2012: $52,837 (Individual Income Tax Returns)
Here:
$52,837
State:
$52,001
Salary/wage: $46,427 (reported on 84.5% of returns)
Here:
$46,427
State:
$43,822
(% of AGI for various income ranges: 72.6% for AGIs below $25k, 77.2% for AGIs $25k-50k, 79.5% for AGIs $50k-75k, 81.5% for AGIs $75k-100k, 81.5% for AGIs $100k-200k, 40.6% for AGIs over 200k)
Taxable interest for individuals: $1,185 (reported on 30.7% of returns)
This zip code:
$1,185
Alabama:
$1,592
(% of AGI for various income ranges: 1.2% for AGIs below $25k, 0.7% for AGIs $25k-50k, 0.5% for AGIs $50k-75k, 0.5% for AGIs $75k-100k, 0.6% for AGIs $100k-200k, 1.2% for AGIs over 200k)
Ordinary dividends: $2,148 (reported on 13.3% of returns)
Here:
$2,148
State:
$5,697
(% of AGI for various income ranges: 0.7% for AGIs below $25k, 0.5% for AGIs $25k-50k, 0.4% for AGIs $50k-75k, 0.5% for AGIs $75k-100k, 0.5% for AGIs $100k-200k, 0.9% for AGIs over 200k)
Net capital gain/loss in AGI: +$5,645 (reported on 9.6% of returns)
Here:
+$5,645
State:
+$13,286
(% of AGI for various income ranges: 0.2% for AGIs below $25k, 0.1% for AGIs $25k-50k, 0.2% for AGIs $50k-75k, 0.5% for AGIs $75k-100k, 0.8% for AGIs $100k-200k, 5.1% for AGIs over 200k)
Profit/loss from business: +$7,151 (reported on 15.9% of returns)
Here:
+$7,151
State:
+$9,151
(% of AGI for various income ranges: 7.9% for AGIs below $25k, 2.8% for AGIs $25k-50k, 1.6% for AGIs $50k-75k, 1.0% for AGIs $75k-100k, 1.7% for AGIs $100k-200k, 0.5% for AGIs over 200k)
Taxable individual retirement arrangement distribution: $13,432 (reported on 8.8% of returns)
35640:
$13,432
Alabama:
$14,992
(% of AGI for various income ranges: 3.2% for AGIs below $25k, 2.3% for AGIs $25k-50k, 2.1% for AGIs $50k-75k, 2.0% for AGIs $75k-100k, 2.8% for AGIs $100k-200k, 1.0% for AGIs over 200k)
Total itemized deductions: $19,397 (20% of AGI, reported on 28.9% of returns)
Here:
$19,397
State:
$21,388
Here:
19.8% of AGI
State:
20.1% of AGI
(% of AGI for various income ranges: 8.8% for AGIs below $25k, 8.7% for AGIs $25k-50k, 10.4% for AGIs $50k-75k, 11.6% for AGIs $75k-100k, 13.0% for AGIs $100k-200k, 8.4% for AGIs over 200k)
Charity contributions: $5,475 (reported on 25.0% of returns)
Here:
$5,475
State:
$5,925
(% of AGI for various income ranges: 1.2% for AGIs below $25k, 1.6% for AGIs $25k-50k, 2.2% for AGIs $50k-75k, 2.9% for AGIs $75k-100k, 3.7% for AGIs $100k-200k, 2.6% for AGIs over 200k)
Taxes paid: $4,355 (reported on 28.8% of returns)
35640:
$4,355
State:
$5,272
(% of AGI for various income ranges: 0.8% for AGIs below $25k, 1.4% for AGIs $25k-50k, 2.1% for AGIs $50k-75k, 2.5% for AGIs $75k-100k, 3.5% for AGIs $100k-200k, 2.7% for AGIs over 200k)
Earned income credit: $2,387 (reported on 20.0% of returns)
Here:
$2,387
State:
$2,646
(% of AGI for various income ranges: 7.5% for AGIs below $25k, 1.4% for AGIs $25k-50k)
Percentage of individuals using paid preparers for their 2012 taxes: 62.4%
Here:
62%
State:
60%
(% for various income ranges: 57.4% for AGIs below $25k, 65.6% for AGIs $25k-50k, 65.7% for AGIs $50k-75k, 67.6% for AGIs $75k-100k, 62.6% for AGIs $100k-200k, 73.3% for AGIs over 200k)
Averages for the 2004 tax year for zip code 35640, filed in 2005:
Average Adjusted Gross Income (AGI) in 2004: $41,911 (Individual Income Tax Returns)
Here:
$41,911
State:
$42,302
Salary/wage: $39,306 (reported on 85.2% of returns)
Here:
$39,306
State:
$36,626
(% of AGI for various income ranges: 102.4% for AGIs below $10k, 76.1% for AGIs $10k-25k, 82.7% for AGIs $25k-50k, 83.9% for AGIs $50k-75k, 85.3% for AGIs $75k-100k, 69.7% for AGIs over 100k)
Taxable interest for individuals: $1,457 (reported on 37.8% of returns)
This zip code:
$1,457
Alabama:
$1,827
(% of AGI for various income ranges: 5.2% for AGIs below $10k, 1.7% for AGIs $10k-25k, 1.2% for AGIs $25k-50k, 1.0% for AGIs $50k-75k, 1.0% for AGIs $75k-100k, 1.5% for AGIs over 100k)
Taxable dividends: $2,619 (reported on 17.0% of returns)
Here:
$2,619
State:
$4,206
(% of AGI for various income ranges: 2.1% for AGIs below $10k, 1.0% for AGIs $10k-25k, 0.6% for AGIs $25k-50k, 0.5% for AGIs $50k-75k, 0.6% for AGIs $75k-100k, 2.3% for AGIs over 100k)
Net capital gain/loss: +$7,133 (reported on 12.8% of returns)
Here:
+$7,133
State:
+$13,031
(% of AGI for various income ranges: -0.9% for AGIs below $10k, -0.0% for AGIs $10k-25k, 0.4% for AGIs $25k-50k, 0.6% for AGIs $50k-75k, 0.7% for AGIs $75k-100k, 7.5% for AGIs over 100k)
Profit/loss from business: +$5,480 (reported on 16.3% of returns)
Here:
+$5,480
State:
+$8,302
(% of AGI for various income ranges: 8.8% for AGIs below $10k, 4.8% for AGIs $10k-25k, 1.7% for AGIs $25k-50k, 1.3% for AGIs $50k-75k, 1.5% for AGIs $75k-100k, 2.2% for AGIs over 100k)
IRA payment deduction: $2,987 (reported on 1.6% of returns)
35640:
$2,987
Alabama:
$3,006
(% of AGI for various income ranges: 0.2% for AGIs $10k-25k, 0.1% for AGIs $25k-50k, 0.1% for AGIs $50k-75k, 0.1% for AGIs $75k-100k, 0.1% for AGIs over 100k)
Self-employed pension: $17,900 (reported on 0.1% of returns)
Here:
$17,900
Alabama:
$17,165
Total itemized deductions: $15,699 (21% of AGI, reported on 30.9% of returns)
Here:
$15,699
State:
$17,623
Here:
21.3% of AGI
State:
20.8% of AGI
(% of AGI for various income ranges: 7.8% for AGIs below $10k, 8.0% for AGIs $10k-25k, 10.3% for AGIs $25k-50k, 12.0% for AGIs $50k-75k, 13.5% for AGIs $75k-100k, 12.7% for AGIs over 100k)
Charity contributions deductions: $4,399 (6% of AGI, reported on 28.1% of returns)
Here:
$4,399
State:
$4,768
Here:
5.8% of AGI
State:
5.4% of AGI
(% of AGI for various income ranges: 0.9% for AGIs below $10k, 1.5% for AGIs $10k-25k, 2.3% for AGIs $25k-50k, 2.8% for AGIs $50k-75k, 3.5% for AGIs $75k-100k, 4.0% for AGIs over 100k)
Total tax: $5,284 (reported on 75.7% of returns)
35640:
$5,284
State:
$6,905
(% of AGI for various income ranges: 4.2% for AGIs below $10k, 3.7% for AGIs $10k-25k, 5.9% for AGIs $25k-50k, 8.2% for AGIs $50k-75k, 10.2% for AGIs $75k-100k, 16.4% for AGIs over 100k)
Earned income credit: $1,732 (reported on 17.2% of returns)
Here:
$1,732
State:
$2,048
Percentage of individuals using paid preparers for their 2004 taxes: 68.3%
Here:
68%
State:
65%
(% for various income ranges: 61.2% for AGIs below $10k, 69.3% for AGIs $10k-25k, 71.5% for AGIs $25k-50k, 69.4% for AGIs $50k-75k, 66.9% for AGIs $75k-100k, 71.4% for AGIs over 100k)
Likely homosexual households (counted as self-reported same-sex unmarried-partner households)
Lesbian couples: 0.1% of all households
Gay men: 0.0% of all households
Household received Food Stamps/SNAP in the past 12 months: 1,450 Household did not receive Food Stamps/SNAP in the past 12 months: 9,179
Women who had a birth in the past 12 months: 147 (122 now married, 30 unmarried) Women who did not have a birth in the past 12 months: 6,894 (3,135 now married, 3,757 unmarried)
Housing units in zip code 35640 with a mortgage: 4,482 (506 second mortgage, 7 home equity loan, 467 both second mortgage and home equity loan) Houses without a mortgage: 199
Median monthly owner costs for units with a mortgage: $1,199 Median monthly owner costs for units without a mortgage: $407
Residents with income below the poverty level in 2022:
This zip code:
12.5%
Whole state:
16.2%
Residents with income below 50% of the poverty level in 2022:
This zip code:
8.8%
Whole state:
8.6%
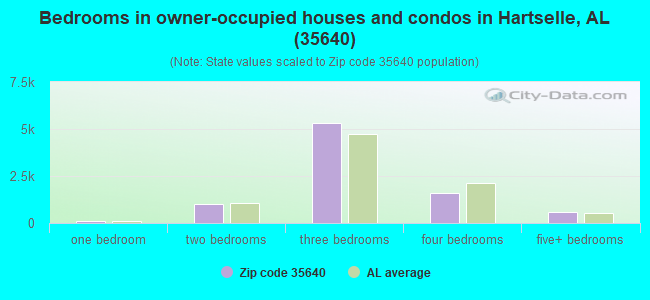
Median number of rooms in houses and condos:
Here:
6.7
State:
6.5
Median number of rooms in apartments:
Here:
4.8
State:
4.7
Notable locations in this zip code not listed on our city pages
In group quarters: 29 (-1 institutionalized population)
Size of family households: 3,735 2-persons, 1,839 3-persons, 1,319 4-persons, 662 5-persons, 157 6-persons, 126 7-or-more-persons
Size of nonfamily households: 2,501 1-person, 280 2-persons, 2 3-persons
4,166 married couples with children.
1,086 single-parent households (350 men, 736 women).
97.8% of residents of 35640 zip code speak English at home.
1.6% of residents speak Spanish at home (86% very well, 7% well, 7% not well).
0.2% of residents speak other Indo-European language at home (100% very well).
0.2% of residents speak Asian or Pacific Island language at home (100% very well).
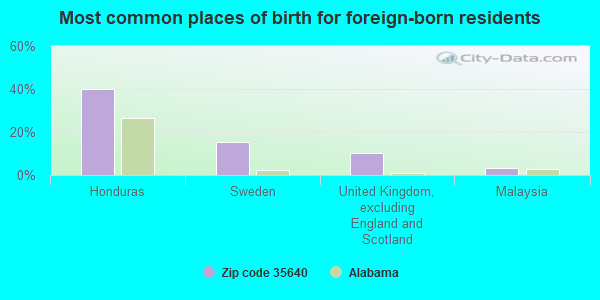
Foreign born population: 196 (0.7%) (44.2% of them are naturalized citizens)
This zip code:
0.7%
Whole state:
3.8%
40%Honduras
15%Sweden
10%United Kingdom, excluding England and Scotland
3%Malaysia
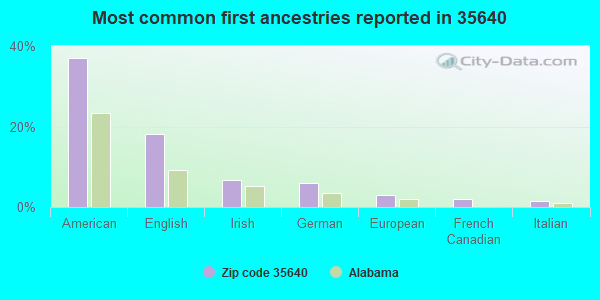
37%American
18%English
7%Irish
6%German
3%European
2%French Canadian
2%Italian
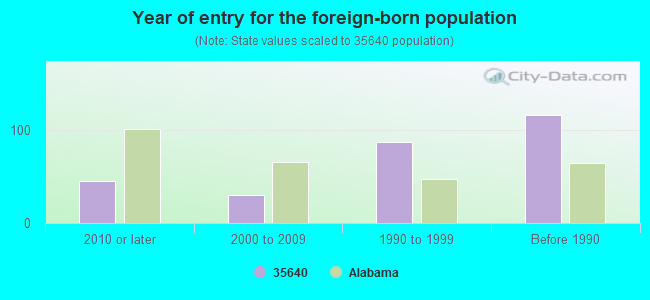
Year of entry for the foreign-born population
452010 or later
302000 to 2009
871990 to 1999
116Before 1990
Major facilities with environmental interests located in this zip code:
CERRO WIRE & CABLE CO INC (1099 THOMPSON RD. S.E. in HARTSELLE, AL)
CRITERIA AND HAZARDOUS AIR POLLUTANT INVENTORY (Inventory of air pollution sources) National Pollutant Discharge Elimination System NON-MAJOR (Tracking pollutant discharge elimination systems) - permit Small Quantity Generators, between 100 kg and 1000 kg of hazardous waste/month (Resource Conservation and Recovery Act (tracking hazardous waste)) - notification TRI REPORTER (Tracking of toxic chemicals releasing facilities) Business SIC classification: DRAWING AND INSULATING OF NONFERROUS WIRE Business NAICS classification: COPPER WIRE (EXCEPT MECHANICAL) DRAWING.
NCB INCORPORATION HIGHWAY 36 SITE (HIGHWAY 36 in HARTSELLE, AL)
National Pollutant Discharge Elimination System NON-MAJOR (Tracking pollutant discharge elimination systems) - permit National Pollutant Discharge Elimination System NON-MAJOR (Tracking pollutant discharge elimination systems) - permit Business SIC classification: GENERAL CONTRACTORS-RESIDENTIAL BUILDINGS, OTHER THAN SINGLE-FAMILY Alternative names: NCB INCORPORATION HWY 36 SITE
ENQUIRER PRINTING CO INC (405 NW CHESTNUT STREET in HARTSELLE, AL)
Conditionally Exempt Small Quantity Generators, less than 100 kg/month of hazardous waste (Resource Conservation and Recovery Act (tracking hazardous waste)) - notification Organizations: CLIFFORD B PARKER (CONTACT/OPERATOR)
, SHANNON PARKER (CONTACT/OPERATOR)
, CLIFFORD PARKER (CONTACT/OWNER)
LEE HAL POULTRY FARM (HAL F LEE in HARTSELLE, AL)
National Pollutant Discharge Elimination System NON-MAJOR (Tracking pollutant discharge elimination systems) - permit Business SIC classification: NONCLASSIFIABLE ESTABLISHMENTS Organizations: HAL LEE POULTRY FARM (CONTACT/OPERATOR)
Alternative names: HAL LEE POULTRY FARM, HAL LEE POULTRY FARM FACILITY, LEE HAL F HAL LEE POULTRY FARM
ACE AUTO BODY (1998 HWY 31 NORTH in HARTSELLE, AL)
Small Quantity Generators, between 100 kg and 1000 kg of hazardous waste/month (Resource Conservation and Recovery Act (tracking hazardous waste)) - notification Organizations: MYRON D THOMPSON (CONTACT/OPERATOR)
, MYRON THOMPSON (CONTACT/OWNER)
Alternative names: ACE BODY SHOP INC
ADVANCE AUTO PARTS #9090 (902 HIGHWAY 31 SW in HARTSELLE, AL)
(Resource Conservation and Recovery Act (tracking hazardous waste))
ALABAMA TOYOTA TRANSMISSION (1600 RICE ROAD in HARTSELLE, AL)
(Resource Conservation and Recovery Act (tracking hazardous waste)) Organizations: PAUL M. WALKER (CONTACT/OWNER)
AMERICAN RECLYCLING COMPANY (2800 HIGHWAY 31 SOUTH in HARTSELLE, AL)
National Pollutant Discharge Elimination System NON-MAJOR (Tracking pollutant discharge elimination systems) - permit Business SIC classification: SCRAP AND WASTE MATERIALS Organizations: AMERICAN RECYCLING COMPANY (CONTACT/OWNER)
Alternative names: AMERICAN RECYCLING CO
C AND L WOOD PRODUCTS INC (HWY 36 E in HARTSELLE, AL)
National Pollutant Discharge Elimination System NON-MAJOR (Tracking pollutant discharge elimination systems) - permit Business SIC classification: WOOD PALLETS AND SKIDS
ROUNTREE FIELD (450 AIRPORT ROAD in HARTSELLE, AL)
Housing units lacking complete plumbing facilities: 3.1% Housing units lacking complete kitchen facilities: 3.5%
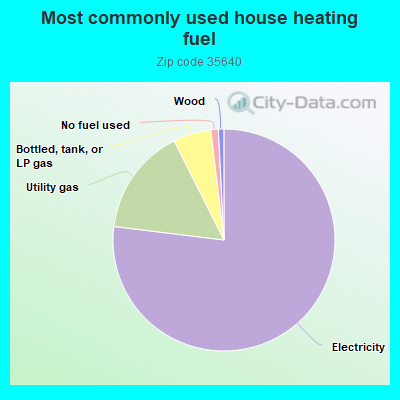
76.8%Electricity
15.6%Utility gas
5.5%Bottled, tank, or LP gas
1.1%No fuel used
0.8%Wood
Population in 1990: 17,963. Population change in the 1990s: +3,161 (+17.6%).
Place of birth for U.S.-born residents:
This state: 20,153
Northeast: 452
Midwest: 2,119
South: 3,171
West: 823
63% of the 35640 zip code residents lived in the same house 5 years ago. Out of people who lived in different houses, 71% lived in this county. Out of people who lived in different counties, 50% lived in Alabama.
95% of the 35640 zip code residents lived in the same house 1 year ago. Out of people who lived in different houses, 48% moved from this county. Out of people who lived in different houses, 33% moved from different county within same state. Out of people who lived in different houses, 23% moved from different state.
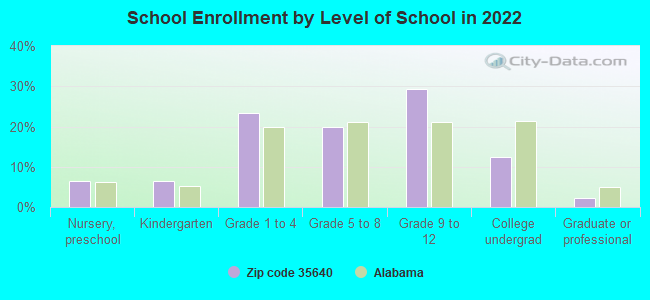
Private vs. public school enrollment:
Students in private schools in grades 1 to 8 (elementary and middle school): 209
Here:
8.0%
Alabama:
14.7%
Students in private schools in grades 9 to 12 (high school): 144
Here:
8.2%
Alabama:
16.3%
Students in private undergraduate colleges: 12
Here:
1.7%
Alabama:
14.6%
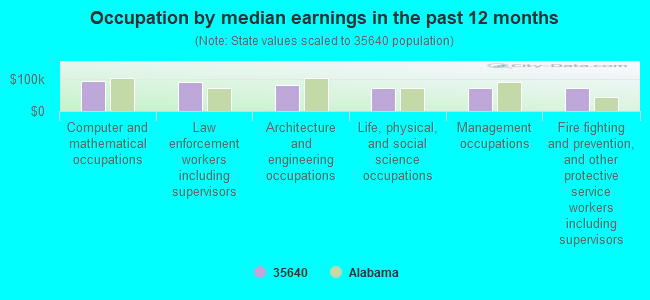
Occupation by median earnings in the past 12 months ($)
94,752Computer and mathematical occupations
89,694Law enforcement workers including supervisors
82,055Architecture and engineering occupations
73,480Life, physical, and social science occupations
73,097Management occupations
72,661Fire fighting and prevention, and other protective service workers including supervisors
Companies with federal contracts located in this zip code (HARTSELLE, AL):
LEKTRON INC (2106 HIGHWAY 31 NW; small business) : $13,067,662 in 240 contractsfrom 1999 to 2006
Contracts for Electrical and Electronic Properties Measuring and Testing Instruments, Motors, Electrical, Guns, through 30 mm, Guided Missile Remote Control Systems, and moreby Army, Navy, Defense Logistics Agency, Air Force, and others Signed by year:2000: $1,180,611; 2001: $3,917,174; 2002: $1,354,542; 2003: $1,290,457; 2004: $3,239,412; 2005: $1,287,350; 2006: $702,883.
Biggest contracts:
$943,621 with Army for Electrical and Electronic Properties Measuring and Testing Instruments. Signed on 2004-05-11. Completion date: 2005-04-28.
$889,488 with Army for Motors, Electrical. Signed on 2001-12-31. Completion date: 2006-05-31.
$878,051 with Army for Guns, through 30 mm. Signed on 2002-06-10. Completion date: 2003-06-12.
$687,316 with Army for Guided Missile Remote Control Systems. Signed on 2001-09-26. Completion date: 2002-12-31.
WOODARD ELECTRIC INC (2707 HIGHWAY 36 W; small business) : $3,748,939 in 272 contractsfrom 1999 to 2006
Contracts for Guided Missile Remote Control Systems, Launchers, Guided Missile, Microcircuits, Electronic, Lugs, Terminals, and Terminal Strips, and moreby Army, Defense Logistics Agency, Air Force, Navy, and others Signed by year:2000: $703,197; 2001: $473,143; 2002: $649,946; 2003: $333,525; 2004: $671,953; 2005: $558,782; 2006: $429,311.
Biggest contracts:
$180,268 with Army for Guided Missile Remote Control Systems. Signed on 2004-05-07. Completion date: 2005-03-31.
$163,210, same as above.Signed on 2002-03-07. Completion date: 2006-03-31.
$128,850, same as above.Signed on 2001-03-26. Completion date: 2006-03-31.
$119,040 with Army for Launchers, Guided Missile. Signed on 2000-12-21. Completion date: 2000-07-23.
JIT INDUSTRIES INC (2201 HIGHWAY 31 SW; small business) : $1,681,732 in 9 contractsfrom 2004 to 2006
Contracts for Aircraft Hydraulic, Vacuum, and De-icing System Components, Screws, Vehicular Power Transmission Components, Maintenance, Repair and Rebuilding of Equipment -- Ground Effect Vehicles, Motor Vehicles, Trailers, and Cycles by Army, Navy Signed by year:2000: $0; 2001: $0; 2002: $0; 2003: $0; 2004: $23,841; 2005: $15,691; 2006: $1,642,200.
Biggest contracts:
$1,642,200 with Army for Aircraft Hydraulic, Vacuum, and De-icing System Components. Signed on 2006-01-05. Completion date: 2010-12-31.
$15,631 with Army for Screws. Signed on 2004-09-22. Completion date: 2005-09-30.
$12,426, same as above.Signed on 2005-09-30. Completion date: 2006-09-30.
$6,150 with Navy for Vehicular Power Transmission Components. Signed on 2004-08-12. Completion date: 2005-04-17.
RUWE ENTERPRISES, INC. (701-NANCEFORD ROAD STE. D&; small business) : $749,147 in 2 contractsin 2000
$723,733 with Army for Laboratory Equipment and Supplies. Signed on 2000-01-12. Completion date: 2000-07-14.
$25,414 with Army for Food Products Machinery and Equipment. Signed on 2000-09-27. Completion date: 2000-11-30.
PRO-FAB MACHINE OF HARTSELLE, (2405 HIGHWAY 31 NW; small business)
$72,189 with Defense Logistics Agency for Miscellaneous Weapons. Signed on 2002-02-19. Completion date: 2002-04-20.
POWER 2 TRANSFORM (1005 ASHWORTH ST NE; small business) 500 employees, $0 revenue. : $44,040 in 2 contractsfrom 2004 to 2006
$22,440 with Air Force for Other ADP and Telecommunications Services (includes data storage on tapes, compact disks, etc.). Signed on 2006-01-17. Completion date: 2006-01-17.
$21,600 with Air Force for Other Professional Services. Signed on 2004-11-05. Completion date: 2004-12-05.
$30,287 with Navy for Reels and Spools. Signed on 2003-07-17. Completion date: 2003-07-31.
Top industries in this zip code by the number of employees in 2005:
Administrative and Support and Waste Management and Remediation Services: Temporary Help Services (250-499 employees: 1 establishment, 20-49 employees: 1 establishment)
2006 - 2018 National Fire Incident Reporting System (NFIRS) incidents
According to the data from the years 2006 - 2018 the average number of fires per year is 74. The highest number of reported fire incidents - 135 took place in 2006, and the least - 34 in 2012. The data has a dropping trend.
When looking into fire subcategories, the most incidents belonged to: Outside Fires (42.6%), and Structure Fires (30.8%).
Fire incident types reported to NFIRS in Zip Code 35640


 Nearest zip codes: 35603, 35622, 35179, 35601, 35649, 35670.
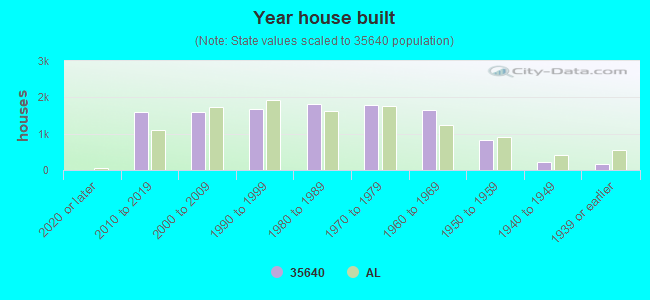


 According to the data from the years 2006 - 2018 the average number of fires per year is 74. The highest number of reported fire incidents - 135 took place in 2006, and the least - 34 in 2012. The data has a dropping trend.
 When looking into fire subcategories, the most incidents belonged to: Outside Fires (42.6%), and Structure Fires (30.8%).