Estimated zip code population in 2022: 8,468 Zip code population in 2010: 8,300 Zip code population in 2000: 7,782
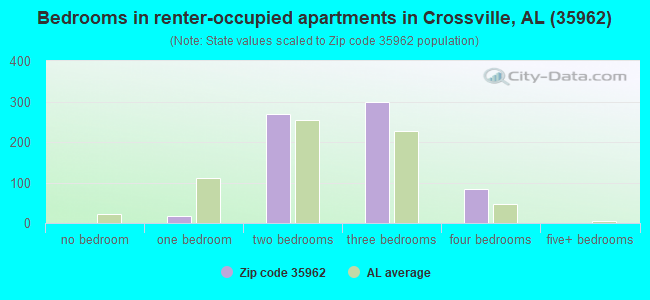
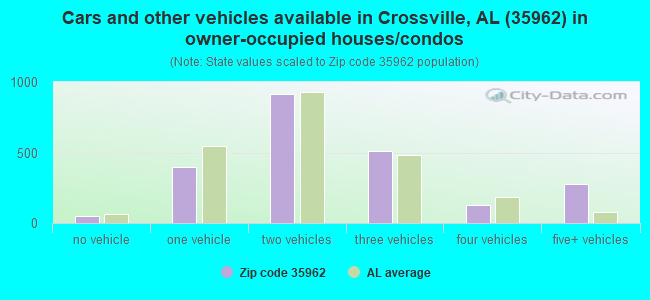
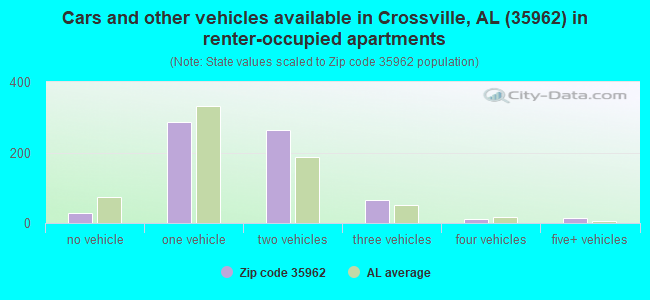
Houses and condos: 3,525 Renter-occupied apartments: 664
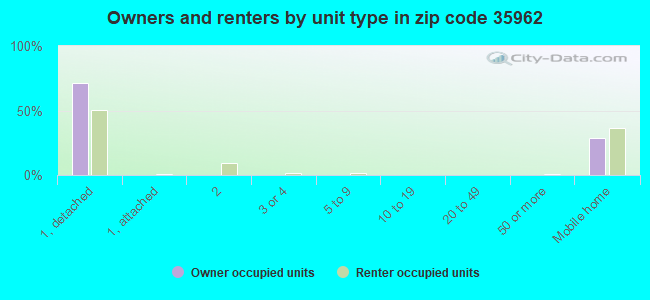
% of renters here:
22%
State:
30%
March 2022 cost of living index in zip code 35962: 81.5 (low, U.S. average is 100)
Land area: 78.7 sq. mi. Water area: 0.1 sq. mi.
Population density: 108 people per square mile
(very low).
OSM Map
General Map
Google Map
MSN Map
OSM Map
General Map
Google Map
MSN Map
OSM Map
General Map
Google Map
MSN Map
OSM Map
General Map
Google Map
MSN Map
Please wait while loading the map...
Real estate property taxes paid for housing units in 2022:
This zip code:
0.3% ($428)
Alabama:
0.4% ($718)
Median real estate property taxes paid for housing units with mortgages in 2022: $624 (0.3%) Median real estate property taxes paid for housing units with no mortgage in 2022: $322 (0.3%)
Business Search- 14 Million verified businesses
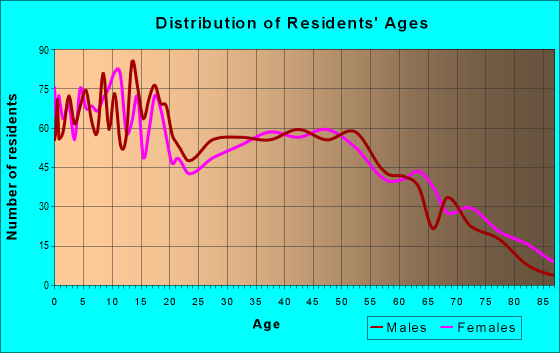
Males: 4,357
(51.5%)
Females: 4,109
(48.5%)
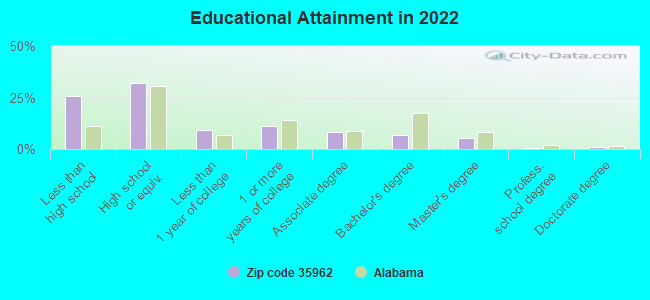
For population 25 years and over in 35962:
High school or higher: 72.1%
Bachelor's degree or higher: 13.1%
Graduate or professional degree: 6.6%
Unemployed: 1.3%
Mean travel time to work (commute): 30.9 minutes
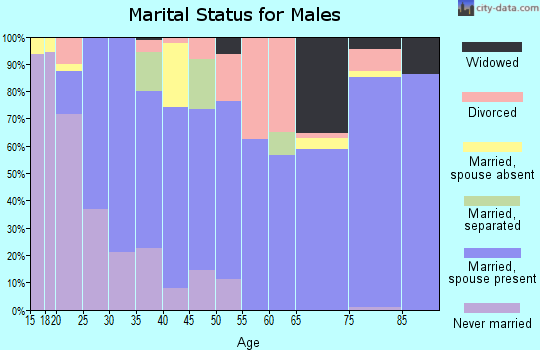
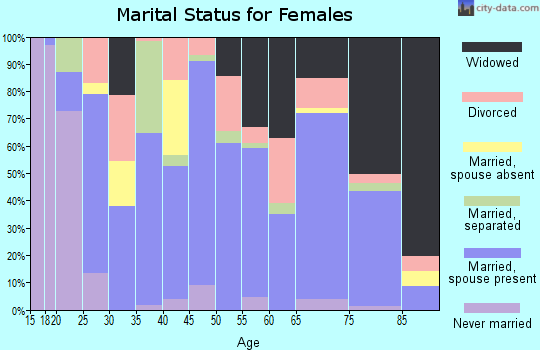
For population 15 years and over in 35962:
Never married: 31.8%
Now married: 50.0%
Separated: 1.2%
Widowed: 6.6%
Divorced: 10.5%
Zip code 35962 compared to state average:
Unemployed percentage significantly below state average.
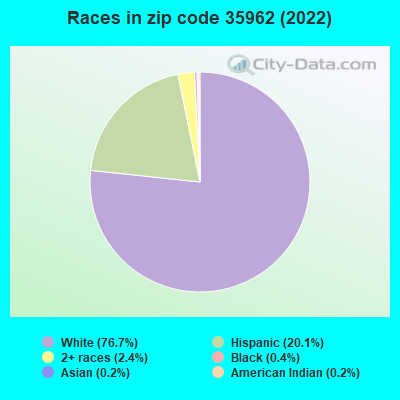
Black race population percentage significantly below state average.
Hispanic race population percentage significantly above state average.
Foreign-born population percentage significantly above state average.
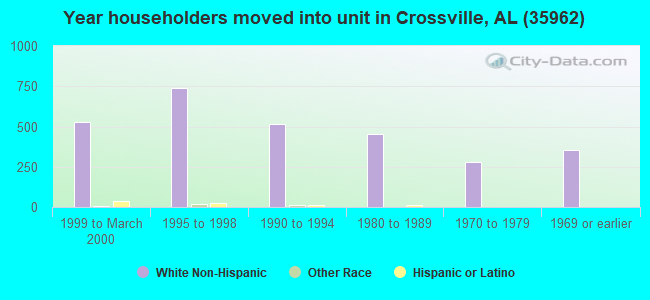
Length of stay since moving in significantly above state average.
Percentage of population with a bachelor's degree or higher below state average.
Averages for the 2020 tax year for zip code 35962, filed in 2021:
Average Adjusted Gross Income (AGI) in 2020: $42,646 (Individual Income Tax Returns)
Here:
$42,646
State:
$63,984
Salary/wage: $38,028 (reported on 83.9% of returns)
Here:
$38,028
State:
$52,834
(% of AGI for various income ranges: 1219.2% for AGIs below $25k, 3743.4% for AGIs $25k-50k, 6530.7% for AGIs $50k-75k, 9401.4% for AGIs $75k-100k, 13878.2% for AGIs $100k-200k)
Taxable interest for individuals: $1,156 (reported on 19.9% of returns)
This zip code:
$1,156
Alabama:
$1,615
(% of AGI for various income ranges: 7.4% for AGIs below $25k, 15.7% for AGIs $25k-50k, 46.0% for AGIs $50k-75k, 55.7% for AGIs $75k-100k, 239.1% for AGIs $100k-200k)
Ordinary dividends: $1,887 (reported on 5.2% of returns)
Here:
$1,887
State:
$7,660
(% of AGI for various income ranges: 1.3% for AGIs below $25k, 6.3% for AGIs $25k-50k, 10.7% for AGIs $50k-75k, 30.0% for AGIs $75k-100k, 139.1% for AGIs $100k-200k)
Net capital gain/loss in AGI: +$5,780 (reported on 5.2% of returns)
Here:
+$5,780
State:
+$23,528
(% of AGI for various income ranges: 7.2% for AGIs below $25k, 24.0% for AGIs $25k-50k, 21.7% for AGIs $50k-75k, 78.6% for AGIs $75k-100k, 414.5% for AGIs $100k-200k)
Profit/loss from business: +$6,866 (reported on 18.5% of returns)
Here:
+$6,866
State:
+$9,534
(% of AGI for various income ranges: 214.3% for AGIs below $25k, 106.7% for AGIs $25k-50k, 145.3% for AGIs $50k-75k, 2.1% for AGIs $75k-100k, 379.1% for AGIs $100k-200k)
Taxable individual retirement arrangement distribution: $10,900 (reported on 4.9% of returns)
35962:
$10,900
Alabama:
$19,004
(% of AGI for various income ranges: 25.2% for AGIs below $25k, 42.3% for AGIs $25k-50k, 97.3% for AGIs $50k-75k, 499.3% for AGIs $75k-100k)
Total itemized deductions: $34,200 (reported on 1.7% of returns)
Here:
$34,200
State:
$37,338
(% of AGI for various income ranges: 41.7% for AGIs below $25k, 1194.5% for AGIs $100k-200k)
Charity contributions: $21,200 (reported on 1.4% of returns)
Here:
$21,200
State:
$18,005
(% of AGI for various income ranges: 770.9% for AGIs $100k-200k)
Taxes paid: $5,540 (reported on 1.7% of returns)
35962:
$5,540
State:
$6,484
(% of AGI for various income ranges: 251.8% for AGIs $100k-200k)
Earned income credit: $2,817 (reported on 30.4% of returns)
Here:
$2,817
State:
$2,628
(% of AGI for various income ranges: 171.4% for AGIs below $25k, 117.6% for AGIs $25k-50k)
Percentage of individuals using paid preparers for their 2020 taxes: 95.8%
Here:
96%
State:
93%
(% for various income ranges: 94.4% for AGIs below $25k, 95.3% for AGIs $25k-50k, 97.4% for AGIs $50k-75k, 100.0% for AGIs $75k-100k, 100.0% for AGIs $100k-200k, 100.0% for AGIs over 200k)
Averages for the 2012 tax year for zip code 35962, filed in 2013:
Average Adjusted Gross Income (AGI) in 2012: $32,687 (Individual Income Tax Returns)
Here:
$32,687
State:
$52,001
Salary/wage: $30,714 (reported on 87.4% of returns)
Here:
$30,714
State:
$43,822
(% of AGI for various income ranges: 84.3% for AGIs below $25k, 88.7% for AGIs $25k-50k, 84.8% for AGIs $50k-75k, 88.0% for AGIs $75k-100k, 59.3% for AGIs $100k-200k)
Taxable interest for individuals: $809 (reported on 22.1% of returns)
This zip code:
$809
Alabama:
$1,592
(% of AGI for various income ranges: 0.9% for AGIs below $25k, 0.5% for AGIs $25k-50k, 0.5% for AGIs $50k-75k, 0.4% for AGIs $75k-100k, 0.4% for AGIs $100k-200k)
Ordinary dividends: $1,157 (reported on 5.3% of returns)
Here:
$1,157
State:
$5,697
(% of AGI for various income ranges: 0.3% for AGIs below $25k, 0.3% for AGIs $75k-100k, 0.3% for AGIs $100k-200k)
Net capital gain/loss in AGI: +$2,830 (reported on 3.8% of returns)
Here:
+$2,830
State:
+$13,286
(% of AGI for various income ranges: 0.7% for AGIs $50k-75k, 1.4% for AGIs $100k-200k)
Profit/loss from business: +$5,007 (reported on 17.6% of returns)
Here:
+$5,007
State:
+$9,151
(% of AGI for various income ranges: 8.9% for AGIs below $25k, 1.9% for AGIs $25k-50k, 0.7% for AGIs $50k-75k)
Taxable individual retirement arrangement distribution: $8,725 (reported on 4.6% of returns)
35962:
$8,725
Alabama:
$14,992
(% of AGI for various income ranges: 1.3% for AGIs below $25k, 0.8% for AGIs $25k-50k, 3.7% for AGIs $50k-75k)
Total itemized deductions: $16,934 (26% of AGI, reported on 14.5% of returns)
Here:
$16,934
State:
$21,388
Here:
26.3% of AGI
State:
20.1% of AGI
(% of AGI for various income ranges: 5.0% for AGIs below $25k, 6.9% for AGIs $25k-50k, 8.1% for AGIs $50k-75k, 10.5% for AGIs $75k-100k, 9.3% for AGIs $100k-200k)
Charity contributions: $4,070 (reported on 12.6% of returns)
Here:
$4,070
State:
$5,925
(% of AGI for various income ranges: 0.7% for AGIs below $25k, 1.3% for AGIs $25k-50k, 1.5% for AGIs $50k-75k, 2.2% for AGIs $75k-100k, 2.8% for AGIs $100k-200k)
Taxes paid: $2,982 (reported on 14.9% of returns)
35962:
$2,982
State:
$5,272
(% of AGI for various income ranges: 0.5% for AGIs below $25k, 1.0% for AGIs $25k-50k, 1.3% for AGIs $50k-75k, 2.2% for AGIs $75k-100k, 2.8% for AGIs $100k-200k)
Earned income credit: $2,820 (reported on 34.0% of returns)
Here:
$2,820
State:
$2,646
(% of AGI for various income ranges: 10.1% for AGIs below $25k, 2.0% for AGIs $25k-50k)
Percentage of individuals using paid preparers for their 2012 taxes: 82.4%
Here:
82%
State:
60%
(% for various income ranges: 80.9% for AGIs below $25k, 85.1% for AGIs $25k-50k, 80.8% for AGIs $50k-75k, 91.7% for AGIs $75k-100k, 77.8% for AGIs $100k-200k)
Averages for the 2004 tax year for zip code 35962, filed in 2005:
Average Adjusted Gross Income (AGI) in 2004: $28,304 (Individual Income Tax Returns)
Here:
$28,304
State:
$42,302
Salary/wage: $28,200 (reported on 87.0% of returns)
Here:
$28,200
State:
$36,626
(% of AGI for various income ranges: 127.5% for AGIs below $10k, 87.3% for AGIs $10k-25k, 88.7% for AGIs $25k-50k, 88.7% for AGIs $50k-75k, 88.8% for AGIs $75k-100k, 59.0% for AGIs over 100k)
Taxable interest for individuals: $1,072 (reported on 31.4% of returns)
This zip code:
$1,072
Alabama:
$1,827
(% of AGI for various income ranges: 7.4% for AGIs below $10k, 1.0% for AGIs $10k-25k, 0.9% for AGIs $25k-50k, 1.3% for AGIs $50k-75k, 0.9% for AGIs $75k-100k, 0.7% for AGIs over 100k)
Taxable dividends: $695 (reported on 9.8% of returns)
Here:
$695
State:
$4,206
(% of AGI for various income ranges: 1.5% for AGIs below $10k, 0.4% for AGIs $10k-25k, 0.2% for AGIs $25k-50k, 0.1% for AGIs $50k-75k, 0.2% for AGIs $75k-100k, 0.1% for AGIs over 100k)
Net capital gain/loss: +$5,724 (reported on 7.8% of returns)
Here:
+$5,724
State:
+$13,031
(% of AGI for various income ranges: -1.7% for AGIs below $10k, 0.2% for AGIs $10k-25k, 0.6% for AGIs $25k-50k, 1.1% for AGIs $50k-75k, 1.6% for AGIs $75k-100k, 10.1% for AGIs over 100k)
Profit/loss from business: +$4,735 (reported on 16.8% of returns)
Here:
+$4,735
State:
+$8,302
(% of AGI for various income ranges: 17.1% for AGIs below $10k, 4.2% for AGIs $10k-25k, 3.0% for AGIs $25k-50k, 2.1% for AGIs $50k-75k, 0.1% for AGIs $75k-100k)
IRA payment deduction: $2,820 (reported on 2.1% of returns)
35962:
$2,820
Alabama:
$3,006
Total itemized deductions: $14,354 (26% of AGI, reported on 18.7% of returns)
Here:
$14,354
State:
$17,623
Here:
26.0% of AGI
State:
20.8% of AGI
(% of AGI for various income ranges: 10.2% for AGIs below $10k, 5.1% for AGIs $10k-25k, 8.2% for AGIs $25k-50k, 11.3% for AGIs $50k-75k, 13.2% for AGIs $75k-100k, 14.6% for AGIs over 100k)
Charity contributions deductions: $3,354 (6% of AGI, reported on 16.0% of returns)
Here:
$3,354
State:
$4,768
Here:
5.8% of AGI
State:
5.4% of AGI
(% of AGI for various income ranges: 0.7% for AGIs $10k-25k, 1.4% for AGIs $25k-50k, 2.5% for AGIs $50k-75k, 3.2% for AGIs $75k-100k, 3.8% for AGIs over 100k)
Total tax: $2,965 (reported on 65.4% of returns)
35962:
$2,965
State:
$6,905
(% of AGI for various income ranges: 5.2% for AGIs below $10k, 3.2% for AGIs $10k-25k, 5.7% for AGIs $25k-50k, 7.9% for AGIs $50k-75k, 9.1% for AGIs $75k-100k, 14.2% for AGIs over 100k)
Earned income credit: $2,039 (reported on 29.1% of returns)
Here:
$2,039
State:
$2,048
Percentage of individuals using paid preparers for their 2004 taxes: 84.6%
Here:
85%
State:
65%
(% for various income ranges: 79.4% for AGIs below $10k, 86.0% for AGIs $10k-25k, 86.5% for AGIs $25k-50k, 84.3% for AGIs $50k-75k, 89.7% for AGIs $75k-100k, 88.1% for AGIs over 100k)
Household received Food Stamps/SNAP in the past 12 months: 390 Household did not receive Food Stamps/SNAP in the past 12 months: 2,563
Women who had a birth in the past 12 months: 37 (30 now married, 8 unmarried) Women who did not have a birth in the past 12 months: 1,932 (793 now married, 1,139 unmarried)
Housing units in zip code 35962 with a mortgage: 931 (24 second mortgage, 1 home equity loan, 2 both second mortgage and home equity loan) Median monthly owner costs for units with a mortgage: $1,274 Median monthly owner costs for units without a mortgage: $347
Residents with income below the poverty level in 2022:
This zip code:
25.6%
Whole state:
16.2%
Residents with income below 50% of the poverty level in 2022:
This zip code:
20.4%
Whole state:
8.6%
Median number of rooms in houses and condos:
Here:
6.2
State:
6.5
Median number of rooms in apartments:
Here:
5.4
State:
4.7
Notable locations in this zip code not listed on our city pages
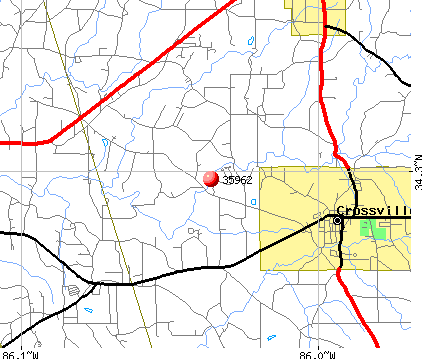
Notable locations in zip code 35962: B and B Farms (A), Sand Mountain Agricultural Experment Station (B), Crossville Fire Department (C), Kilpatrick Volunteer Fire Department (D), Aroney Fire Department Station 2 (E). Display/hide their locations on the map
Churches in zip code 35962 include: Piney Grove Church (A), Skirum Church (B), Belchers Gap Church (C), Oak Hill Church (D), New Hope Church (E), New Home Church (F), New Canaan Church (G), Mount Pleasant Church (H), Mount Flat Church (I). Display/hide their locations on the map
Cemeteries: Forester Cemetery (1), Dalrymple Cemetery (2), Clark Cemetery (3), Concord Cemetery (4), New Canaan Cemetery (5), Union Grove Cemetery (6), Liberty Cemetery (7). Display/hide their locations on the map
Streams, rivers, and creeks: Allen Branch (A), Baker Branch (B), Big Branch (C), Bray Creek (D), Broomstraw Branch (E), Carter Branch (F), Chastain Creek (G), Fall Branch (H), Little Scarham Creek (I). Display/hide their locations on the map
In group quarters: 170 (-1 institutionalized population)
Size of family households: 1,019 2-persons, 272 3-persons, 412 4-persons, 361 5-persons, 93 6-persons, 19 7-or-more-persons
Size of nonfamily households: 638 1-person, 66 2-persons, 42 3-persons
1,291 married couples with children.
515 single-parent households (138 men, 377 women).
81.9% of residents of 35962 zip code speak English at home.
17.9% of residents speak Spanish at home (63% very well, 11% well, 19% not well, 7% not at all).
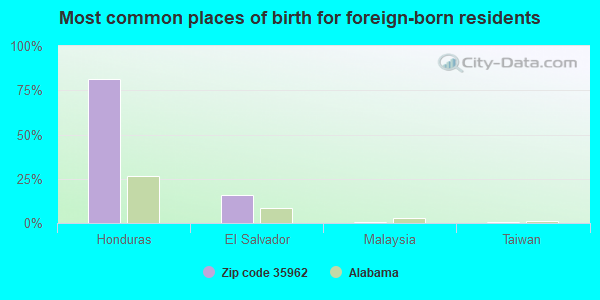
Foreign born population: 955 (11.3%) (27.0% of them are naturalized citizens)
This zip code:
11.3%
Whole state:
3.8%
81%Honduras
16%El Salvador
1%Malaysia
0%Taiwan
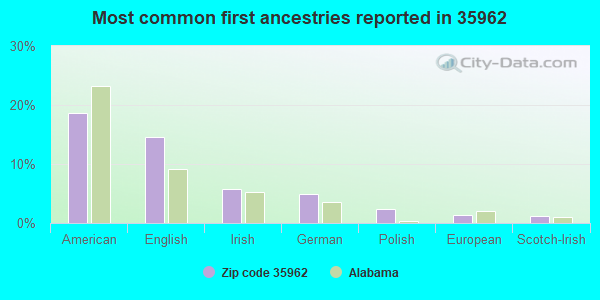
19%American
15%English
6%Irish
5%German
2%Polish
1%European
1%Scotch-Irish
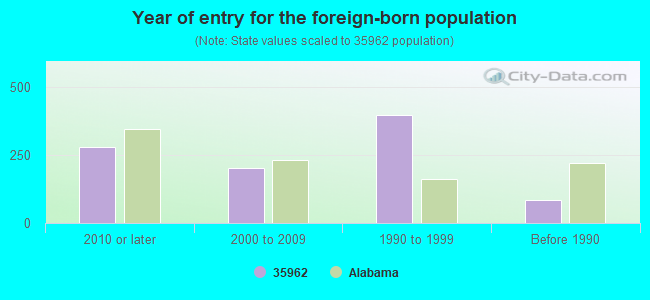
Year of entry for the foreign-born population
2792010 or later
2022000 to 2009
3971990 to 1999
83Before 1990
Facilities with environmental interests located in this zip code:
CIRCLE H FARMS (DAVID HANNAH in CROSSVILLE, AL)
National Pollutant Discharge Elimination System NON-MAJOR (Tracking pollutant discharge elimination systems) - permit Business SIC classification: NONCLASSIFIABLE ESTABLISHMENTS Alternative names: CIRCLE H FARMS POULTRY FAC
BRITTON OIL STATION NO 2 (BRITTON OIL COMPANY in CROSSVILLE, AL)
National Pollutant Discharge Elimination System NON-MAJOR (Tracking pollutant discharge elimination systems) - permit Business SIC classification: GASOLINE SERVICE STATIONS Alternative names: BRITON OIL CO STATION NO 2
RENN'S BODY SHOP INC (HWY 68 EAST in CROSSVILLE, AL)
(Resource Conservation and Recovery Act (tracking hazardous waste)) Organizations: RENN BODY SHOP INC (CONTACT/OWNER)
AL HWY 227 SOUTH (DEKALB CHEROKEE CO GAS DIST IN in CROSSVILLE, AL)
National Pollutant Discharge Elimination System NON-MAJOR (Tracking pollutant discharge elimination systems) - permit Business SIC classification: WATER, SEWER, PIPELINE, AND COMMUNICATIONS AND POWER LINE CONSTRUCTION Alternative names: AL HWY227 SOUTH, DEKALB CHEROKEE GAS DIST INC
Housing units lacking complete plumbing facilities: 5.3% Housing units lacking complete kitchen facilities: 6.1%
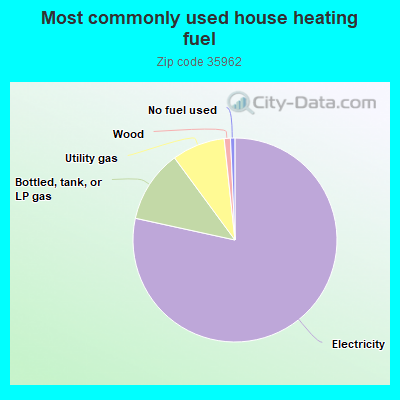
78.5%Electricity
11.5%Bottled, tank, or LP gas
8.4%Utility gas
1.0%Wood
0.7%No fuel used
Population in 1990: 4,874. Population change in the 1990s: +2,908 (+59.7%).
Place of birth for U.S.-born residents:
This state: 5,539
Northeast: 62
Midwest: 340
South: 1,461
West: 137
62% of the 35962 zip code residents lived in the same house 5 years ago. Out of people who lived in different houses, 45% lived in this county. Out of people who lived in different counties, 50% lived in Alabama.
97% of the 35962 zip code residents lived in the same house 1 year ago. Out of people who lived in different houses, 31% moved from this county. Out of people who lived in different houses, 71% moved from different county within same state. Out of people who lived in different houses, 6% moved from different state.
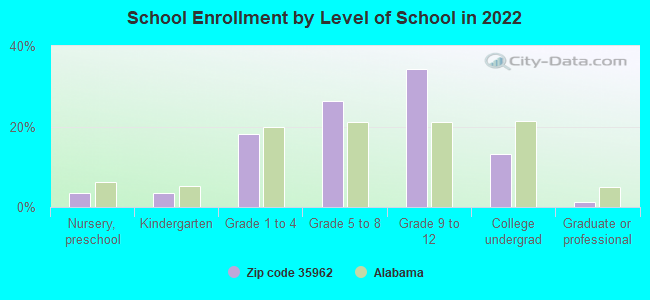
Private vs. public school enrollment:
Students in private schools in grades 1 to 8 (elementary and middle school): 103
Here:
11.2%
Alabama:
14.7%
Students in private schools in grades 9 to 12 (high school): 192
Here:
26.1%
Alabama:
16.3%
Students in private undergraduate colleges:
Here:
0.0%
Alabama:
14.6%
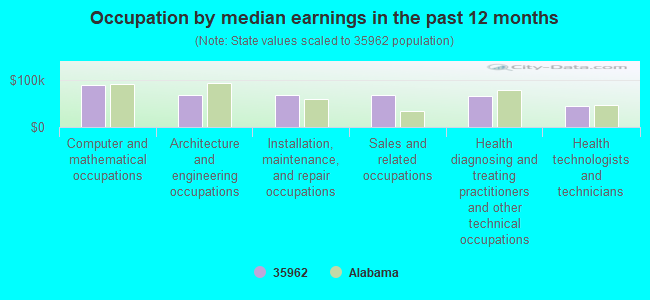
Occupation by median earnings in the past 12 months ($)
90,803Computer and mathematical occupations
69,516Architecture and engineering occupations
68,246Installation, maintenance, and repair occupations
67,893Sales and related occupations
65,705Health diagnosing and treating practitioners and other technical occupations
45,758Health technologists and technicians
Top industries in this zip code by the number of employees in 2005:
Health Care and Social Assistance: Nursing Care Facilities (100-249 employees: 1 establishment, 1-4 employees: 1 establishment)
Finance and Insurance: Commercial Banking (20-49: 1, 5-9: 1)
Health Care and Social Assistance: Offices of Physicians (except Mental Health Specialists) (20-49: 1)
Other Services (except Public Administration): Religious Organizations (5-9: 2, 1-4: 2)
People in group quarters in 2010:
125 people in nursing facilities/skilled-nursing facilities
People in group quarters in 2000:
126 people in nursing homes
Fatal accident statistics in 2012:
Fatal accident count: 4
Vehicles involved in fatal accidents: 6
Fatal accidents caused by drunken drivers: 3
Fatalities: 4
Persons involved in fatal accidents: 9
Pedestrians involved in fatal accidents: 0
Fatal accident statistics in 2011:
Fatal accident count: 1
Vehicles involved in fatal accidents: 1
Fatal accidents caused by drunken drivers: 1
Fatalities: 1
Persons involved in fatal accidents: 1
Pedestrians involved in fatal accidents: 0
2005 - 2018 National Fire Incident Reporting System (NFIRS) incidents
Based on the data from the years 2005 - 2018 the average number of fires per year is 14. The highest number of reported fires - 39 took place in 2010, and the least - 0 in 2006. The data has a growing trend.
When looking into fire subcategories, the most reports belonged to: Outside Fires (45.9%), and Structure Fires (39.8%).
Fire incident types reported to NFIRS in Zip Code 35962
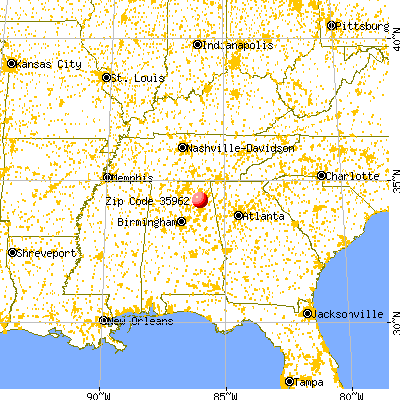


 Nearest zip codes: 35974, 35963, 35951, 35975, 35971, 35961.


 Based on the data from the years 2005 - 2018 the average number of fires per year is 14. The highest number of reported fires - 39 took place in 2010, and the least - 0 in 2006. The data has a growing trend.
 When looking into fire subcategories, the most reports belonged to: Outside Fires (45.9%), and Structure Fires (39.8%).