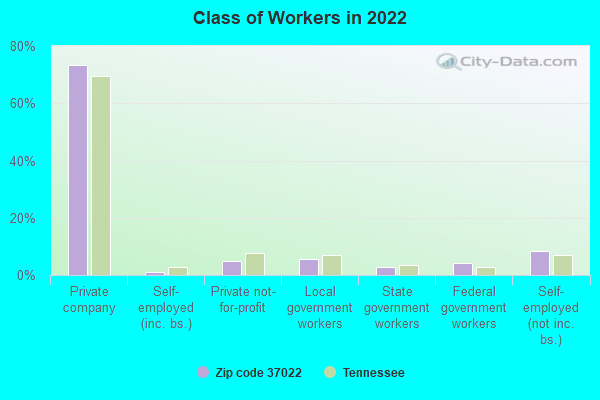
Estimated zip code population in 2022: 6,276 Zip code population in 2010: 5,469 Zip code population in 2000: 4,529
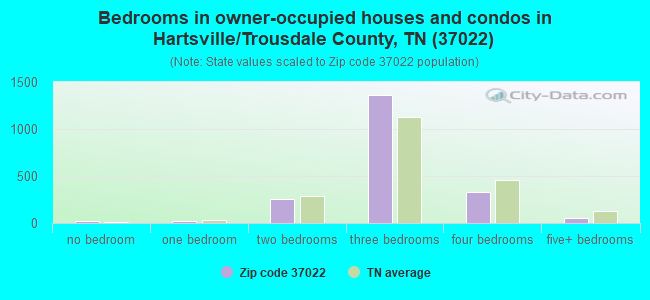
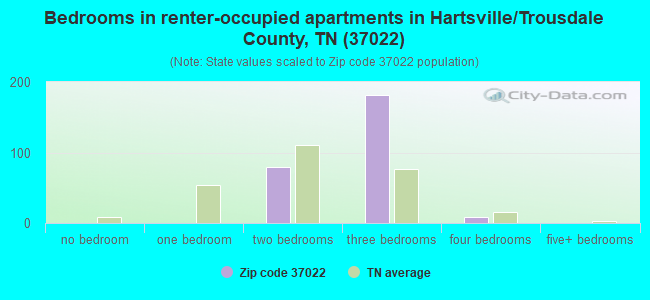
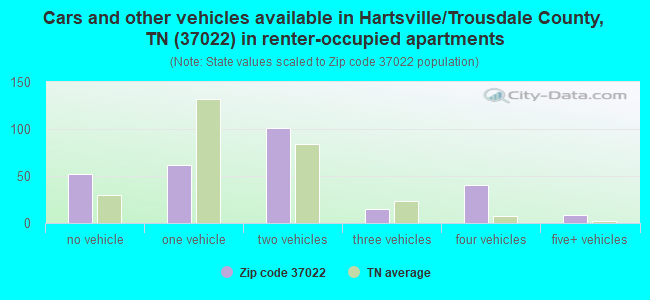
Houses and condos: 2,400 Renter-occupied apartments: 276
% of renters here:
12%
State:
33%
March 2022 cost of living index in zip code 37022: 81.5 (low, U.S. average is 100)
Land area: 85.4 sq. mi. Water area: 0.0 sq. mi.
Population density: 74 people per square mile
(very low).
OSM Map
General Map
Google Map
MSN Map
OSM Map
General Map
Google Map
MSN Map
OSM Map
General Map
Google Map
MSN Map
OSM Map
General Map
Google Map
MSN Map
Please wait while loading the map...
Real estate property taxes paid for housing units in 2022:
This zip code:
0.4% ($978)
Tennessee:
0.5% ($1,376)
Median real estate property taxes paid for housing units with mortgages in 2022: $939 (0.4%) Median real estate property taxes paid for housing units with no mortgage in 2022: $1,072 (0.4%)
Business Search- 14 Million verified businesses
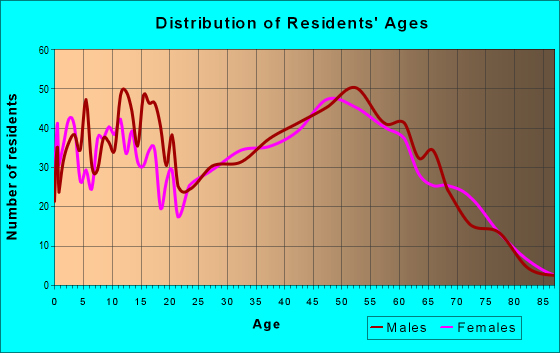
Males: 3,163
(50.4%)
Females: 3,113
(49.6%)
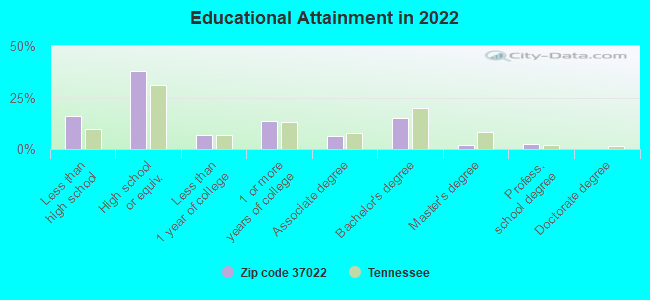
For population 25 years and over in 37022:
High school or higher: 82.4%
Bachelor's degree or higher: 19.3%
Graduate or professional degree: 4.5%
Unemployed: 4.1%
Mean travel time to work (commute): 32.4 minutes
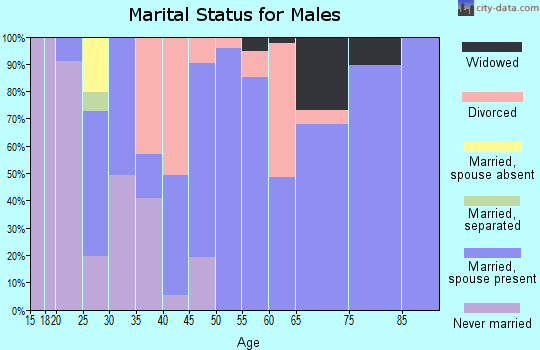
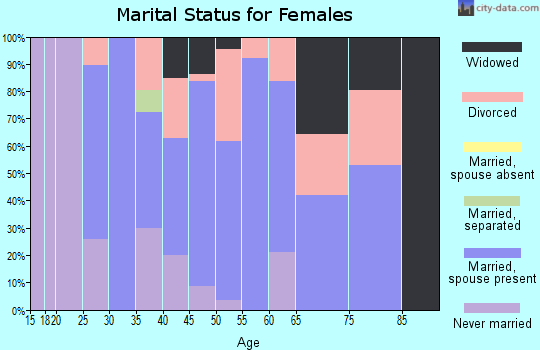
For population 15 years and over in 37022:
Never married: 19.9%
Now married: 56.9%
Separated: 1.8%
Widowed: 7.3%
Divorced: 14.1%
Zip code 37022 compared to state average:
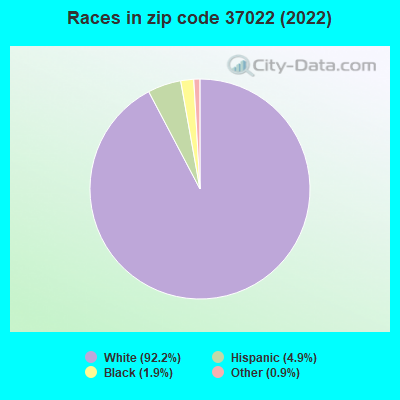
Black race population percentage significantly below state average.
Foreign-born population percentage below state average.
Renting percentage significantly below state average.
Length of stay since moving in significantly above state average.
Percentage of population with a bachelor's degree or higher below state average.
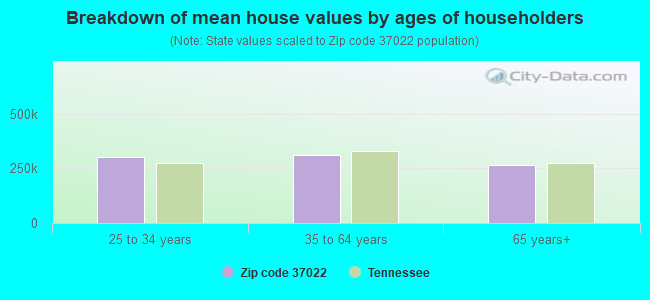
Estimated median house/condo value in 2022: $262,099
37022:
$262,099
Tennessee:
$284,800
According to our research of Tennessee and other state lists, there were 18 registered sex offenders living in 37022 zip code as of April 27, 2024. The ratio of all residents to sex offenders in zip code 37022 is 360 to 1. The ratio of registered sex offenders to all residents in this zip code is near the state average.
Median resident age:
This zip code:
42.2 years
Tennessee median age:
39.2 years
Average household size:
This zip code:
2.7 people
Tennessee:
2.4 people
Averages for the 2020 tax year for zip code 37022, filed in 2021:
Average Adjusted Gross Income (AGI) in 2020: $57,879 (Individual Income Tax Returns)
Here:
$57,879
State:
$69,014
Salary/wage: $50,045 (reported on 81.9% of returns)
Here:
$50,045
State:
$55,872
(% of AGI for various income ranges: 1116.4% for AGIs below $25k, 3531.1% for AGIs $25k-50k, 6661.2% for AGIs $50k-75k, 9353.0% for AGIs $75k-100k, 15629.0% for AGIs $100k-200k, 64900.0% for AGIs over 200k)
Taxable interest for individuals: $865 (reported on 24.0% of returns)
This zip code:
$865
Tennessee:
$1,945
(% of AGI for various income ranges: 18.4% for AGIs below $25k, 17.3% for AGIs $25k-50k, 25.0% for AGIs $50k-75k, 34.8% for AGIs $75k-100k, 33.0% for AGIs $100k-200k, 650.0% for AGIs over 200k)
Ordinary dividends: $2,526 (reported on 9.4% of returns)
Here:
$2,526
State:
$8,105
(% of AGI for various income ranges: 12.6% for AGIs below $25k, 13.2% for AGIs $25k-50k, 13.2% for AGIs $50k-75k, 24.3% for AGIs $75k-100k, 94.5% for AGIs $100k-200k, 1110.0% for AGIs over 200k)
Net capital gain/loss in AGI: +$20,614 (reported on 10.1% of returns)
Here:
+$20,614
State:
+$33,664
(% of AGI for various income ranges: 10.7% for AGIs below $25k, 19.2% for AGIs $25k-50k, 97.9% for AGIs $50k-75k, 185.2% for AGIs $75k-100k, 972.0% for AGIs $100k-200k, 15405.0% for AGIs over 200k)
Profit/loss from business: +$15,836 (reported on 19.1% of returns)
Here:
+$15,836
State:
+$18,991
(% of AGI for various income ranges: 181.1% for AGIs below $25k, 259.7% for AGIs $25k-50k, 345.0% for AGIs $50k-75k, 873.0% for AGIs $75k-100k, 795.0% for AGIs $100k-200k, 5305.0% for AGIs over 200k)
Taxable individual retirement arrangement distribution: $17,722 (reported on 6.2% of returns)
37022:
$17,722
Tennessee:
$20,036
(% of AGI for various income ranges: 39.4% for AGIs below $25k, 75.6% for AGIs $25k-50k, 84.1% for AGIs $50k-75k, 292.2% for AGIs $75k-100k, 743.5% for AGIs $100k-200k)
Total itemized deductions: $32,540 (reported on 3.5% of returns)
Here:
$32,540
State:
$40,136
(% of AGI for various income ranges: 135.3% for AGIs $25k-50k, 220.0% for AGIs $75k-100k, 495.5% for AGIs $100k-200k, 4590.0% for AGIs over 200k)
Charity contributions: $12,612 (reported on 2.8% of returns)
Here:
$12,612
State:
$19,852
(% of AGI for various income ranges: 76.8% for AGIs $50k-75k, 154.0% for AGIs $100k-200k, 2200.0% for AGIs over 200k)
Taxes paid: $4,580 (reported on 3.5% of returns)
37022:
$4,580
State:
$6,038
(% of AGI for various income ranges: 9.7% for AGIs $25k-50k, 30.4% for AGIs $75k-100k, 91.0% for AGIs $100k-200k, 730.0% for AGIs over 200k)
Earned income credit: $2,496 (reported on 18.1% of returns)
Here:
$2,496
State:
$2,391
(% of AGI for various income ranges: 121.1% for AGIs below $25k, 72.6% for AGIs $25k-50k)
Percentage of individuals using paid preparers for their 2020 taxes: 94.1%
Here:
94%
State:
93%
(% for various income ranges: 93.6% for AGIs below $25k, 94.8% for AGIs $25k-50k, 95.6% for AGIs $50k-75k, 93.8% for AGIs $75k-100k, 93.8% for AGIs $100k-200k, 87.5% for AGIs over 200k)
Averages for the 2012 tax year for zip code 37022, filed in 2013:
Average Adjusted Gross Income (AGI) in 2012: $39,732 (Individual Income Tax Returns)
Here:
$39,732
State:
$53,767
Salary/wage: $38,452 (reported on 84.8% of returns)
Here:
$38,452
State:
$45,421
(% of AGI for various income ranges: 72.7% for AGIs below $25k, 84.6% for AGIs $25k-50k, 89.2% for AGIs $50k-75k, 84.3% for AGIs $75k-100k, 76.4% for AGIs $100k-200k)
Taxable interest for individuals: $928 (reported on 26.5% of returns)
This zip code:
$928
Tennessee:
$1,732
(% of AGI for various income ranges: 1.4% for AGIs below $25k, 0.6% for AGIs $25k-50k, 0.3% for AGIs $50k-75k, 0.4% for AGIs $75k-100k, 0.6% for AGIs $100k-200k)
Ordinary dividends: $1,283 (reported on 7.8% of returns)
Here:
$1,283
State:
$6,739
(% of AGI for various income ranges: 0.4% for AGIs below $25k, 0.2% for AGIs $25k-50k, 0.2% for AGIs $50k-75k, 0.4% for AGIs $75k-100k, 0.1% for AGIs $100k-200k)
Net capital gain/loss in AGI: +$2,043 (reported on 9.1% of returns)
Here:
+$2,043
State:
+$19,082
(% of AGI for various income ranges: 0.7% for AGIs below $25k, 0.6% for AGIs $25k-50k, 0.7% for AGIs $75k-100k, 0.4% for AGIs $100k-200k)
Profit/loss from business: +$11,451 (reported on 18.7% of returns)
Here:
+$11,451
State:
+$15,240
(% of AGI for various income ranges: 13.2% for AGIs below $25k, 3.3% for AGIs $25k-50k, 2.0% for AGIs $50k-75k, 2.7% for AGIs $75k-100k, 8.2% for AGIs $100k-200k)
Taxable individual retirement arrangement distribution: $12,246 (reported on 5.7% of returns)
37022:
$12,246
Tennessee:
$15,505
(% of AGI for various income ranges: 1.7% for AGIs below $25k, 2.4% for AGIs $25k-50k, 1.6% for AGIs $50k-75k, 3.6% for AGIs $75k-100k)
Total itemized deductions: $17,912 (24% of AGI, reported on 14.8% of returns)
Here:
$17,912
State:
$21,976
Here:
23.6% of AGI
State:
17.8% of AGI
(% of AGI for various income ranges: 3.9% for AGIs below $25k, 5.5% for AGIs $25k-50k, 6.5% for AGIs $50k-75k, 9.4% for AGIs $75k-100k, 7.9% for AGIs $100k-200k)
Charity contributions: $4,450 (reported on 9.6% of returns)
Here:
$4,450
State:
$6,709
(% of AGI for various income ranges: 1.1% for AGIs $25k-50k, 0.8% for AGIs $50k-75k, 1.8% for AGIs $75k-100k, 1.4% for AGIs $100k-200k)
Taxes paid: $2,774 (reported on 14.8% of returns)
37022:
$2,774
State:
$4,829
(% of AGI for various income ranges: 0.5% for AGIs below $25k, 0.7% for AGIs $25k-50k, 1.0% for AGIs $50k-75k, 1.5% for AGIs $75k-100k, 1.4% for AGIs $100k-200k)
Earned income credit: $2,337 (reported on 26.1% of returns)
Here:
$2,337
State:
$2,404
(% of AGI for various income ranges: 8.6% for AGIs below $25k, 1.4% for AGIs $25k-50k)
Percentage of individuals using paid preparers for their 2012 taxes: 58.7%
Here:
59%
State:
52%
(% for various income ranges: 57.4% for AGIs below $25k, 56.9% for AGIs $25k-50k, 58.8% for AGIs $50k-75k, 62.5% for AGIs $75k-100k, 71.4% for AGIs $100k-200k)
Averages for the 2004 tax year for zip code 37022, filed in 2005:
Average Adjusted Gross Income (AGI) in 2004: $33,760 (Individual Income Tax Returns)
Here:
$33,760
State:
$44,088
Salary/wage: $33,102 (reported on 85.7% of returns)
Here:
$33,102
State:
$38,825
(% of AGI for various income ranges: 73.5% for AGIs below $10k, 77.2% for AGIs $10k-25k, 88.6% for AGIs $25k-50k, 90.0% for AGIs $50k-75k, 90.0% for AGIs $75k-100k, 62.6% for AGIs over 100k)
Taxable interest for individuals: $1,157 (reported on 31.1% of returns)
This zip code:
$1,157
Tennessee:
$1,802
(% of AGI for various income ranges: 6.1% for AGIs below $10k, 2.2% for AGIs $10k-25k, 0.9% for AGIs $25k-50k, 0.5% for AGIs $50k-75k, 0.5% for AGIs $75k-100k, 0.8% for AGIs over 100k)
Taxable dividends: $633 (reported on 9.5% of returns)
Here:
$633
State:
$3,727
(% of AGI for various income ranges: 1.3% for AGIs below $10k, 0.2% for AGIs $10k-25k, 0.2% for AGIs $25k-50k, 0.1% for AGIs $50k-75k, 0.1% for AGIs $75k-100k, 0.2% for AGIs over 100k)
Net capital gain/loss: +$9,492 (reported on 8.1% of returns)
Here:
+$9,492
State:
+$15,776
(% of AGI for various income ranges: -1.5% for AGIs below $10k, 1.2% for AGIs $10k-25k, 0.3% for AGIs $25k-50k, 0.6% for AGIs $50k-75k, 1.2% for AGIs $75k-100k, 14.7% for AGIs over 100k)
Profit/loss from business: +$10,494 (reported on 19.1% of returns)
Here:
+$10,494
State:
+$12,882
(% of AGI for various income ranges: 20.5% for AGIs below $10k, 8.8% for AGIs $10k-25k, 5.0% for AGIs $25k-50k, 1.8% for AGIs $50k-75k, 2.4% for AGIs $75k-100k, 14.7% for AGIs over 100k)
IRA payment deduction: $2,680 (reported on 1.1% of returns)
37022:
$2,680
Tennessee:
$2,934
Total itemized deductions: $14,090 (24% of AGI, reported on 17.8% of returns)
Here:
$14,090
State:
$18,035
Here:
23.7% of AGI
State:
19.9% of AGI
(% of AGI for various income ranges: 6.2% for AGIs $10k-25k, 6.8% for AGIs $25k-50k, 8.2% for AGIs $50k-75k, 9.6% for AGIs $75k-100k, 8.4% for AGIs over 100k)
Charity contributions deductions: $2,834 (4% of AGI, reported on 13.3% of returns)
Here:
$2,834
State:
$5,167
Here:
4.4% of AGI
State:
5.3% of AGI
(% of AGI for various income ranges: 0.6% for AGIs $10k-25k, 0.9% for AGIs $25k-50k, 1.2% for AGIs $50k-75k, 1.5% for AGIs $75k-100k, 2.1% for AGIs over 100k)
Total tax: $3,868 (reported on 74.9% of returns)
37022:
$3,868
State:
$7,482
(% of AGI for various income ranges: 4.3% for AGIs below $10k, 4.6% for AGIs $10k-25k, 6.5% for AGIs $25k-50k, 8.6% for AGIs $50k-75k, 10.6% for AGIs $75k-100k, 17.7% for AGIs over 100k)
Earned income credit: $1,629 (reported on 22.3% of returns)
Here:
$1,629
State:
$1,826
Percentage of individuals using paid preparers for their 2004 taxes: 65.0%
Here:
65%
State:
60%
(% for various income ranges: 59.9% for AGIs below $10k, 66.3% for AGIs $10k-25k, 67.9% for AGIs $25k-50k, 64.6% for AGIs $50k-75k, 58.9% for AGIs $75k-100k, 74.5% for AGIs over 100k)
Household received Food Stamps/SNAP in the past 12 months: 312 Household did not receive Food Stamps/SNAP in the past 12 months: 1,998
Women who had a birth in the past 12 months: 86 (54 now married, 31 unmarried) Women who did not have a birth in the past 12 months: 1,017 (655 now married, 362 unmarried)
Housing units in zip code 37022 with a mortgage: 1,205 (67 second mortgage, 56 both second mortgage and home equity loan) Houses without a mortgage: 15
Median monthly owner costs for units with a mortgage: $1,351 Median monthly owner costs for units without a mortgage: $445
Residents with income below the poverty level in 2022:
This zip code:
16.3%
Whole state:
13.3%
Residents with income below 50% of the poverty level in 2022:
This zip code:
8.0%
Whole state:
7.1%
Median number of rooms in houses and condos:
Here:
6.4
State:
6.5
Median number of rooms in apartments:
Here:
5.3
State:
4.4
Notable locations in this zip code not listed on our city pages
Notable locations in zip code 37022: Oak Grove Community Fire Department (A), Southeast Community Fire Department (B). Display/hide their locations on the map
Churches in zip code 37022 include: Liberty Presbyterian Church (A), Rock Bridge Church of Christ (B), Sulphur Fork Church (C), Leaths Chapel (D), Mount Vernon Church (E), Rock Bridge Baptist Church (F), Bethpage United Methodist Church (G), Old Hopewell Church (H), Bledsoe Church (I). Display/hide their locations on the map
Cemeteries: Sulphur Fork Cemetery (1), Mount Vernon Cemetery (2), Rock Bridge Cemetery (3), Dry Fork Cemetery (4), Old Hopewell Cemetery (5), Durham Chapel Cemetery (6), Bethpape Cemetery (7). Display/hide their locations on the map
Streams, rivers, and creeks: East Fork Bledsoe Creek (A), Brushy Fork Creek (B), Brush Fork (C), Rogues Fork Creek (D), Otter Fork (E), West Prong Caney Fork Creek (F), Mutton Branch (G), Pryor Branch (H). Display/hide their locations on the map
Size of family households: 930 2-persons, 327 3-persons, 274 4-persons, 117 5-persons, 126 6-persons, 40 7-or-more-persons
Size of nonfamily households: 447 1-person, 43 2-persons
961 married couples with children.
320 single-parent households (26 men, 294 women).
95.0% of residents of 37022 zip code speak English at home.
3.7% of residents speak Spanish at home (66% very well, 18% well, 16% not well).
1.0% of residents speak other Indo-European language at home (100% very well).
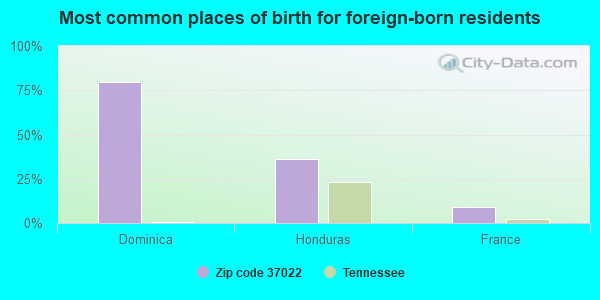
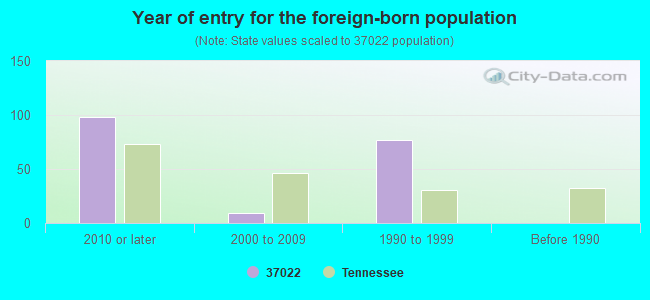
Foreign born population: 176 (2.8%) (21.2% of them are naturalized citizens)
This zip code:
2.8%
Whole state:
5.6%
79%Dominica
36%Honduras
9%France
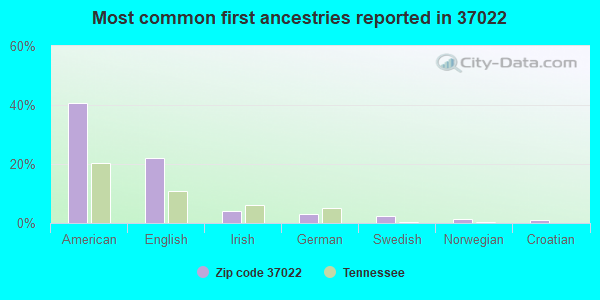
41%American
22%English
4%Irish
3%German
2%Swedish
1%Norwegian
1%Croatian
Year of entry for the foreign-born population
982010 or later
92000 to 2009
771990 to 1999
0Before 1990
Facilities with environmental interests located in this zip code:
BETHPAGE ELEMENTARY SCHOOL (420 OLD 31E HW in BETHPAGE, TN)
(Geographic Names Information System) (National Center for Education Statistics) - STATE ID-0010 Organizations: SUMNER COUNTY SCHOOL DISTRICT (SCHOOL DISTRICT)
Housing units lacking complete plumbing facilities: 1.1% Housing units lacking complete kitchen facilities: 1.9%
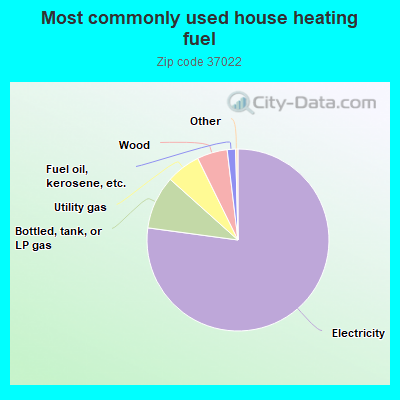
77.3%Electricity
9.5%Bottled, tank, or LP gas
6.1%Utility gas
5.4%Wood
1.5%Fuel oil, kerosene, etc.
Population in 1990: 4,132. Population change in the 1990s: +397 (+9.6%).
Place of birth for U.S.-born residents:
This state: 4,318
Northeast: 281
Midwest: 493
South: 523
West: 472
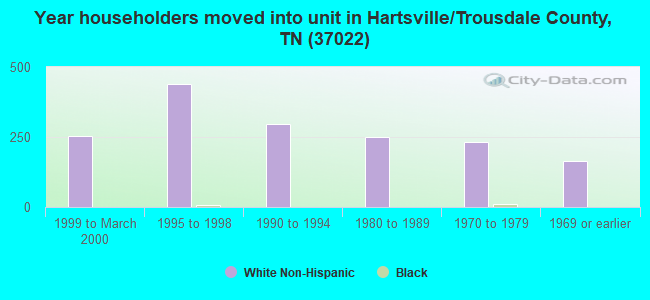
62% of the 37022 zip code residents lived in the same house 5 years ago. Out of people who lived in different houses, 61% lived in this county. Out of people who lived in different counties, 50% lived in Tennessee.
98% of the 37022 zip code residents lived in the same house 1 year ago. Out of people who lived in different houses, 24% moved from this county. Out of people who lived in different houses, 64% moved from different county within same state. Out of people who lived in different houses, 43% moved from different state.
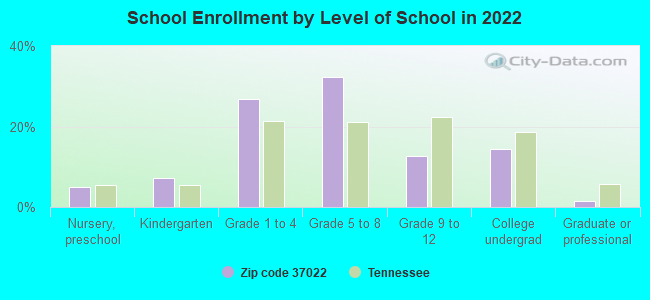
Private vs. public school enrollment:
Students in private schools in grades 1 to 8 (elementary and middle school): 72
Here:
8.3%
Tennessee:
15.0%
Students in private schools in grades 9 to 12 (high school): 15
Here:
8.4%
Tennessee:
16.2%
Students in private undergraduate colleges:
Here:
0.0%
Tennessee:
23.5%
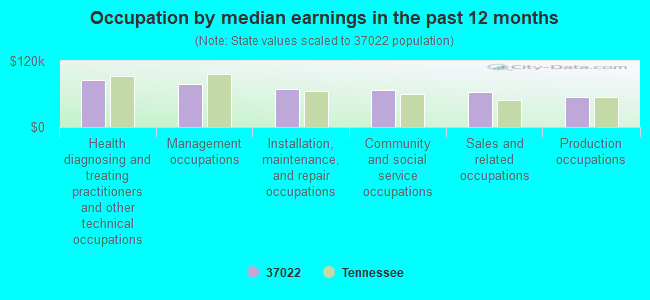
Occupation by median earnings in the past 12 months ($)
85,579Health diagnosing and treating practitioners and other technical occupations
77,651Management occupations
68,894Installation, maintenance, and repair occupations
67,768Community and social service occupations
63,367Sales and related occupations
54,794Production occupations
Companies with federal contracts located in this zip code:
RICKMAN, WILLIAM SAMUEL (285 HONEYSUCKLE LANE ROAD in BETHPAGE, TN; small business)
$7,000 with Army for Miscellaneous Service and Trade Equipment. Signed on 2005-03-07. Completion date: 2005-03-17.
Top industries in this zip code by the number of employees in 2005:
Other Services (except Public Administration): Labor Unions and Similar Labor Organizations (10-19 employees: 1 establishment)
Administrative and Support and Waste Management and Remediation Services: All Other Support Services (10-19: 1)
Construction: New Single-Family Housing Construction (except Operative Builders) (5-9: 2)
Other Services (except Public Administration): Religious Organizations (5-9: 1, 1-4: 3)
Construction: Water and Sewer Line and Related Structures Construction (5-9: 1)
Accommodation and Food Services: Full-Service Restaurants (5-9: 1)
Construction: Electrical Contractors (1-4: 2)
Administrative and Support and Waste Management and Remediation Services: Landscaping Services (1-4: 2)
People in group quarters in 2000:
3 people in homes or halfway houses for drug/alcohol abuse
Fatal accident statistics in 2014:
Fatal accident count: 4
Vehicles involved in fatal accidents: 9
Fatal accidents caused by drunken drivers: 2
Fatalities: 4
Persons involved in fatal accidents: 10
Pedestrians involved in fatal accidents: 2
Fatal accident statistics in 2012:
Fatal accident count: 2
Vehicles involved in fatal accidents: 2
Fatal accidents caused by drunken drivers: 0
Fatalities: 2
Persons involved in fatal accidents: 2
Pedestrians involved in fatal accidents: 0
Home Mortgage Disclosure Act Aggregated Statistics For Year 2009 (Based on 4 partial tracts)
A) FHA, FSA/RHS & VA Home Purchase Loans
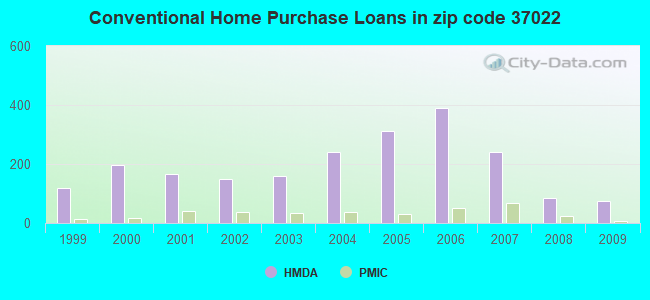
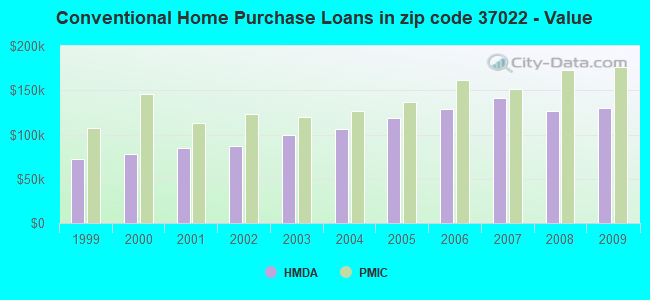
B) Conventional Home Purchase Loans
C) Refinancings
D) Home Improvement Loans
E) Loans on Dwellings For 5+ Families
F) Non-occupant Loans on < 5 Family Dwellings (A B C & D)
G) Loans On Manufactured Home Dwelling (A B C & D)
Number
Average Value
Number
Average Value
Number
Average Value
Number
Average Value
Number
Average Value
Number
Average Value
Number
Average Value
LOANS ORIGINATED
66
$144,295
74
$130,422
405
$137,902
37
$27,875
1
$625,500
55
$87,563
70
$52,566
APPLICATIONS APPROVED, NOT ACCEPTED
3
$111,903
7
$127,540
23
$143,800
2
$6,420
0
$0
2
$94,140
4
$61,605
APPLICATIONS DENIED
10
$164,386
12
$141,554
115
$156,024
19
$28,635
0
$0
4
$146,428
20
$83,568
APPLICATIONS WITHDRAWN
9
$136,214
12
$154,551
111
$169,730
2
$176,740
0
$0
2
$151,895
7
$76,620
FILES CLOSED FOR INCOMPLETENESS
4
$143,305
1
$146,340
21
$175,093
0
$0
0
$0
0
$0
1
$56,710
Aggregated Statistics For Year 2008 (Based on 4 partial tracts)
A) FHA, FSA/RHS & VA Home Purchase Loans
B) Conventional Home Purchase Loans
C) Refinancings
D) Home Improvement Loans
F) Non-occupant Loans on < 5 Family Dwellings (A B C & D)
G) Loans On Manufactured Home Dwelling (A B C & D)
Number
Average Value
Number
Average Value
Number
Average Value
Number
Average Value
Number
Average Value
Number
Average Value
LOANS ORIGINATED
80
$144,480
85
$127,050
322
$127,018
56
$29,294
64
$80,926
99
$54,668
APPLICATIONS APPROVED, NOT ACCEPTED
2
$102,305
7
$193,887
28
$148,057
4
$46,492
0
$0
6
$71,612
APPLICATIONS DENIED
15
$124,291
16
$115,924
168
$144,207
41
$56,620
8
$106,524
31
$80,124
APPLICATIONS WITHDRAWN
19
$158,925
21
$135,265
80
$152,742
9
$65,543
3
$109,677
7
$74,596
FILES CLOSED FOR INCOMPLETENESS
2
$124,095
2
$104,555
16
$152,773
0
$0
1
$207,100
1
$127,190
Aggregated Statistics For Year 2007 (Based on 4 partial tracts)
A) FHA, FSA/RHS & VA Home Purchase Loans
B) Conventional Home Purchase Loans
C) Refinancings
D) Home Improvement Loans
F) Non-occupant Loans on < 5 Family Dwellings (A B C & D)
G) Loans On Manufactured Home Dwelling (A B C & D)
Number
Average Value
Number
Average Value
Number
Average Value
Number
Average Value
Number
Average Value
Number
Average Value
LOANS ORIGINATED
49
$138,158
242
$141,032
295
$122,083
71
$38,668
52
$99,026
88
$52,713
APPLICATIONS APPROVED, NOT ACCEPTED
1
$134,600
34
$142,941
52
$113,858
8
$46,326
6
$138,532
12
$70,248
APPLICATIONS DENIED
15
$130,750
66
$124,884
240
$131,968
37
$61,564
5
$84,352
39
$74,396
APPLICATIONS WITHDRAWN
13
$137,478
34
$133,676
107
$152,635
8
$125,198
6
$121,910
7
$87,781
FILES CLOSED FOR INCOMPLETENESS
0
$0
7
$110,644
25
$145,760
2
$114,830
1
$32,250
2
$79,455
Aggregated Statistics For Year 2006 (Based on 4 partial tracts)
A) FHA, FSA/RHS & VA Home Purchase Loans
B) Conventional Home Purchase Loans
C) Refinancings
D) Home Improvement Loans
E) Loans on Dwellings For 5+ Families
F) Non-occupant Loans on < 5 Family Dwellings (A B C & D)
G) Loans On Manufactured Home Dwelling (A B C & D)
Number
Average Value
Number
Average Value
Number
Average Value
Number
Average Value
Number
Average Value
Number
Average Value
Number
Average Value
LOANS ORIGINATED
46
$126,617
389
$128,388
280
$107,653
76
$20,807
1
$44,480
69
$99,313
82
$58,526
APPLICATIONS APPROVED, NOT ACCEPTED
1
$88,960
49
$122,850
46
$119,305
3
$49,350
0
$0
6
$53,397
9
$65,427
APPLICATIONS DENIED
7
$146,447
85
$119,981
185
$112,294
41
$28,754
0
$0
17
$86,901
35
$68,121
APPLICATIONS WITHDRAWN
9
$142,980
42
$125,833
107
$124,637
9
$84,686
0
$0
4
$101,290
11
$63,373
FILES CLOSED FOR INCOMPLETENESS
0
$0
13
$93,138
25
$138,743
0
$0
0
$0
2
$132,220
2
$92,895
Aggregated Statistics For Year 2005 (Based on 4 partial tracts)
A) FHA, FSA/RHS & VA Home Purchase Loans
B) Conventional Home Purchase Loans
C) Refinancings
D) Home Improvement Loans
F) Non-occupant Loans on < 5 Family Dwellings (A B C & D)
G) Loans On Manufactured Home Dwelling (A B C & D)
Number
Average Value
Number
Average Value
Number
Average Value
Number
Average Value
Number
Average Value
Number
Average Value
LOANS ORIGINATED
50
$137,209
313
$118,932
326
$109,126
68
$28,747
44
$65,724
93
$57,526
APPLICATIONS APPROVED, NOT ACCEPTED
1
$137,780
36
$111,305
73
$105,349
4
$23,660
2
$74,885
10
$56,553
APPLICATIONS DENIED
14
$123,926
70
$100,992
217
$110,244
38
$23,918
4
$88,895
42
$77,527
APPLICATIONS WITHDRAWN
11
$117,037
56
$126,286
188
$131,629
13
$103,497
10
$102,908
16
$67,811
FILES CLOSED FOR INCOMPLETENESS
1
$60,760
17
$97,910
24
$131,252
0
$0
1
$126,660
2
$109,540
Aggregated Statistics For Year 2004 (Based on 4 partial tracts)
A) FHA, FSA/RHS & VA Home Purchase Loans
B) Conventional Home Purchase Loans
C) Refinancings
D) Home Improvement Loans
F) Non-occupant Loans on < 5 Family Dwellings (A B C & D)
G) Loans On Manufactured Home Dwelling (A B C & D)
Number
Average Value
Number
Average Value
Number
Average Value
Number
Average Value
Number
Average Value
Number
Average Value
LOANS ORIGINATED
59
$114,288
239
$105,823
341
$96,296
53
$27,521
65
$63,434
103
$59,138
APPLICATIONS APPROVED, NOT ACCEPTED
4
$109,598
41
$79,732
85
$103,952
5
$49,374
3
$79,590
20
$62,980
APPLICATIONS DENIED
7
$104,836
84
$90,823
227
$103,254
44
$26,321
9
$84,537
63
$74,534
APPLICATIONS WITHDRAWN
8
$115,096
21
$87,200
172
$108,434
2
$19,740
3
$53,343
16
$81,005
FILES CLOSED FOR INCOMPLETENESS
0
$0
10
$118,154
17
$121,043
3
$47,943
1
$121,410
2
$103,930
Aggregated Statistics For Year 2003 (Based on 4 partial tracts)
A) FHA, FSA/RHS & VA Home Purchase Loans
B) Conventional Home Purchase Loans
C) Refinancings
D) Home Improvement Loans
E) Loans on Dwellings For 5+ Families
F) Non-occupant Loans on < 5 Family Dwellings (A B C & D)
Number
Average Value
Number
Average Value
Number
Average Value
Number
Average Value
Number
Average Value
Number
Average Value
LOANS ORIGINATED
56
$118,448
159
$99,545
628
$101,440
31
$24,448
2
$28,910
54
$63,164
APPLICATIONS APPROVED, NOT ACCEPTED
3
$115,287
26
$86,892
103
$102,771
8
$19,188
0
$0
4
$113,182
APPLICATIONS DENIED
11
$101,806
68
$73,515
239
$99,215
26
$23,220
1
$41,700
10
$83,461
APPLICATIONS WITHDRAWN
8
$100,805
17
$123,317
127
$112,461
7
$56,914
0
$0
3
$162,303
FILES CLOSED FOR INCOMPLETENESS
1
$94,670
4
$120,078
16
$110,132
1
$31,660
0
$0
1
$67,610
Aggregated Statistics For Year 2002 (Based on 4 partial tracts)
A) FHA, FSA/RHS & VA Home Purchase Loans
B) Conventional Home Purchase Loans
C) Refinancings
D) Home Improvement Loans
E) Loans on Dwellings For 5+ Families
F) Non-occupant Loans on < 5 Family Dwellings (A B C & D)
Number
Average Value
Number
Average Value
Number
Average Value
Number
Average Value
Number
Average Value
Number
Average Value
LOANS ORIGINATED
54
$101,844
149
$87,448
448
$100,010
34
$28,917
1
$75,060
54
$54,518
APPLICATIONS APPROVED, NOT ACCEPTED
5
$81,186
28
$83,766
73
$94,824
3
$18,257
0
$0
2
$62,900
APPLICATIONS DENIED
11
$88,779
65
$61,256
189
$94,789
22
$8,712
0
$0
7
$69,233
APPLICATIONS WITHDRAWN
2
$139,925
16
$118,648
80
$115,568
2
$52,520
0
$0
2
$34,660
FILES CLOSED FOR INCOMPLETENESS
1
$71,890
7
$82,007
22
$111,322
1
$63,330
0
$0
0
$0
Aggregated Statistics For Year 2001 (Based on 4 partial tracts)
A) FHA, FSA/RHS & VA Home Purchase Loans
B) Conventional Home Purchase Loans
C) Refinancings
D) Home Improvement Loans
E) Loans on Dwellings For 5+ Families
F) Non-occupant Loans on < 5 Family Dwellings (A B C & D)
Number
Average Value
Number
Average Value
Number
Average Value
Number
Average Value
Number
Average Value
Number
Average Value
LOANS ORIGINATED
62
$110,301
165
$84,633
471
$95,879
38
$12,708
1
$106,200
36
$65,053
APPLICATIONS APPROVED, NOT ACCEPTED
2
$90,555
43
$65,927
57
$91,186
7
$23,251
0
$0
4
$42,620
APPLICATIONS DENIED
7
$105,597
84
$59,533
195
$81,574
37
$11,726
0
$0
11
$70,328
APPLICATIONS WITHDRAWN
3
$97,407
18
$68,627
114
$90,399
4
$14,652
0
$0
4
$83,402
FILES CLOSED FOR INCOMPLETENESS
0
$0
4
$133,308
20
$79,940
0
$0
0
$0
0
$0
Aggregated Statistics For Year 2000 (Based on 4 partial tracts)
A) FHA, FSA/RHS & VA Home Purchase Loans
B) Conventional Home Purchase Loans
C) Refinancings
D) Home Improvement Loans
E) Loans on Dwellings For 5+ Families
F) Non-occupant Loans on < 5 Family Dwellings (A B C & D)
Number
Average Value
Number
Average Value
Number
Average Value
Number
Average Value
Number
Average Value
Number
Average Value
LOANS ORIGINATED
33
$109,202
197
$77,429
189
$76,710
43
$15,363
0
$0
30
$46,663
APPLICATIONS APPROVED, NOT ACCEPTED
3
$86,437
48
$58,812
60
$66,368
17
$16,566
0
$0
3
$49,187
APPLICATIONS DENIED
9
$59,509
158
$55,891
167
$69,363
43
$22,125
0
$0
6
$59,765
APPLICATIONS WITHDRAWN
4
$101,198
24
$70,143
85
$71,207
4
$19,092
1
$95,850
2
$77,265
FILES CLOSED FOR INCOMPLETENESS
1
$36,700
9
$88,596
21
$77,657
0
$0
0
$0
1
$50,490
Aggregated Statistics For Year 1999 (Based on 2 partial tracts)
A) FHA, FSA/RHS & VA Home Purchase Loans
B) Conventional Home Purchase Loans
C) Refinancings
D) Home Improvement Loans
F) Non-occupant Loans on < 5 Family Dwellings (A B C & D)
Detailed PMIC statistics for the following Tracts:0201.00
, 0206.00
2002 - 2018 National Fire Incident Reporting System (NFIRS) incidents
Based on the data from the years 2002 - 2018 the average number of fire incidents per year is 26. The highest number of reported fire incidents - 56 took place in 2005, and the least - 11 in 2003. The data has a growing trend.
When looking into fire subcategories, the most incidents belonged to: Outside Fires (47.6%), and Structure Fires (35.7%).
Fire incident types reported to NFIRS in Zip Code 37022
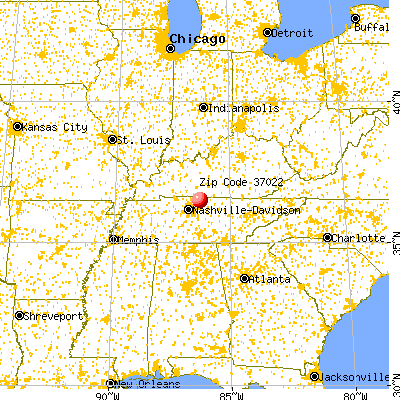


 Nearest zip codes: 37186, 37031, 42120, 37066, 37148, 37074.
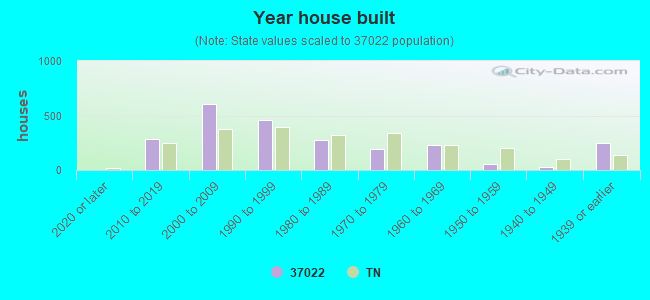


 Based on the data from the years 2002 - 2018 the average number of fire incidents per year is 26. The highest number of reported fire incidents - 56 took place in 2005, and the least - 11 in 2003. The data has a growing trend.
 When looking into fire subcategories, the most incidents belonged to: Outside Fires (47.6%), and Structure Fires (35.7%).