Estimated zip code population in 2022: 4,260 Zip code population in 2010: 4,894 Zip code population in 2000: 4,792
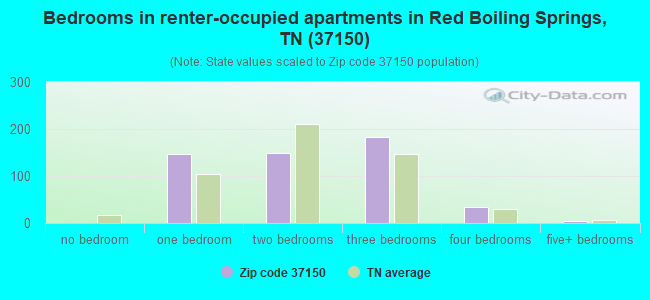
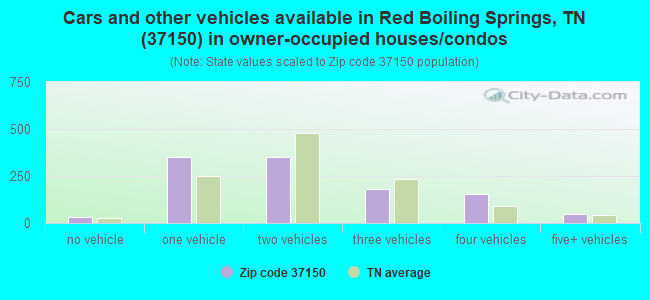
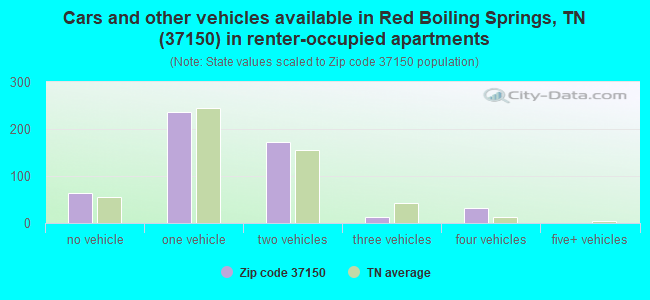
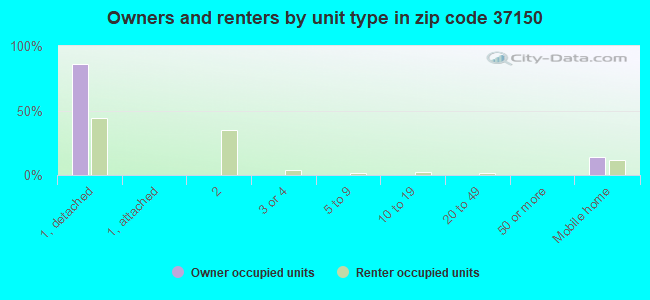
Houses and condos: 2,246 Renter-occupied apartments: 516
% of renters here:
31%
State:
33%
March 2022 cost of living index in zip code 37150: 80.4 (low, U.S. average is 100)
Land area: 106.9 sq. mi. Water area: 0.1 sq. mi.
Population density: 40 people per square mile
(very low).
OSM Map
General Map
Google Map
MSN Map
OSM Map
General Map
Google Map
MSN Map
OSM Map
General Map
Google Map
MSN Map
OSM Map
General Map
Google Map
MSN Map
Please wait while loading the map...
Real estate property taxes paid for housing units in 2022:
This zip code:
0.5% ($824)
Tennessee:
0.5% ($1,376)
Median real estate property taxes paid for housing units with mortgages in 2022: $1,085 (0.4%) Median real estate property taxes paid for housing units with no mortgage in 2022: $657 (0.6%)
Business Search- 14 Million verified businesses
Males: 2,117
(49.7%)
Females: 2,142
(50.3%)
For population 25 years and over in 37150:
High school or higher: 81.9%
Bachelor's degree or higher: 12.8%
Graduate or professional degree: 4.2%
Unemployed: 7.2%
Mean travel time to work (commute): 32.4 minutes
For population 15 years and over in 37150:
Never married: 21.1%
Now married: 50.1%
Separated: 4.8%
Widowed: 12.6%
Divorced: 11.4%
Zip code 37150 compared to state average:
Median household income below state average.
Median house value below state average.
Unemployed percentage above state average.
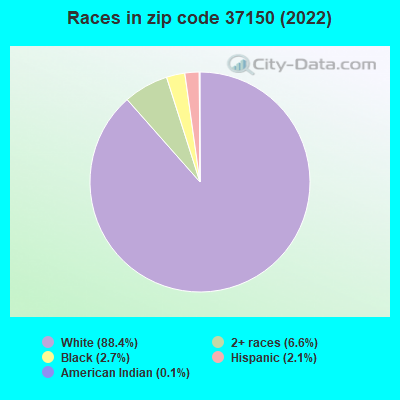
Black race population percentage significantly below state average.
Hispanic race population percentage below state average.
Foreign-born population percentage significantly below state average.
Length of stay since moving in significantly above state average.
Percentage of population with a bachelor's degree or higher significantly below state average.
Estimated median house/condo value in 2022: $167,002
37150:
$167,002
Tennessee:
$284,800
According to our research of Tennessee and other state lists, there were 16 registered sex offenders living in 37150 zip code as of April 27, 2024. The ratio of all residents to sex offenders in zip code 37150 is 309 to 1. The ratio of registered sex offenders to all residents in this zip code is near the state average.
Median resident age:
This zip code:
40.5 years
Tennessee median age:
39.2 years
Average household size:
This zip code:
2.5 people
Tennessee:
2.4 people
Averages for the 2020 tax year for zip code 37150, filed in 2021:
Average Adjusted Gross Income (AGI) in 2020: $42,959 (Individual Income Tax Returns)
Here:
$42,959
State:
$69,014
Salary/wage: $36,935 (reported on 79.3% of returns)
Here:
$36,935
State:
$55,872
(% of AGI for various income ranges: 1273.8% for AGIs below $25k, 3640.9% for AGIs $25k-50k, 5847.5% for AGIs $50k-75k, 9900.0% for AGIs $75k-100k, 18551.4% for AGIs $100k-200k)
Taxable interest for individuals: $1,723 (reported on 24.9% of returns)
This zip code:
$1,723
Tennessee:
$1,945
(% of AGI for various income ranges: 19.7% for AGIs below $25k, 18.7% for AGIs $25k-50k, 76.0% for AGIs $50k-75k, 127.1% for AGIs $75k-100k, 105.7% for AGIs $100k-200k)
Ordinary dividends: $3,273 (reported on 5.7% of returns)
Here:
$3,273
State:
$8,105
(% of AGI for various income ranges: 10.8% for AGIs below $25k, 42.5% for AGIs $50k-75k, 294.3% for AGIs $100k-200k)
Net capital gain/loss in AGI: +$49,923 (reported on 6.7% of returns)
Here:
+$49,923
State:
+$33,664
(% of AGI for various income ranges: 13.9% for AGIs below $25k, 25.0% for AGIs $25k-50k, 79.0% for AGIs $50k-75k, 8754.3% for AGIs $100k-200k)
Profit/loss from business: +$8,366 (reported on 21.2% of returns)
Here:
+$8,366
State:
+$18,991
(% of AGI for various income ranges: 156.6% for AGIs below $25k, 139.6% for AGIs $25k-50k, 203.0% for AGIs $50k-75k, 408.6% for AGIs $75k-100k, 1562.9% for AGIs $100k-200k)
Taxable individual retirement arrangement distribution: $16,310 (reported on 5.2% of returns)
37150:
$16,310
Tennessee:
$20,036
(% of AGI for various income ranges: 34.7% for AGIs below $25k, 122.0% for AGIs $25k-50k, 1211.4% for AGIs $75k-100k)
Earned income credit: $2,265 (reported on 32.6% of returns)
Here:
$2,265
State:
$2,391
(% of AGI for various income ranges: 158.0% for AGIs below $25k, 90.4% for AGIs $25k-50k)
Percentage of individuals using paid preparers for their 2020 taxes: 91.7%
Here:
92%
State:
93%
(% for various income ranges: 90.0% for AGIs below $25k, 94.5% for AGIs $25k-50k, 95.7% for AGIs $50k-75k, 90.9% for AGIs $75k-100k, 90.9% for AGIs $100k-200k, 66.7% for AGIs over 200k)
Averages for the 2012 tax year for zip code 37150, filed in 2013:
Average Adjusted Gross Income (AGI) in 2012: $31,227 (Individual Income Tax Returns)
Here:
$31,227
State:
$53,767
Salary/wage: $29,206 (reported on 82.8% of returns)
Here:
$29,206
State:
$45,421
(% of AGI for various income ranges: 79.2% for AGIs below $25k, 82.3% for AGIs $25k-50k, 80.3% for AGIs $50k-75k, 84.2% for AGIs $75k-100k, 52.8% for AGIs $100k-200k)
Taxable interest for individuals: $1,140 (reported on 27.8% of returns)
This zip code:
$1,140
Tennessee:
$1,732
(% of AGI for various income ranges: 0.9% for AGIs below $25k, 0.9% for AGIs $25k-50k, 0.8% for AGIs $50k-75k, 0.4% for AGIs $75k-100k, 2.4% for AGIs $100k-200k)
Ordinary dividends: $1,158 (reported on 6.7% of returns)
Here:
$1,158
State:
$6,739
(% of AGI for various income ranges: 0.3% for AGIs below $25k, 0.1% for AGIs $25k-50k, 0.3% for AGIs $50k-75k, 0.6% for AGIs $75k-100k)
Net capital gain/loss in AGI: +$5,742 (reported on 10.6% of returns)
Here:
+$5,742
State:
+$19,082
(% of AGI for various income ranges: 0.4% for AGIs below $25k, 1.2% for AGIs $25k-50k, 1.5% for AGIs $50k-75k, 8.7% for AGIs $100k-200k)
Profit/loss from business: +$6,074 (reported on 25.6% of returns)
Here:
+$6,074
State:
+$15,240
(% of AGI for various income ranges: 11.2% for AGIs below $25k, 5.3% for AGIs $25k-50k, 2.9% for AGIs $50k-75k, 2.3% for AGIs $75k-100k)
Taxable individual retirement arrangement distribution: $9,609 (reported on 6.1% of returns)
37150:
$9,609
Tennessee:
$15,505
(% of AGI for various income ranges: 1.2% for AGIs below $25k, 2.0% for AGIs $25k-50k, 4.7% for AGIs $50k-75k)
Total itemized deductions: $15,667 (23% of AGI, reported on 6.7% of returns)
Here:
$15,667
State:
$21,976
Here:
23.0% of AGI
State:
17.8% of AGI
(% of AGI for various income ranges: 4.5% for AGIs $25k-50k, 4.3% for AGIs $50k-75k, 8.4% for AGIs $75k-100k)
Charity contributions: $4,388 (reported on 4.4% of returns)
Here:
$4,388
State:
$6,709
(% of AGI for various income ranges: 0.9% for AGIs below $25k, 0.4% for AGIs $50k-75k, 2.5% for AGIs $75k-100k)
Taxes paid: $2,964 (reported on 6.1% of returns)
37150:
$2,964
State:
$4,829
(% of AGI for various income ranges: 0.5% for AGIs $25k-50k, 0.7% for AGIs $50k-75k, 2.0% for AGIs $75k-100k)
Earned income credit: $2,405 (reported on 31.1% of returns)
Here:
$2,405
State:
$2,404
(% of AGI for various income ranges: 8.6% for AGIs below $25k, 1.7% for AGIs $25k-50k)
Percentage of individuals using paid preparers for their 2012 taxes: 65.0%
Here:
65%
State:
52%
(% for various income ranges: 58.4% for AGIs below $25k, 71.1% for AGIs $25k-50k, 76.2% for AGIs $50k-75k, 66.7% for AGIs $75k-100k, 100.0% for AGIs $100k-200k)
Averages for the 2004 tax year for zip code 37150, filed in 2005:
Average Adjusted Gross Income (AGI) in 2004: $28,551 (Individual Income Tax Returns)
Here:
$28,551
State:
$44,088
Salary/wage: $28,278 (reported on 83.6% of returns)
Here:
$28,278
State:
$38,825
(% of AGI for various income ranges: 160.4% for AGIs below $10k, 81.4% for AGIs $10k-25k, 89.6% for AGIs $25k-50k, 87.0% for AGIs $50k-75k, 85.2% for AGIs $75k-100k, 51.6% for AGIs over 100k)
Taxable interest for individuals: $1,590 (reported on 36.2% of returns)
This zip code:
$1,590
Tennessee:
$1,802
(% of AGI for various income ranges: 10.9% for AGIs below $10k, 1.5% for AGIs $10k-25k, 1.7% for AGIs $25k-50k, 0.9% for AGIs $50k-75k, 1.2% for AGIs $75k-100k, 4.3% for AGIs over 100k)
Taxable dividends: $880 (reported on 8.7% of returns)
Here:
$880
State:
$3,727
(% of AGI for various income ranges: 1.6% for AGIs below $10k, 0.2% for AGIs $10k-25k, 0.2% for AGIs $25k-50k, 0.3% for AGIs $50k-75k, 0.4% for AGIs $75k-100k, 0.3% for AGIs over 100k)
Net capital gain/loss: +$12,651 (reported on 9.3% of returns)
Here:
+$12,651
State:
+$15,776
(% of AGI for various income ranges: 2.3% for AGIs below $10k, 2.2% for AGIs $10k-25k, 1.3% for AGIs $25k-50k, 1.6% for AGIs $50k-75k, 2.2% for AGIs $75k-100k, 18.2% for AGIs over 100k)
Profit/loss from business: +$7,645 (reported on 20.8% of returns)
Here:
+$7,645
State:
+$12,882
(% of AGI for various income ranges: 29.0% for AGIs below $10k, 9.4% for AGIs $10k-25k, 3.7% for AGIs $25k-50k, 3.8% for AGIs $50k-75k, 13.8% for AGIs $75k-100k)
IRA payment deduction: $3,489 (reported on 2.6% of returns)
37150:
$3,489
Tennessee:
$2,934
Total itemized deductions: $14,239 (18% of AGI, reported on 7.4% of returns)
Here:
$14,239
State:
$18,035
Here:
18.1% of AGI
State:
19.9% of AGI
(% of AGI for various income ranges: 2.7% for AGIs $10k-25k, 3.3% for AGIs $25k-50k, 4.6% for AGIs $50k-75k, 6.0% for AGIs $75k-100k, 3.7% for AGIs over 100k)
Charity contributions deductions: $4,292 (5% of AGI, reported on 5.3% of returns)
Here:
$4,292
State:
$5,167
Here:
4.6% of AGI
State:
5.3% of AGI
(% of AGI for various income ranges: 0.1% for AGIs $10k-25k, 0.6% for AGIs $25k-50k, 0.6% for AGIs $50k-75k, 0.8% for AGIs $75k-100k, 2.5% for AGIs over 100k)
Total tax: $3,772 (reported on 67.1% of returns)
37150:
$3,772
State:
$7,482
(% of AGI for various income ranges: 7.7% for AGIs below $10k, 4.2% for AGIs $10k-25k, 5.7% for AGIs $25k-50k, 8.4% for AGIs $50k-75k, 10.2% for AGIs $75k-100k, 22.4% for AGIs over 100k)
Earned income credit: $1,873 (reported on 26.4% of returns)
Here:
$1,873
State:
$1,826
Percentage of individuals using paid preparers for their 2004 taxes: 75.8%
Here:
76%
State:
60%
(% for various income ranges: 71.6% for AGIs below $10k, 76.5% for AGIs $10k-25k, 77.2% for AGIs $25k-50k, 77.5% for AGIs $50k-75k, 77.6% for AGIs $75k-100k, 88.9% for AGIs over 100k)
Household received Food Stamps/SNAP in the past 12 months: 309 Household did not receive Food Stamps/SNAP in the past 12 months: 1,323
Women who had a birth in the past 12 months: 42 (34 now married, 8 unmarried) Women who did not have a birth in the past 12 months: 817 (407 now married, 410 unmarried)
Housing units in zip code 37150 with a mortgage: 400 (10 second mortgage, 5 both second mortgage and home equity loan) Median monthly owner costs for units with a mortgage: $1,167 Median monthly owner costs for units without a mortgage: $356
Residents with income below the poverty level in 2022:
This zip code:
26.9%
Whole state:
13.3%
Residents with income below 50% of the poverty level in 2022:
This zip code:
12.0%
Whole state:
7.1%
Median number of rooms in houses and condos:
Here:
5.6
State:
6.5
Median number of rooms in apartments:
Here:
4.8
State:
4.4
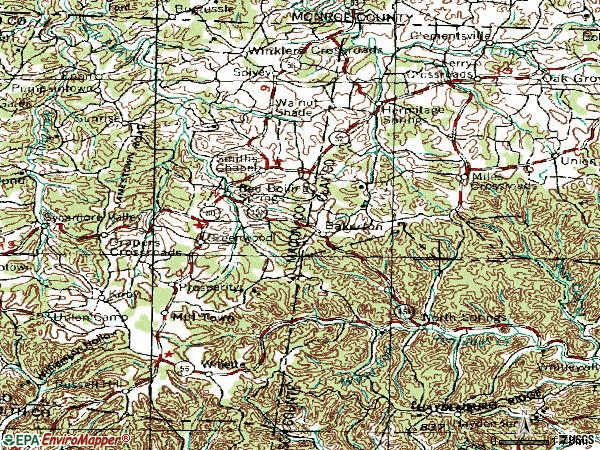
Notable locations in this zip code not listed on our city pages
Notable locations in zip code 37150: Little Creek Farms (A), Ridge Top Farm (B), Salt Lick (C), Red Boiling Springs Fire Department (D), Mount Vernon Volunteer Fire Department Red Boiling Springs (E), Red Boiling Springs City Hall (F), Willette Volunteer Fire Department (G), Hermitage Springs Volunteer Fire Department (H). Display/hide their locations on the map
Churches in zip code 37150 include: Smith Chapel (A), Oak Grove Church (B), Leonard Church (C), Bethany Church (D), Walnut Grove Church (E), Bakerton Church of Christ (F), Clementsville Church of Christ (G), Hermitage Springs Church of Christ (H), Milestown Church of Christ (I). Display/hide their locations on the map
Cemeteries: Thomas Cemetery (1), Irving Meador Cemetery (2), Wakefield - Kirby Cemetery (3), Cothron - Gregory Cemetery (4), Bell Cemetery (5), Turner Cemetery (6), Jones Cemetery (7). Display/hide their locations on the map
Reservoirs: Red Boiling Springs Watershed Lake Number Two (A), Line Creek Lake Number Three B (B), Red Boiling Springs Lake Number One (C), Lake Number Seventeen (D), Lake Number Sixteen (E). Display/hide their locations on the map
Streams, rivers, and creeks: Little Salt Lick Creek (A), Cove Creek (B), Hurricane Creek (C), Trace Creek (D), Dry Branch (E), Chicken Branch (F), Witcher Hollow Branch (G), Long Hungry Creek (H), Bean Branch (I). Display/hide their locations on the map
In group quarters: 90 (-1 institutionalized population)
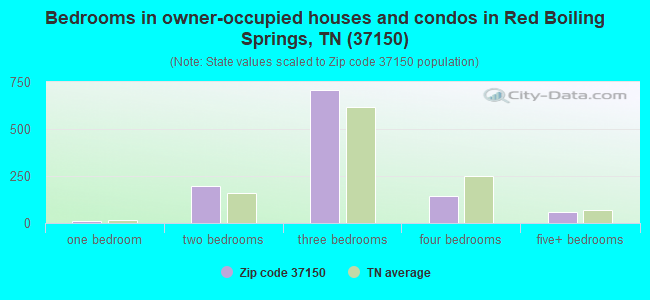
Size of family households: 460 2-persons, 197 3-persons, 156 4-persons, 154 5-persons, 32 6-persons, 8 7-or-more-persons
Size of nonfamily households: 582 1-person, 44 2-persons
634 married couples with children.
344 single-parent households (121 men, 223 women).
95.1% of residents of 37150 zip code speak English at home.
4.5% of residents speak Spanish at home (84% very well, 2% well, 14% not at all).
0.3% of residents speak other Indo-European language at home (100% very well).
Foreign born population: 33 (0.8%) (30.9% of them are naturalized citizens)
This zip code:
0.8%
Whole state:
5.6%
58%Honduras
30%France
57%American
21%English
6%Irish
3%Scottish
2%German
1%French
1%British
Year of entry for the foreign-born population
132010 or later
112000 to 2009
01990 to 1999
9Before 1990
Facilities with environmental interests located in this zip code:
BIOTEN OPERATION, INC. (113 OAK STREET in RED BOILING SPR, TN)
AIR MAJOR (AIRS/AFS) Business SIC classification: ELECTRIC SERVICES
Housing units lacking complete plumbing facilities: 11.4% Housing units lacking complete kitchen facilities: 11.9%
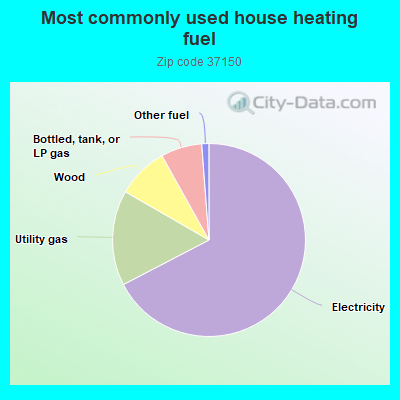
67.5%Electricity
16.0%Utility gas
8.6%Wood
6.9%Bottled, tank, or LP gas
1.2%Other fuel
Population in 1990: 4,862.
Place of birth for U.S.-born residents:
This state: 2,718
Northeast: 88
Midwest: 389
South: 960
West: 38
63% of the 37150 zip code residents lived in the same house 5 years ago. Out of people who lived in different houses, 48% lived in this county. Out of people who lived in different counties, 50% lived in Tennessee.
92% of the 37150 zip code residents lived in the same house 1 year ago. Out of people who lived in different houses, 65% moved from this county. Out of people who lived in different houses, 15% moved from different county within same state. Out of people who lived in different houses, 17% moved from different state.
Private vs. public school enrollment:
Students in private schools in grades 1 to 8 (elementary and middle school): 51
Here:
12.9%
Tennessee:
15.0%
Students in private schools in grades 9 to 12 (high school):
Here:
0.0%
Tennessee:
16.2%
Students in private undergraduate colleges: 7
Here:
5.7%
Tennessee:
23.5%
Occupation by median earnings in the past 12 months ($)
90,405Installation, maintenance, and repair occupations
47,846Construction and extraction occupations
46,620Transportation occupations
45,307Management occupations
41,392Building and grounds cleaning and maintenance occupations
39,171Office and administrative support occupations
Top industries in this zip code by the number of employees in 2005:
Health Care and Social Assistance: Nursing Care Facilities (50-99 employees: 1 establishment)
Finance and Insurance: Commercial Banking (10-19: 1, 1-4: 1)
Information: Newspaper Publishers (10-19: 1)
Other Services (except Public Administration): Other Personal and Household Goods Repair and Maintenance (10-19: 1)
People in group quarters in 2010:
116 people in nursing facilities/skilled-nursing facilities
People in group quarters in 2000:
117 people in nursing homes
Fatal accident statistics in 2012:
Fatal accident count: 1
Vehicles involved in fatal accidents: 2
Fatal accidents caused by drunken drivers: 1
Fatalities: 1
Persons involved in fatal accidents: 4
Pedestrians involved in fatal accidents: 0
2002 - 2018 National Fire Incident Reporting System (NFIRS) incidents
Based on the data from the years 2002 - 2018 the average number of fires per year is 37. The highest number of reported fires - 60 took place in 2005, and the least - 14 in 2013. The data has an increasing trend.
When looking into fire subcategories, the most incidents belonged to: Structure Fires (40.9%), and Outside Fires (38.7%).
Fire incident types reported to NFIRS in Zip Code 37150


 Nearest zip codes: 42140, 38588, 38575, 37145, 37083, 42167.
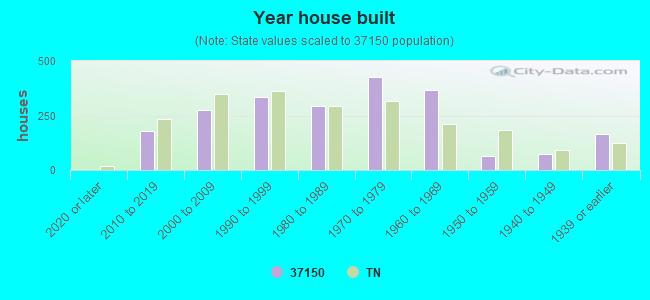


 Based on the data from the years 2002 - 2018 the average number of fires per year is 37. The highest number of reported fires - 60 took place in 2005, and the least - 14 in 2013. The data has an increasing trend.
 When looking into fire subcategories, the most incidents belonged to: Structure Fires (40.9%), and Outside Fires (38.7%).