Estimated zip code population in 2022: 29,930 Zip code population in 2010: 25,699 Zip code population in 2000: 27,751
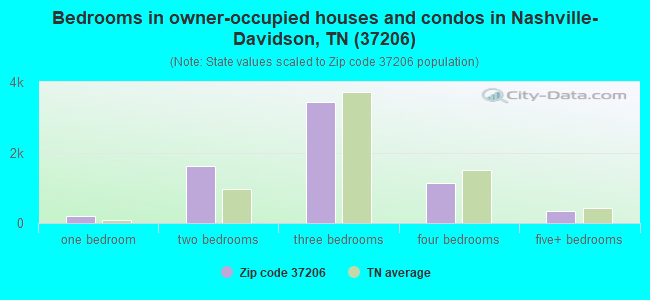
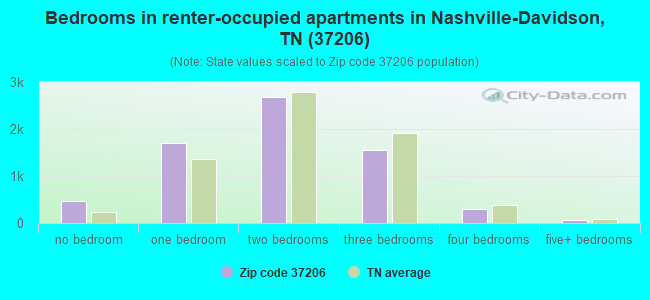
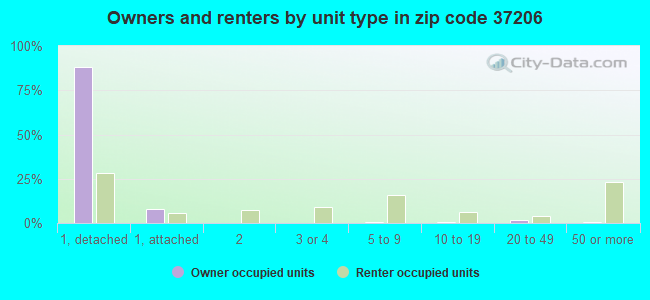
Houses and condos: 14,340 Renter-occupied apartments: 6,732
% of renters here:
50%
State:
33%
March 2022 cost of living index in zip code 37206: 92.6 (less than average, U.S. average is 100)
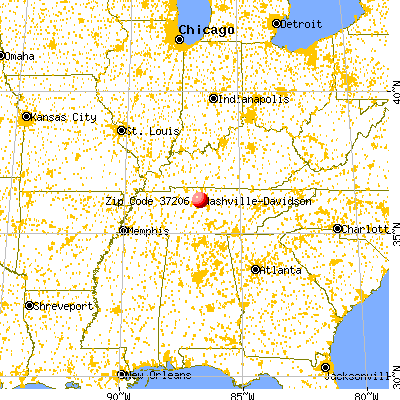
Land area: 7.7 sq. mi. Water area: 0.2 sq. mi.
Population density: 3,875 people per square mile
(average).
OSM Map
General Map
Google Map
MSN Map
OSM Map
General Map
Google Map
MSN Map
OSM Map
General Map
Google Map
MSN Map
OSM Map
General Map
Google Map
MSN Map
Please wait while loading the map...
Real estate property taxes paid for housing units in 2022:
This zip code:
0.5% ($3,000)
Tennessee:
0.5% ($1,376)
Median real estate property taxes paid for housing units with mortgages in 2022: $3,193 (0.5%) Median real estate property taxes paid for housing units with no mortgage in 2022: $2,560 (0.6%)
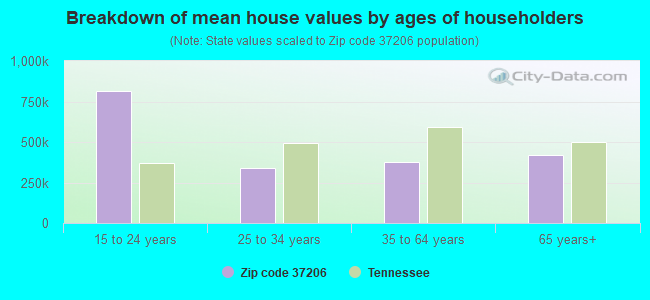
Estimated median house/condo value in 2022: $590,828
37206:
$590,828
Tennessee:
$284,800
According to our research of Tennessee and other state lists, there were 40 registered sex offenders living in 37206 zip code as of April 26, 2024. The ratio of all residents to sex offenders in zip code 37206 is 643 to 1. The ratio of registered sex offenders to all residents in this zip code is lower than the state average.
Median resident age:
This zip code:
33.6 years
Tennessee median age:
39.2 years
Average household size:
This zip code:
2.2 people
Tennessee:
2.4 people
Averages for the 2020 tax year for zip code 37206, filed in 2021:
Average Adjusted Gross Income (AGI) in 2020: $79,974 (Individual Income Tax Returns)
Here:
$79,974
State:
$69,014
Salary/wage: $67,091 (reported on 86.9% of returns)
Here:
$67,091
State:
$55,872
(% of AGI for various income ranges: 1103.0% for AGIs below $25k, 3823.2% for AGIs $25k-50k, 7064.0% for AGIs $50k-75k, 10734.0% for AGIs $75k-100k, 21290.8% for AGIs $100k-200k, 72225.8% for AGIs over 200k)
Taxable interest for individuals: $1,284 (reported on 25.3% of returns)
This zip code:
$1,284
Tennessee:
$1,945
(% of AGI for various income ranges: 6.0% for AGIs below $25k, 7.9% for AGIs $25k-50k, 20.1% for AGIs $50k-75k, 27.1% for AGIs $75k-100k, 67.0% for AGIs $100k-200k, 814.7% for AGIs over 200k)
Ordinary dividends: $4,021 (reported on 20.8% of returns)
Here:
$4,021
State:
$8,105
(% of AGI for various income ranges: 17.1% for AGIs below $25k, 28.8% for AGIs $25k-50k, 68.5% for AGIs $50k-75k, 90.8% for AGIs $75k-100k, 268.4% for AGIs $100k-200k, 1606.1% for AGIs over 200k)
Net capital gain/loss in AGI: +$25,593 (reported on 20.2% of returns)
Here:
+$25,593
State:
+$33,664
(% of AGI for various income ranges: 11.1% for AGIs below $25k, 31.4% for AGIs $25k-50k, 88.7% for AGIs $50k-75k, 197.0% for AGIs $75k-100k, 665.5% for AGIs $100k-200k, 17244.5% for AGIs over 200k)
Profit/loss from business: +$24,455 (reported on 24.3% of returns)
Here:
+$24,455
State:
+$18,991
(% of AGI for various income ranges: 194.3% for AGIs below $25k, 307.6% for AGIs $25k-50k, 433.2% for AGIs $50k-75k, 780.1% for AGIs $75k-100k, 1555.5% for AGIs $100k-200k, 10935.3% for AGIs over 200k)
Taxable individual retirement arrangement distribution: $16,956 (reported on 3.9% of returns)
37206:
$16,956
Tennessee:
$20,036
(% of AGI for various income ranges: 18.2% for AGIs below $25k, 31.0% for AGIs $25k-50k, 89.7% for AGIs $50k-75k, 170.4% for AGIs $75k-100k, 239.3% for AGIs $100k-200k, 742.6% for AGIs over 200k)
Self-employed (Keogh) retirement plans: $27,074 (reported on 1.3% of returns)
37206:
$27,074
Tennessee:
$28,955
(% of AGI for various income ranges: 25.6% for AGIs $50k-75k, 61.8% for AGIs $100k-200k, 1051.8% for AGIs over 200k)
Total itemized deductions: $28,743 (reported on 10.2% of returns)
Here:
$28,743
State:
$40,136
(% of AGI for various income ranges: 38.3% for AGIs below $25k, 121.3% for AGIs $25k-50k, 204.6% for AGIs $50k-75k, 497.3% for AGIs $75k-100k, 1009.6% for AGIs $100k-200k, 5285.0% for AGIs over 200k)
Charity contributions: $9,025 (reported on 7.8% of returns)
Here:
$9,025
State:
$19,852
(% of AGI for various income ranges: 3.1% for AGIs below $25k, 14.4% for AGIs $25k-50k, 24.4% for AGIs $50k-75k, 77.3% for AGIs $75k-100k, 174.8% for AGIs $100k-200k, 1825.0% for AGIs over 200k)
Taxes paid: $6,378 (reported on 9.9% of returns)
37206:
$6,378
State:
$6,038
(% of AGI for various income ranges: 7.4% for AGIs below $25k, 21.6% for AGIs $25k-50k, 47.1% for AGIs $50k-75k, 112.7% for AGIs $75k-100k, 253.8% for AGIs $100k-200k, 1033.9% for AGIs over 200k)
Earned income credit: $2,226 (reported on 16.9% of returns)
Here:
$2,226
State:
$2,391
(% of AGI for various income ranges: 119.3% for AGIs below $25k, 43.1% for AGIs $25k-50k)
Percentage of individuals using paid preparers for their 2020 taxes: 93.7%
Here:
94%
State:
93%
(% for various income ranges: 92.5% for AGIs below $25k, 93.7% for AGIs $25k-50k, 93.9% for AGIs $50k-75k, 93.9% for AGIs $75k-100k, 95.0% for AGIs $100k-200k, 95.6% for AGIs over 200k)
Averages for the 2012 tax year for zip code 37206, filed in 2013:
Average Adjusted Gross Income (AGI) in 2012: $43,401 (Individual Income Tax Returns)
Here:
$43,401
State:
$53,767
Salary/wage: $38,940 (reported on 88.7% of returns)
Here:
$38,940
State:
$45,421
(% of AGI for various income ranges: 80.8% for AGIs below $25k, 88.1% for AGIs $25k-50k, 86.1% for AGIs $50k-75k, 85.6% for AGIs $75k-100k, 84.1% for AGIs $100k-200k, 49.4% for AGIs over 200k)
Taxable interest for individuals: $840 (reported on 18.5% of returns)
This zip code:
$840
Tennessee:
$1,732
(% of AGI for various income ranges: 0.3% for AGIs below $25k, 0.3% for AGIs $25k-50k, 0.4% for AGIs $50k-75k, 0.4% for AGIs $75k-100k, 0.3% for AGIs $100k-200k, 0.6% for AGIs over 200k)
Ordinary dividends: $2,458 (reported on 11.7% of returns)
Here:
$2,458
State:
$6,739
(% of AGI for various income ranges: 1.0% for AGIs below $25k, 0.6% for AGIs $25k-50k, 0.5% for AGIs $50k-75k, 0.8% for AGIs $75k-100k, 0.6% for AGIs $100k-200k, 0.6% for AGIs over 200k)
Net capital gain/loss in AGI: +$5,293 (reported on 8.5% of returns)
Here:
+$5,293
State:
+$19,082
(% of AGI for various income ranges: 0.2% for AGIs $25k-50k, 0.6% for AGIs $50k-75k, 0.6% for AGIs $75k-100k, 1.1% for AGIs $100k-200k, 3.9% for AGIs over 200k)
Profit/loss from business: +$13,340 (reported on 20.5% of returns)
Here:
+$13,340
State:
+$15,240
(% of AGI for various income ranges: 10.6% for AGIs below $25k, 4.7% for AGIs $25k-50k, 4.9% for AGIs $50k-75k, 5.2% for AGIs $75k-100k, 6.4% for AGIs $100k-200k, 6.6% for AGIs over 200k)
Taxable individual retirement arrangement distribution: $9,792 (reported on 3.8% of returns)
37206:
$9,792
Tennessee:
$15,505
(% of AGI for various income ranges: 1.1% for AGIs below $25k, 0.8% for AGIs $25k-50k, 1.1% for AGIs $50k-75k, 1.0% for AGIs $75k-100k, 1.1% for AGIs $100k-200k)
Self-employment retirement plans: $15,567 (reported on 0.5% of returns)
37206:
$15,567
Tennessee:
$22,567
Total itemized deductions: $16,386 (17% of AGI, reported on 22.3% of returns)
Here:
$16,386
State:
$21,976
Here:
17.1% of AGI
State:
17.8% of AGI
(% of AGI for various income ranges: 5.2% for AGIs below $25k, 7.4% for AGIs $25k-50k, 10.5% for AGIs $50k-75k, 10.4% for AGIs $75k-100k, 11.5% for AGIs $100k-200k, 5.1% for AGIs over 200k)
Charity contributions: $3,169 (reported on 16.7% of returns)
Here:
$3,169
State:
$6,709
(% of AGI for various income ranges: 0.5% for AGIs below $25k, 0.9% for AGIs $25k-50k, 1.3% for AGIs $50k-75k, 1.6% for AGIs $75k-100k, 1.8% for AGIs $100k-200k, 1.0% for AGIs over 200k)
Taxes paid: $4,081 (reported on 21.8% of returns)
37206:
$4,081
State:
$4,829
(% of AGI for various income ranges: 0.9% for AGIs below $25k, 1.6% for AGIs $25k-50k, 2.4% for AGIs $50k-75k, 2.6% for AGIs $75k-100k, 3.2% for AGIs $100k-200k, 1.6% for AGIs over 200k)
Earned income credit: $2,257 (reported on 26.5% of returns)
Here:
$2,257
State:
$2,404
(% of AGI for various income ranges: 8.5% for AGIs below $25k, 0.8% for AGIs $25k-50k)
Percentage of individuals using paid preparers for their 2012 taxes: 40.9%
Here:
41%
State:
52%
(% for various income ranges: 41.2% for AGIs below $25k, 35.3% for AGIs $25k-50k, 43.3% for AGIs $50k-75k, 42.3% for AGIs $75k-100k, 50.0% for AGIs $100k-200k, 66.7% for AGIs over 200k)
Averages for the 2004 tax year for zip code 37206, filed in 2005:
Average Adjusted Gross Income (AGI) in 2004: $28,721 (Individual Income Tax Returns)
Here:
$28,721
State:
$44,088
Salary/wage: $27,634 (reported on 90.5% of returns)
Here:
$27,634
State:
$38,825
(% of AGI for various income ranges: 99.5% for AGIs below $10k, 87.4% for AGIs $10k-25k, 91.0% for AGIs $25k-50k, 87.3% for AGIs $50k-75k, 86.9% for AGIs $75k-100k, 73.3% for AGIs over 100k)
Taxable interest for individuals: $928 (reported on 21.1% of returns)
This zip code:
$928
Tennessee:
$1,802
(% of AGI for various income ranges: 1.2% for AGIs below $10k, 0.7% for AGIs $10k-25k, 0.5% for AGIs $25k-50k, 0.5% for AGIs $50k-75k, 0.4% for AGIs $75k-100k, 1.4% for AGIs over 100k)
Taxable dividends: $1,176 (reported on 9.5% of returns)
Here:
$1,176
State:
$3,727
(% of AGI for various income ranges: 0.6% for AGIs below $10k, 0.2% for AGIs $10k-25k, 0.3% for AGIs $25k-50k, 0.4% for AGIs $50k-75k, 0.5% for AGIs $75k-100k, 0.5% for AGIs over 100k)
Net capital gain/loss: +$6,755 (reported on 7.0% of returns)
Here:
+$6,755
State:
+$15,776
(% of AGI for various income ranges: -0.8% for AGIs below $10k, 0.3% for AGIs $10k-25k, 0.3% for AGIs $25k-50k, 0.9% for AGIs $50k-75k, 1.6% for AGIs $75k-100k, 8.6% for AGIs over 100k)
Profit/loss from business: +$8,667 (reported on 13.6% of returns)
Here:
+$8,667
State:
+$12,882
(% of AGI for various income ranges: 11.4% for AGIs below $10k, 4.3% for AGIs $10k-25k, 2.8% for AGIs $25k-50k, 3.4% for AGIs $50k-75k, 3.8% for AGIs $75k-100k, 6.2% for AGIs over 100k)
IRA payment deduction: $2,236 (reported on 1.4% of returns)
37206:
$2,236
Tennessee:
$2,934
(% of AGI for various income ranges: 0.1% for AGIs $10k-25k, 0.1% for AGIs $25k-50k, 0.1% for AGIs $50k-75k, 0.1% for AGIs $75k-100k, 0.1% for AGIs over 100k)
Self-employed pension: $11,235 (reported on 0.4% of returns)
Here:
$11,235
Tennessee:
$16,857
(% of AGI for various income ranges: 0.2% for AGIs $10k-25k, 0.3% for AGIs $50k-75k, 0.7% for AGIs over 100k)
Total itemized deductions: $13,025 (23% of AGI, reported on 20.6% of returns)
Here:
$13,025
State:
$18,035
Here:
23.4% of AGI
State:
19.9% of AGI
(% of AGI for various income ranges: 5.2% for AGIs below $10k, 5.0% for AGIs $10k-25k, 9.7% for AGIs $25k-50k, 12.0% for AGIs $50k-75k, 11.4% for AGIs $75k-100k, 10.6% for AGIs over 100k)
Charity contributions deductions: $2,689 (5% of AGI, reported on 16.8% of returns)
Here:
$2,689
State:
$5,167
Here:
4.6% of AGI
State:
5.3% of AGI
(% of AGI for various income ranges: 0.4% for AGIs below $10k, 0.7% for AGIs $10k-25k, 1.4% for AGIs $25k-50k, 2.0% for AGIs $50k-75k, 2.2% for AGIs $75k-100k, 2.4% for AGIs over 100k)
Total tax: $4,118 (reported on 63.7% of returns)
37206:
$4,118
State:
$7,482
(% of AGI for various income ranges: 2.6% for AGIs below $10k, 3.5% for AGIs $10k-25k, 7.5% for AGIs $25k-50k, 10.9% for AGIs $50k-75k, 12.6% for AGIs $75k-100k, 17.7% for AGIs over 100k)
Earned income credit: $1,857 (reported on 32.9% of returns)
Here:
$1,857
State:
$1,826
Percentage of individuals using paid preparers for their 2004 taxes: 58.7%
Here:
59%
State:
60%
(% for various income ranges: 61.6% for AGIs below $10k, 64.1% for AGIs $10k-25k, 52.5% for AGIs $25k-50k, 52.1% for AGIs $50k-75k, 53.2% for AGIs $75k-100k, 55.8% for AGIs over 100k)
Likely homosexual households (counted as self-reported same-sex unmarried-partner households)
Lesbian couples: 0.5% of all households
Gay men: 0.7% of all households
Household received Food Stamps/SNAP in the past 12 months: 1,291 Household did not receive Food Stamps/SNAP in the past 12 months: 12,212
Women who had a birth in the past 12 months: 659 (424 now married, 233 unmarried) Women who did not have a birth in the past 12 months: 8,307 (2,857 now married, 5,448 unmarried)
Housing units in zip code 37206 with a mortgage: 5,342 (781 second mortgage, 54 home equity loan, 652 both second mortgage and home equity loan) Houses without a mortgage: 57
Median monthly owner costs for units with a mortgage: $2,123 Median monthly owner costs for units without a mortgage: $580
Residents with income below the poverty level in 2022:
This zip code:
18.1%
Whole state:
13.3%
Residents with income below 50% of the poverty level in 2022:
This zip code:
7.1%
Whole state:
7.1%
Median number of rooms in houses and condos:
Here:
6.1
State:
6.5
Median number of rooms in apartments:
Here:
4.0
State:
4.4
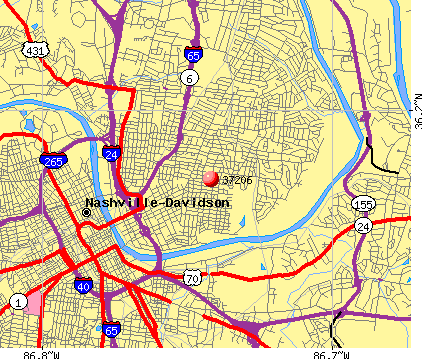
Notable locations in this zip code not listed on our city pages
Notable locations in zip code 37206: Home of the Aged (A), Riverview Golf Course (B), First Baptist Church of East Nashville Day Care Center (C), Davidson County Fire Department (D), Woodcock Baptist Center (E), Nashville Fire Department Station 14 (F), Nashville Fire Department Station 18 (G), Shelby Park Community Center (H), Nashville Rehabilitation Hospital (I), East Park Community Center (J), Madison Branch Nashville and Davidson Public Library (K). Display/hide their locations on the map
Churches in zip code 37206 include: Rosebank Church (A), Home Mission Holiness Church (B), Gospel Truth Missionary Baptist Church (C), Dalebrook Lane Church of Christ (D), Valley View Church (E), The Village Church (F), New Destiny Christian Fellowship Church (G), New Canaan Missionary Baptist Church (H), Loaves and Fishes Church (I). Display/hide their locations on the map
Parks in zip code 37206 include: Shelby Park Access Area (1), East Park (2), Shelby Park (3), Douglas Park (4), Kirkpatrick Park (5). Display/hide their locations on the map
2,629 married couples with children.
2,864 single-parent households (262 men, 2,602 women).
93.2% of residents of 37206 zip code speak English at home.
2.7% of residents speak Spanish at home (49% very well, 29% well, 17% not well, 6% not at all).
1.4% of residents speak other Indo-European language at home (96% very well, 4% well).
1.5% of residents speak Asian or Pacific Island language at home (63% very well, 37% well).
0.7% of residents speak other language at home (78% very well, 9% well, 13% not at all).
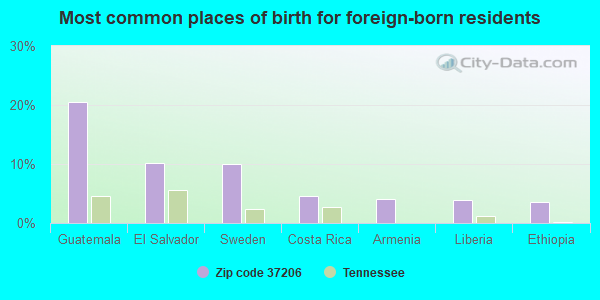
Foreign born population: 1,492 (5.0%) (47.0% of them are naturalized citizens)
This zip code:
5.0%
Whole state:
5.6%
20%Guatemala
10%El Salvador
10%Sweden
5%Costa Rica
4%Armenia
4%Liberia
3%Ethiopia
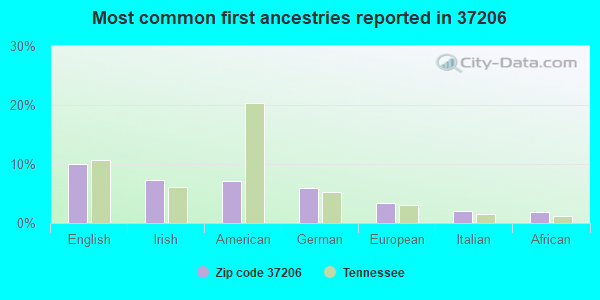
10%English
7%Irish
7%American
6%German
3%European
2%Italian
2%African
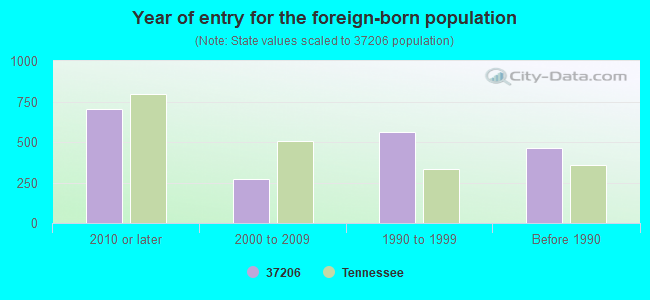
Year of entry for the foreign-born population
7032010 or later
2732000 to 2009
5621990 to 1999
460Before 1990
Facilities with environmental interests located in this zip code:
CORA HOWE ELEMENTARY SCHOOL (1928 E GREENWOOD AV in NASHVILLE, TN)
(Geographic Names Information System) (National Center for Education Statistics) - STATE ID-0135 Organizations: NASHVILLE-DAVIDSON COUNTY SD (SCHOOL DISTRICT)
BAILEY MIDDLE SCHOOL (2000 GREENWOOD AV in NASHVILLE, TN)
(National Center for Education Statistics) - STATE ID-0030 Organizations: NASHVILLE-DAVIDSON COUNTY SD (SCHOOL DISTRICT)
COTTON ELEMENTARY SCHOOL (1033 W GREEWOOD AV in NASHVILLE, TN)
(National Center for Education Statistics) - STATE ID-0140 Organizations: NASHVILLE-DAVIDSON COUNTY SD (SCHOOL DISTRICT)
DSS PRO DIESEL INC (927 WOODLAND STREET in NASHVILLE, TN)
(Resource Conservation and Recovery Act (tracking hazardous waste)) Business NAICS classification: OTHER AUTOMOTIVE MECHANICAL AND ELECTRICAL REPAIR AND MAINTENANCE. Organizations: RICHARD THARP (CONTACT/OPERATOR)
, TRANS COM USA (CONTACT/OWNER)
, DSS PRO DIESEL PARTNERS LLC (CONTACT/OWNER)
DSS/PRO DIESEL PARTNERS LLC (928 MAIN ST in NASHVILLE, TN)
Conditionally Exempt Small Quantity Generators, less than 100 kg/month of hazardous waste (Resource Conservation and Recovery Act (tracking hazardous waste)) Business NAICS classification: OTHER ENGINE EQUIPMENT MANUFACTURING. Organizations: RICK THARP (CONTACT/OPERATOR)
, TRANSCOM USA (CONTACT/OWNER)
, DSS PRODIESEL PARTNERS LLC (CONTACT/OWNER)
AAA SERVICES (207 SOUTH 12TH ST in NASHVILLE, TN)
(Resource Conservation and Recovery Act (tracking hazardous waste))
B&B SILK SCREEN PRINTING CO (917 WOODLAND ST in NASHVILLE, TN)
(Resource Conservation and Recovery Act (tracking hazardous waste))
CAPITOL CITY MATTRESS COMPANY (900 MAIN STREET in NASHVILLE, TN)
(Resource Conservation and Recovery Act (tracking hazardous waste))
CAPRICE RECORDS (907 MAIN ST in NASHVILLE, TN)
(Resource Conservation and Recovery Act (tracking hazardous waste))
COLD SPRINGS INC. (220 OLD HICKORY BLVD. in E., TN)
(Resource Conservation and Recovery Act (tracking hazardous waste))
COLEMILL ENTERPRISES INC (CORNELIA FORT AIRPORT in NASHVILLE, TN)
(Resource Conservation and Recovery Act (tracking hazardous waste))
DEAN & BARRY (501 WOODLAND STREET in NASHVILLE, TN)
(Resource Conservation and Recovery Act (tracking hazardous waste))
COX BODY SHOP (970 WOODLAND ST. in NASHVILLE, TN)
Conditionally Exempt Small Quantity Generators, less than 100 kg/month of hazardous waste (Resource Conservation and Recovery Act (tracking hazardous waste)) - notification Business NAICS classification: AUTOMOTIVE BODY, PAINT, AND INTERIOR REPAIR AND MAINTENANCE.
Housing units lacking complete plumbing facilities: 0.5% Housing units lacking complete kitchen facilities: 1.2%
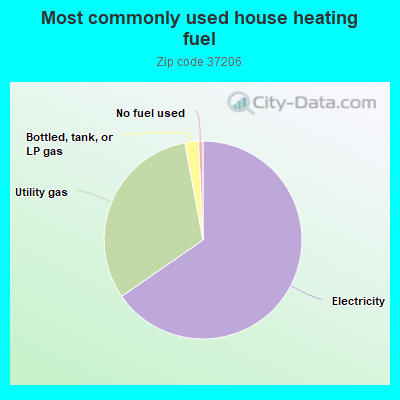
65.1%Electricity
31.6%Utility gas
2.2%Bottled, tank, or LP gas
0.7%No fuel used
Population in 1990: 28,446.
Place of birth for U.S.-born residents:
This state: 13,448
Northeast: 2,640
Midwest: 4,287
South: 6,179
West: 1,522
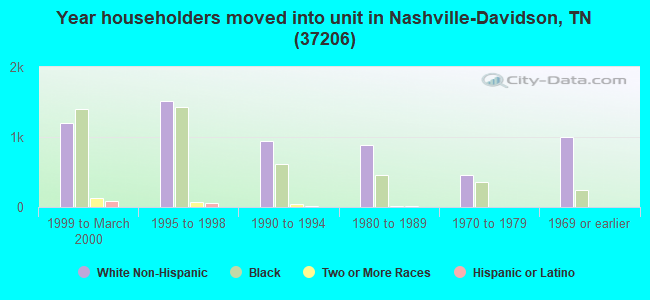
50% of the 37206 zip code residents lived in the same house 5 years ago. Out of people who lived in different houses, 73% lived in this county. Out of people who lived in different counties, 50% lived in Tennessee.
81% of the 37206 zip code residents lived in the same house 1 year ago. Out of people who lived in different houses, 58% moved from this county. Out of people who lived in different houses, 9% moved from different county within same state. Out of people who lived in different houses, 26% moved from different state. Out of people who lived in different houses, 2% moved from abroad.
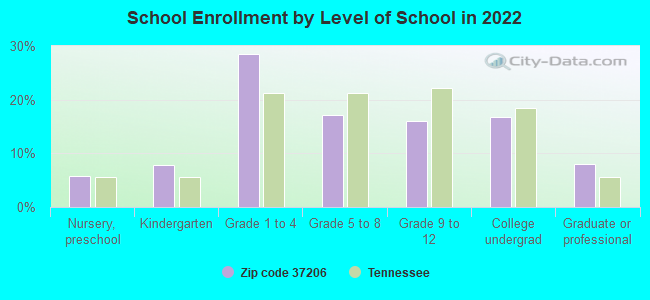
Private vs. public school enrollment:
Students in private schools in grades 1 to 8 (elementary and middle school): 548
Here:
19.5%
Tennessee:
15.0%
Students in private schools in grades 9 to 12 (high school): 61
Here:
6.4%
Tennessee:
16.2%
Students in private undergraduate colleges: 320
Here:
31.6%
Tennessee:
23.5%
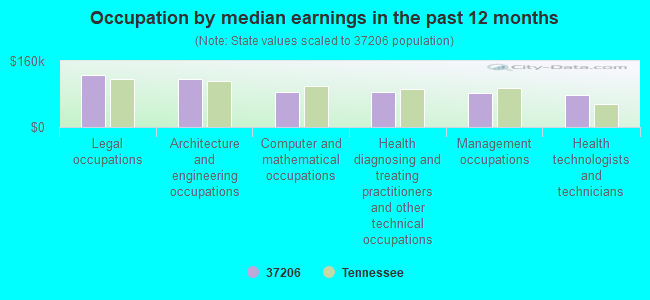
Occupation by median earnings in the past 12 months ($)
126,492Legal occupations
115,176Architecture and engineering occupations
84,058Computer and mathematical occupations
83,832Health diagnosing and treating practitioners and other technical occupations
81,353Management occupations
77,986Health technologists and technicians
Companies with federal contracts located in this zip code (NASHVILLE, TN):
T G INCORPORATED (615 MAIN STREET; small business) : $5,094,126 in 30 contractsfrom 2001 to 2006
Contracts for Construction of Structures and Facilities -- Other Conservation and Development Facilities, Earth Moving and Excavating Equipment by U.S. Army Corps of Engineers - civil program financing only, Army, National Park Service Signed by year:2000: $0; 2001: $287,000; 2002: $247,316; 2003: $2,602,088; 2004: $1,806,138; 2005: $118,000; 2006: $33,584.
Biggest contracts:
$890,000 with U.S. Army Corps of Engineers - civil program financing only for Construction of Structures and Facilities -- Other Conservation and Development Facilities. Taking place in KY. Signed on 2003-05-27. Completion date: 2003-09-30.
$350,000, same as above.Signed on 2003-05-08. Completion date: 2003-09-30.
$300,000 with Army for Construction of Structures and Facilities -- Other Conservation and Development Facilities. Taking place in KY. Signed on 2003-10-22. Completion date: 2003-09-30.
$300,000 with U.S. Army Corps of Engineers - civil program financing only for Construction of Structures and Facilities -- Other Conservation and Development Facilities. Taking place in KY. Signed on 2003-10-22. Completion date: 2003-09-30.
RAGAN-SMITH ASSOCIATES INC (315 WOODLAND ST) : $106,581 in 8 contractsfrom 1999 to 2001
Contracts for Architect - Engineer Services (including landscaping, interior layout, and designing) by U.S. Army Corps of Engineers - civil program financing only Signed by year:2000: $9,248; 2001: $56,894; 2002: $0; 2003: $0; 2004: $0; 2005: $0; 2006: $0.
Biggest contracts:
$40,439 with U.S. Army Corps of Engineers - civil program financing only for Architect - Engineer Services (including landscaping, interior layout, and designing). Signed on 1999-11-03. Completion date: 2000-01-15.
$35,054 with U.S. Army Corps of Engineers - civil program financing only for Architect - Engineer Services (including landscaping, interior layout, and designing). Taking place in AL. Signed on 2001-05-17. Completion date: 2001-06-20.
$11,880 with U.S. Army Corps of Engineers - civil program financing only for Architect - Engineer Services (including landscaping, interior layout, and designing). Signed on 2001-06-19. Completion date: 2001-07-09.
$7,108, same as above.Signed on 2000-11-06. Completion date: 2000-11-30.
PRODIESEL, INC (922 MAIN ST; small business)
$88,000 with Defense Logistics Agency for Diesel Engines and Components. Signed on 2000-12-07. Completion date: 2000-12-26.
TENNESSEE VISUAL EDUCATION SER (1001 WOODLAND ST; small business)
$35,275 with Army for Audio/Visual Services. Signed on 2001-09-27. Completion date: 2001-09-25.
COLLISION PLUS LLC (952 MAIN ST; small business)
$5,419 with Army for Compressors and Vacuum Pumps. Signed on 2005-05-20. Completion date: 2005-06-02.
TENNESSEE VISUAL SERVICE CO , (1001 WOODLAND STREET; small business)
$4,441 with Army for ADP Components. Taking place in KY. Signed on 2004-06-29. Completion date: 2004-07-15.
Top industries in this zip code by the number of employees in 2005:
2003 - 2018 National Fire Incident Reporting System (NFIRS) incidents
Based on the data from the years 2003 - 2018 the average number of fires per year is 112. The highest number of reported fires - 227 took place in 2006, and the least - 55 in 2012. The data has an increasing trend.
When looking into fire subcategories, the most incidents belonged to: Outside Fires (57.8%), and Structure Fires (23.2%).
Fire incident types reported to NFIRS in Zip Code 37206


 Nearest zip codes: 37210, 37216, 37213, 37201, 37243, 37219.


 Based on the data from the years 2003 - 2018 the average number of fires per year is 112. The highest number of reported fires - 227 took place in 2006, and the least - 55 in 2012. The data has an increasing trend.
 When looking into fire subcategories, the most incidents belonged to: Outside Fires (57.8%), and Structure Fires (23.2%).