Estimated zip code population in 2022: 21,141 Zip code population in 2010: 20,148 Zip code population in 2000: 18,547
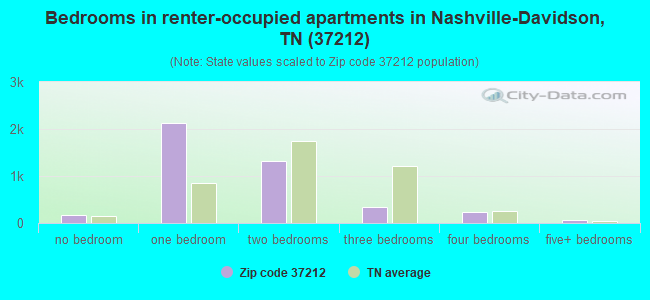
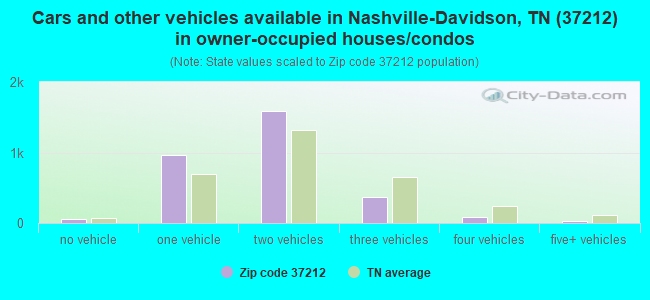
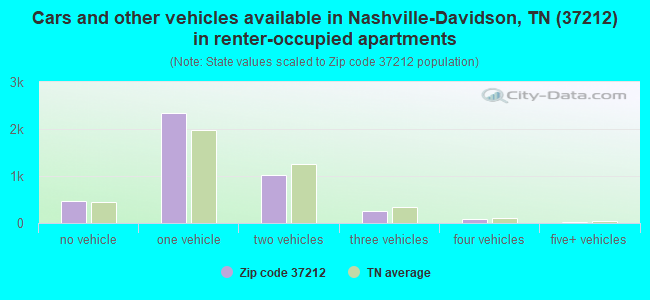
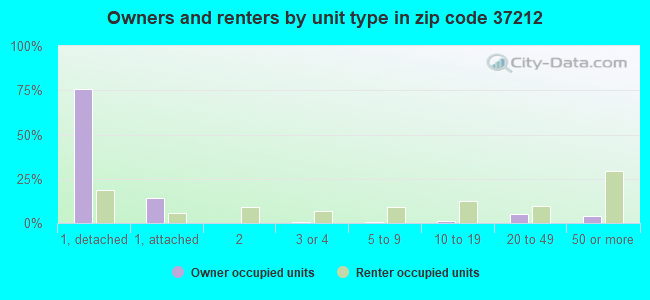
Houses and condos: 8,570 Renter-occupied apartments: 4,180
% of renters here:
58%
State:
33%
March 2022 cost of living index in zip code 37212: 97.2 (near average, U.S. average is 100)
Land area: 2.8 sq. mi. Water area: 0.0 sq. mi.
Population density: 7,622 people per square mile
(high).
OSM Map
General Map
Google Map
MSN Map
OSM Map
General Map
Google Map
MSN Map
OSM Map
General Map
Google Map
MSN Map
OSM Map
General Map
Google Map
MSN Map
Please wait while loading the map...
Real estate property taxes paid for housing units in 2022:
This zip code:
0.6% ($6,018)
Tennessee:
0.5% ($1,376)
Median real estate property taxes paid for housing units with mortgages in 2022: $6,042 (0.5%) Median real estate property taxes paid for housing units with no mortgage in 2022: $6,008 (0.7%)
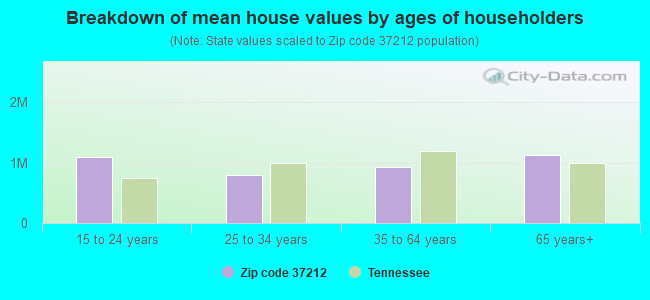
Estimated median house/condo value in 2022: $1,026,433
37212:
$1,026,433
Tennessee:
$284,800
According to our research of Tennessee and other state lists, there were 2 registered sex offenders living in 37212 zip code as of April 26, 2024. The ratio of all residents to sex offenders in zip code 37212 is 10,469 to 1. The ratio of registered sex offenders to all residents in this zip code is much lower than the state average.
Median resident age:
This zip code:
25.1 years
Tennessee median age:
39.2 years
Average household size:
This zip code:
1.9 people
Tennessee:
2.4 people
Averages for the 2020 tax year for zip code 37212, filed in 2021:
Average Adjusted Gross Income (AGI) in 2020: $185,479 (Individual Income Tax Returns)
Here:
$185,479
State:
$69,014
Salary/wage: $122,148 (reported on 82.0% of returns)
Here:
$122,148
State:
$55,872
(% of AGI for various income ranges: 1169.5% for AGIs below $25k, 4009.3% for AGIs $25k-50k, 7175.9% for AGIs $50k-75k, 11138.2% for AGIs $75k-100k, 20565.3% for AGIs $100k-200k, 152840.3% for AGIs over 200k)
Taxable interest for individuals: $3,892 (reported on 40.6% of returns)
This zip code:
$3,892
Tennessee:
$1,945
(% of AGI for various income ranges: 13.4% for AGIs below $25k, 24.6% for AGIs $25k-50k, 48.4% for AGIs $50k-75k, 87.1% for AGIs $75k-100k, 198.1% for AGIs $100k-200k, 2966.1% for AGIs over 200k)
Ordinary dividends: $15,383 (reported on 37.1% of returns)
Here:
$15,383
State:
$8,105
(% of AGI for various income ranges: 56.9% for AGIs below $25k, 89.6% for AGIs $25k-50k, 145.8% for AGIs $50k-75k, 365.4% for AGIs $75k-100k, 1064.2% for AGIs $100k-200k, 10182.6% for AGIs over 200k)
Net capital gain/loss in AGI: +$81,681 (reported on 34.9% of returns)
Here:
+$81,681
State:
+$33,664
(% of AGI for various income ranges: 45.0% for AGIs below $25k, 124.2% for AGIs $25k-50k, 191.4% for AGIs $50k-75k, 530.4% for AGIs $75k-100k, 1449.5% for AGIs $100k-200k, 60764.5% for AGIs over 200k)
Profit/loss from business: +$66,345 (reported on 28.3% of returns)
Here:
+$66,345
State:
+$18,991
(% of AGI for various income ranges: 231.6% for AGIs below $25k, 373.2% for AGIs $25k-50k, 484.5% for AGIs $50k-75k, 1292.1% for AGIs $75k-100k, 2817.2% for AGIs $100k-200k, 33979.0% for AGIs over 200k)
Taxable individual retirement arrangement distribution: $40,206 (reported on 7.0% of returns)
37212:
$40,206
Tennessee:
$20,036
(% of AGI for various income ranges: 39.8% for AGIs below $25k, 44.6% for AGIs $25k-50k, 149.1% for AGIs $50k-75k, 380.7% for AGIs $75k-100k, 933.3% for AGIs $100k-200k, 4081.9% for AGIs over 200k)
Self-employed (Keogh) retirement plans: $31,667 (reported on 4.3% of returns)
37212:
$31,667
Tennessee:
$28,955
(% of AGI for various income ranges: 28.6% for AGIs $25k-50k, 241.6% for AGIs $100k-200k, 2624.2% for AGIs over 200k)
Total itemized deductions: $47,178 (reported on 17.2% of returns)
Here:
$47,178
State:
$40,136
(% of AGI for various income ranges: 63.7% for AGIs below $25k, 114.2% for AGIs $25k-50k, 325.0% for AGIs $50k-75k, 559.6% for AGIs $75k-100k, 1861.2% for AGIs $100k-200k, 13823.2% for AGIs over 200k)
Charity contributions: $22,830 (reported on 15.0% of returns)
Here:
$22,830
State:
$19,852
(% of AGI for various income ranges: 5.7% for AGIs below $25k, 18.0% for AGIs $25k-50k, 68.3% for AGIs $50k-75k, 105.7% for AGIs $75k-100k, 433.7% for AGIs $100k-200k, 6805.5% for AGIs over 200k)
Taxes paid: $8,191 (reported on 16.9% of returns)
37212:
$8,191
State:
$6,038
(% of AGI for various income ranges: 11.8% for AGIs below $25k, 21.5% for AGIs $25k-50k, 67.3% for AGIs $50k-75k, 173.9% for AGIs $75k-100k, 443.3% for AGIs $100k-200k, 2079.4% for AGIs over 200k)
Earned income credit: $1,331 (reported on 7.7% of returns)
Here:
$1,331
State:
$2,391
(% of AGI for various income ranges: 45.1% for AGIs below $25k, 12.8% for AGIs $25k-50k)
Percentage of individuals using paid preparers for their 2020 taxes: 92.6%
Here:
93%
State:
93%
(% for various income ranges: 89.8% for AGIs below $25k, 93.0% for AGIs $25k-50k, 92.6% for AGIs $50k-75k, 92.0% for AGIs $75k-100k, 93.5% for AGIs $100k-200k, 95.7% for AGIs over 200k)
Averages for the 2012 tax year for zip code 37212, filed in 2013:
Average Adjusted Gross Income (AGI) in 2012: $93,682 (Individual Income Tax Returns)
Here:
$93,682
State:
$53,767
Salary/wage: $73,746 (reported on 84.7% of returns)
Here:
$73,746
State:
$45,421
(% of AGI for various income ranges: 78.6% for AGIs below $25k, 84.6% for AGIs $25k-50k, 81.1% for AGIs $50k-75k, 77.3% for AGIs $75k-100k, 72.8% for AGIs $100k-200k, 57.3% for AGIs over 200k)
Taxable interest for individuals: $2,184 (reported on 37.6% of returns)
This zip code:
$2,184
Tennessee:
$1,732
(% of AGI for various income ranges: 1.5% for AGIs below $25k, 1.5% for AGIs $25k-50k, 0.5% for AGIs $50k-75k, 1.0% for AGIs $75k-100k, 0.8% for AGIs $100k-200k, 0.8% for AGIs over 200k)
Ordinary dividends: $10,781 (reported on 29.7% of returns)
Here:
$10,781
State:
$6,739
(% of AGI for various income ranges: 3.1% for AGIs below $25k, 1.3% for AGIs $25k-50k, 1.8% for AGIs $50k-75k, 1.6% for AGIs $75k-100k, 2.5% for AGIs $100k-200k, 4.5% for AGIs over 200k)
Net capital gain/loss in AGI: +$23,920 (reported on 25.9% of returns)
Here:
+$23,920
State:
+$19,082
(% of AGI for various income ranges: 0.3% for AGIs below $25k, 0.5% for AGIs $25k-50k, 0.7% for AGIs $50k-75k, 1.9% for AGIs $75k-100k, 2.7% for AGIs $100k-200k, 10.8% for AGIs over 200k)
Profit/loss from business: +$40,175 (reported on 24.9% of returns)
Here:
+$40,175
State:
+$15,240
(% of AGI for various income ranges: 11.3% for AGIs below $25k, 6.6% for AGIs $25k-50k, 7.2% for AGIs $50k-75k, 8.9% for AGIs $75k-100k, 9.8% for AGIs $100k-200k, 12.3% for AGIs over 200k)
Taxable individual retirement arrangement distribution: $21,074 (reported on 6.6% of returns)
37212:
$21,074
Tennessee:
$15,505
(% of AGI for various income ranges: 1.7% for AGIs below $25k, 1.1% for AGIs $25k-50k, 1.9% for AGIs $50k-75k, 1.8% for AGIs $75k-100k, 2.2% for AGIs $100k-200k, 1.2% for AGIs over 200k)
Self-employment retirement plans: $25,595 (reported on 3.0% of returns)
37212:
$25,595
Tennessee:
$22,567
(% of AGI for various income ranges: 0.7% for AGIs $50k-75k, 0.7% for AGIs $100k-200k, 1.2% for AGIs over 200k)
Total itemized deductions: $29,931 (14% of AGI, reported on 32.3% of returns)
Here:
$29,931
State:
$21,976
Here:
14.2% of AGI
State:
17.8% of AGI
(% of AGI for various income ranges: 8.6% for AGIs below $25k, 7.2% for AGIs $25k-50k, 9.8% for AGIs $50k-75k, 11.8% for AGIs $75k-100k, 12.6% for AGIs $100k-200k, 10.2% for AGIs over 200k)
Charity contributions: $8,704 (reported on 27.1% of returns)
Here:
$8,704
State:
$6,709
(% of AGI for various income ranges: 0.6% for AGIs below $25k, 0.7% for AGIs $25k-50k, 1.4% for AGIs $50k-75k, 2.1% for AGIs $75k-100k, 2.1% for AGIs $100k-200k, 3.3% for AGIs over 200k)
Taxes paid: $9,328 (reported on 31.7% of returns)
37212:
$9,328
State:
$4,829
(% of AGI for various income ranges: 2.3% for AGIs below $25k, 1.6% for AGIs $25k-50k, 2.6% for AGIs $50k-75k, 3.5% for AGIs $75k-100k, 3.9% for AGIs $100k-200k, 3.3% for AGIs over 200k)
Earned income credit: $1,354 (reported on 9.9% of returns)
Here:
$1,354
State:
$2,404
(% of AGI for various income ranges: 2.8% for AGIs below $25k, 0.2% for AGIs $25k-50k)
Percentage of individuals using paid preparers for their 2012 taxes: 44.9%
Here:
45%
State:
52%
(% for various income ranges: 36.7% for AGIs below $25k, 35.6% for AGIs $25k-50k, 44.7% for AGIs $50k-75k, 50.0% for AGIs $75k-100k, 60.5% for AGIs $100k-200k, 77.3% for AGIs over 200k)
Averages for the 2004 tax year for zip code 37212, filed in 2005:
Average Adjusted Gross Income (AGI) in 2004: $66,690 (Individual Income Tax Returns)
Here:
$66,690
State:
$44,088
Salary/wage: $57,120 (reported on 83.8% of returns)
Here:
$57,120
State:
$38,825
(% of AGI for various income ranges: 176.3% for AGIs below $10k, 82.0% for AGIs $10k-25k, 85.7% for AGIs $25k-50k, 79.8% for AGIs $50k-75k, 77.6% for AGIs $75k-100k, 64.6% for AGIs over 100k)
Taxable interest for individuals: $2,750 (reported on 40.8% of returns)
This zip code:
$2,750
Tennessee:
$1,802
(% of AGI for various income ranges: 12.6% for AGIs below $10k, 1.2% for AGIs $10k-25k, 1.1% for AGIs $25k-50k, 1.4% for AGIs $50k-75k, 1.1% for AGIs $75k-100k, 1.8% for AGIs over 100k)
Taxable dividends: $5,040 (reported on 28.0% of returns)
Here:
$5,040
State:
$3,727
(% of AGI for various income ranges: 14.2% for AGIs below $10k, 1.1% for AGIs $10k-25k, 1.4% for AGIs $25k-50k, 2.2% for AGIs $50k-75k, 1.1% for AGIs $75k-100k, 2.3% for AGIs over 100k)
Net capital gain/loss: +$22,381 (reported on 23.6% of returns)
Here:
+$22,381
State:
+$15,776
(% of AGI for various income ranges: -5.2% for AGIs below $10k, 0.7% for AGIs $10k-25k, 1.0% for AGIs $25k-50k, 1.6% for AGIs $50k-75k, 3.0% for AGIs $75k-100k, 11.8% for AGIs over 100k)
Profit/loss from business: +$27,038 (reported on 23.8% of returns)
Here:
+$27,038
State:
+$12,882
(% of AGI for various income ranges: -23.2% for AGIs below $10k, 9.0% for AGIs $10k-25k, 5.8% for AGIs $25k-50k, 8.4% for AGIs $50k-75k, 9.0% for AGIs $75k-100k, 11.2% for AGIs over 100k)
IRA payment deduction: $2,586 (reported on 2.6% of returns)
37212:
$2,586
Tennessee:
$2,934
(% of AGI for various income ranges: 0.3% for AGIs $10k-25k, 0.2% for AGIs $25k-50k, 0.1% for AGIs $50k-75k, 0.1% for AGIs $75k-100k, 0.1% for AGIs over 100k)
Self-employed pension: $16,444 (reported on 2.7% of returns)
Here:
$16,444
Tennessee:
$16,857
(% of AGI for various income ranges: 0.2% for AGIs $25k-50k, 0.3% for AGIs $50k-75k, 0.7% for AGIs $75k-100k, 0.9% for AGIs over 100k)
Total itemized deductions: $25,948 (17% of AGI, reported on 29.9% of returns)
Here:
$25,948
State:
$18,035
Here:
17.0% of AGI
State:
19.9% of AGI
(% of AGI for various income ranges: 25.0% for AGIs below $10k, 7.1% for AGIs $10k-25k, 8.6% for AGIs $25k-50k, 14.0% for AGIs $50k-75k, 13.8% for AGIs $75k-100k, 12.0% for AGIs over 100k)
Charity contributions deductions: $6,527 (4% of AGI, reported on 25.5% of returns)
Here:
$6,527
State:
$5,167
Here:
4.3% of AGI
State:
5.3% of AGI
(% of AGI for various income ranges: 1.5% for AGIs below $10k, 0.8% for AGIs $10k-25k, 1.1% for AGIs $25k-50k, 1.9% for AGIs $50k-75k, 2.5% for AGIs $75k-100k, 3.1% for AGIs over 100k)
Total tax: $15,762 (reported on 79.4% of returns)
37212:
$15,762
State:
$7,482
(% of AGI for various income ranges: 7.5% for AGIs below $10k, 6.0% for AGIs $10k-25k, 9.6% for AGIs $25k-50k, 12.4% for AGIs $50k-75k, 13.7% for AGIs $75k-100k, 23.7% for AGIs over 100k)
Earned income credit: $1,111 (reported on 10.6% of returns)
Here:
$1,111
State:
$1,826
Percentage of individuals using paid preparers for their 2004 taxes: 46.1%
Here:
46%
State:
60%
(% for various income ranges: 42.8% for AGIs below $10k, 40.0% for AGIs $10k-25k, 40.3% for AGIs $25k-50k, 48.0% for AGIs $50k-75k, 56.1% for AGIs $75k-100k, 69.3% for AGIs over 100k)
Likely homosexual households (counted as self-reported same-sex unmarried-partner households)
Lesbian couples: 0.3% of all households
Gay men: 0.0% of all households
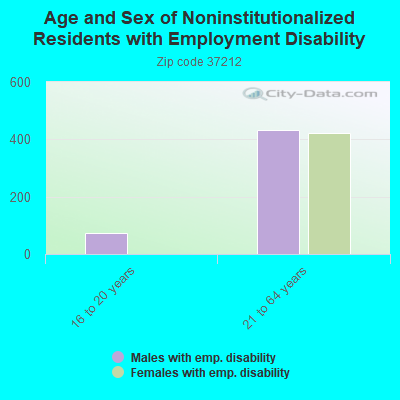
Household received Food Stamps/SNAP in the past 12 months: 81 Household did not receive Food Stamps/SNAP in the past 12 months: 7,237
Women who had a birth in the past 12 months: 66 (67 now married, 0 unmarried) Women who did not have a birth in the past 12 months: 8,824 (1,624 now married, 7,194 unmarried)
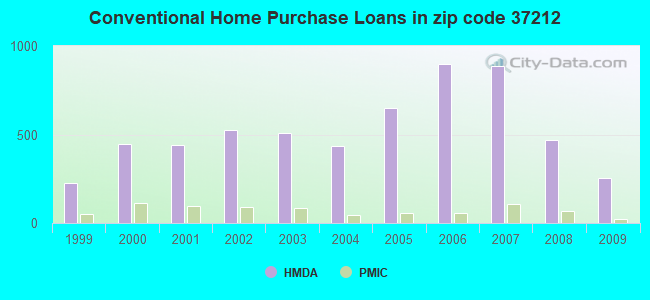
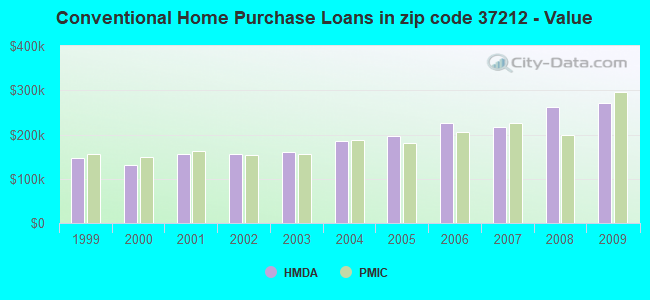
Housing units in zip code 37212 with a mortgage: 1,899 (213 second mortgage, 193 both second mortgage and home equity loan) Houses without a mortgage: 79
Median monthly owner costs for units with a mortgage: $3,157 Median monthly owner costs for units without a mortgage: $913
Residents with income below the poverty level in 2022:
This zip code:
10.2%
Whole state:
13.3%
Residents with income below 50% of the poverty level in 2022:
This zip code:
3.4%
Whole state:
7.1%
Median number of rooms in houses and condos:
Here:
7.6
State:
6.5
Median number of rooms in apartments:
Here:
3.8
State:
4.4
Notable locations in this zip code not listed on our city pages
Notable locations in zip code 37212: Kitty B West Amphitheatre (A), Village at Vanderbilt (B), Davis Tennis Center (C), Euclid Building (D), ELS Language Center (E), E Bronson Ingram Studio Arts Center (F), Dynamo Room (G), Delphi Building (H), Dayani Center (I), Curb Parking Garage (J), Curb Music Buisness Center (K), Curb Event Center (L), Chaffin Place (M), Central Parking Garage (N), Carmichael Towers East (O), Bryan Building (P), Bruin Hills Club House (Q), Bruin Hills (R), Brownlee O Currey Junior Tennis Center (S), Bishop Joseph Johnson Black Cultural Center (T). Display/hide their locations on the map
Churches in zip code 37212 include: Blakemore Church of the Nazarene (A), Blakemore Primitive Baptist Church (B), Hicks Tabernacle Baptist Church (C), Victory Empowerment Center (D), Natchez Trace Church of Christ Hospitality House (E), Disciples Divinity House (F), Church of Scientology Celebrity Centre (G), Saint Johns Eastern Orthodox Church (H), Saint Augustine Chapel (I). Display/hide their locations on the map
Parks in zip code 37212 include: Whitten Field (1), Alumni Lawn (2), Capers Field (3), Curry Field (4), Magnolia Lawn (5), Peabody Esplanade (6), Rob Roy Purdy Field (7), Chapman Quad (8). Display/hide their locations on the map
Tourist attraction (not listed on the city page) : Mayor's Office of Emergency Management (Cultural Attractions- Events- & Facilities; 2060 15th Avenue South).
1,595 married couples with children.
352 single-parent households (64 men, 288 women).
87.4% of residents of 37212 zip code speak English at home.
2.1% of residents speak Spanish at home (67% very well, 26% well, 7% not well).
3.8% of residents speak other Indo-European language at home (81% very well, 19% well).
5.6% of residents speak Asian or Pacific Island language at home (81% very well, 19% well).
0.6% of residents speak other language at home (84% very well, 16% well).
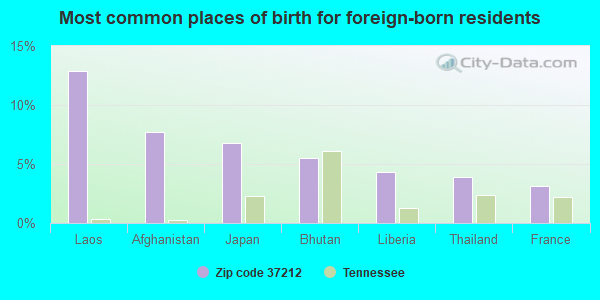
Foreign born population: 2,205 (10.4%) (38.2% of them are naturalized citizens)
This zip code:
10.4%
Whole state:
5.6%
13%Laos
8%Afghanistan
7%Japan
5%Bhutan
4%Liberia
4%Thailand
3%France
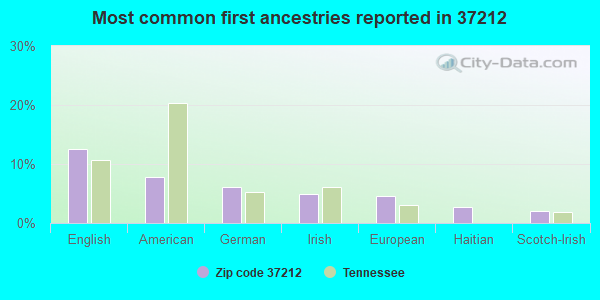
13%English
8%American
6%German
5%Irish
5%European
3%Haitian
2%Scotch-Irish
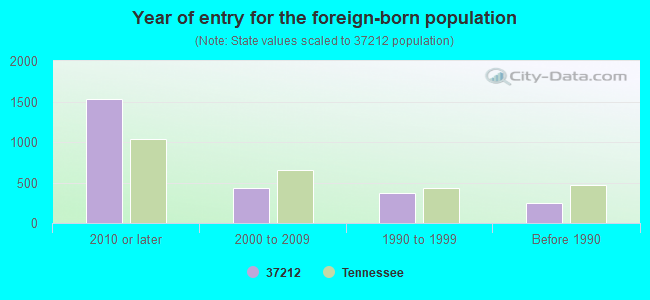
Year of entry for the foreign-born population
1,5342010 or later
4382000 to 2009
3741990 to 1999
250Before 1990
Major facilities with environmental interests located in this zip code:
DANOR INC (1802 GRAND AVENUE in NASHVILLE, TN)
(Resource Conservation and Recovery Act (tracking hazardous waste)) Business NAICS classification: ALL OTHER PUBLISHERS. Alternative names: QUADRAFONIC MUSIC/DANOR INC./RENKIN, INC
A B C RECORDS INC (2409 21ST AVENUE SOUTH in NASHVILLE, TN)
(Resource Conservation and Recovery Act (tracking hazardous waste))
AHAB PRODUCTIONS INC (1701 GRAND AVE in NASHVILLE, TN)
(Resource Conservation and Recovery Act (tracking hazardous waste))
AMERICAN STUDIOS (1111 17TH AVE S in NASHVILLE, TN)
(Resource Conservation and Recovery Act (tracking hazardous waste))
AMOCO OIL SS# 308 (1820-21ST AVE SO in NASHVILLE, TN)
(Resource Conservation and Recovery Act (tracking hazardous waste)) Business NAICS classification: OTHER FUEL DEALERS.
ATLANTIC RECORDING CORP (1201 16TH AVENUE SOUTH in NASHVILLE, TN)
(Resource Conservation and Recovery Act (tracking hazardous waste))
ATV MUSIC CORPORATION (911 17TH AVE S in NASHVILLE, TN)
(Resource Conservation and Recovery Act (tracking hazardous waste)) Business NAICS classification: ALL OTHER PUBLISHERS.
AUDIO MEDIA RECORDERS, INC (PO BOX 120384 in NASHVILLE, TN)
(Resource Conservation and Recovery Act (tracking hazardous waste))
BC MUSIC TYPE (909 18TH AVENUE SOUTH in NASHVILLE, TN)
(Resource Conservation and Recovery Act (tracking hazardous waste)) Business NAICS classification: ALL OTHER PUBLISHERS.
CIRCLE K 8314 (2001 BELMONT BLVD. in NASHVILLE, TN)
(Resource Conservation and Recovery Act (tracking hazardous waste))
CIRCLE T ENTERPRISES INC (50 MUSIC SQUARE WEST in NASHVILLE, TN)
(Resource Conservation and Recovery Act (tracking hazardous waste)) Business NAICS classification: ALL OTHER PUBLISHERS.
DARDEN PRINTING COMPANY (1207 VILLA PL in NASHVILLE, TN)
(Resource Conservation and Recovery Act (tracking hazardous waste))
DEPOT MUSIC INC (1013 16TH AVENUE SOUTH in NASHVILLE, TN)
(Resource Conservation and Recovery Act (tracking hazardous waste)) Business NAICS classification: ALL OTHER PUBLISHERS.
Housing units lacking complete plumbing facilities: 0.4% Housing units lacking complete kitchen facilities: 1.2%
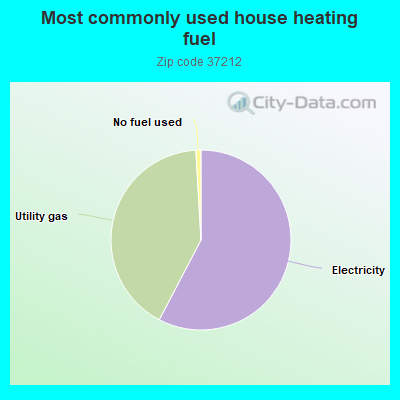
57.5%Electricity
41.3%Utility gas
0.9%No fuel used
Population in 1990: 16,492. Population change in the 1990s: +2,055 (+12.5%).
Place of birth for U.S.-born residents:
This state: 6,265
Northeast: 2,278
Midwest: 3,227
South: 5,813
West: 1,366
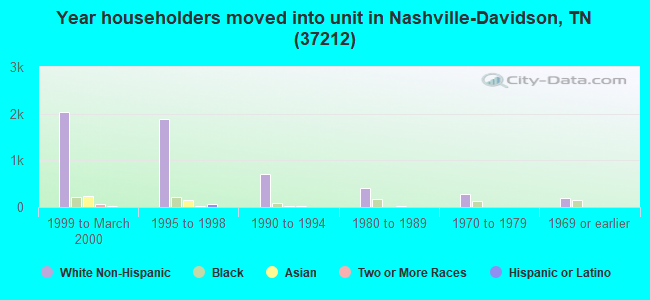
36% of the 37212 zip code residents lived in the same house 5 years ago. Out of people who lived in different houses, 29% lived in this county. Out of people who lived in different counties, 50% lived in Tennessee.
80% of the 37212 zip code residents lived in the same house 1 year ago. Out of people who lived in different houses, 56% moved from this county. Out of people who lived in different houses, 3% moved from different county within same state. Out of people who lived in different houses, 33% moved from different state. Out of people who lived in different houses, 4% moved from abroad.
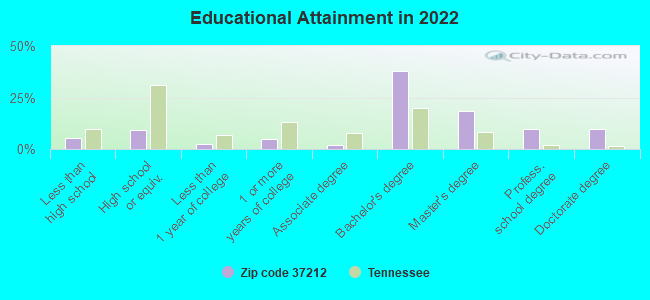
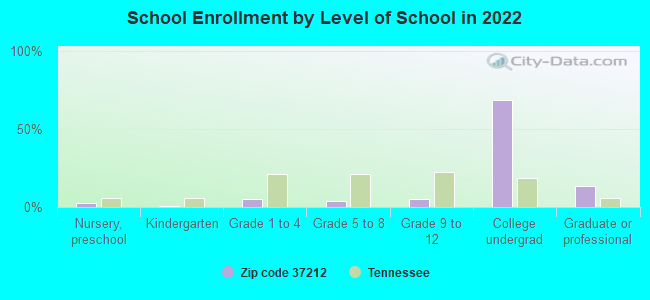
Private vs. public school enrollment:
Students in private schools in grades 1 to 8 (elementary and middle school): 489
Here:
50.1%
Tennessee:
15.0%
Students in private schools in grades 9 to 12 (high school): 395
Here:
76.8%
Tennessee:
16.2%
Students in private undergraduate colleges: 6,359
Here:
90.2%
Tennessee:
23.5%
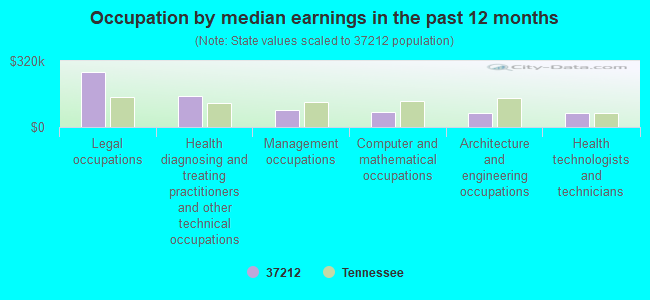
Occupation by median earnings in the past 12 months ($)
269,043Legal occupations
149,779Health diagnosing and treating practitioners and other technical occupations
83,801Management occupations
72,466Computer and mathematical occupations
69,926Architecture and engineering occupations
69,825Health technologists and technicians
Companies with federal contracts located in this zip code (NASHVILLE, TN):
BELMONT UNIVERSITY (1900 BELMONT BLVD) : $705,662 in 22 contractsfrom 1999 to 2006
Contracts for Construction of Structures and Facilities -- Schools, Other Education and Training Services, Educational Services by U.S. Army Corps of Engineers - civil program financing only, Army Signed by year:2000: $41,100; 2001: $95,150; 2002: $163,800; 2003: $185,810; 2004: -$7,714; 2005: $152,190; 2006: $25,826.
Biggest contracts:
$85,570 with U.S. Army Corps of Engineers - civil program financing only for Construction of Structures and Facilities -- Schools. Signed on 2005-04-11. Completion date: 2002-12-31.
$85,570 with Army for Construction of Structures and Facilities -- Schools. Signed on 2005-04-11. Completion date: 2002-12-31.
$75,200 with U.S. Army Corps of Engineers - civil program financing only for Construction of Structures and Facilities -- Schools. Signed on 2003-10-30. Completion date: 2002-12-31.
$75,200 with Army for Construction of Structures and Facilities -- Schools. Signed on 2003-10-30. Completion date: 2002-12-31.
STRUCTURAL AFFILIATES INTERNAT (2424 HILLSBORO RD STE 202; small business)
$83,299 with U.S. Army Corps of Engineers - civil program financing only for Architect - Engineer Services (including landscaping, interior layout, and designing). Signed on 2000-07-28. Completion date: 2001-02-01.
DIGIDATA CORP (2021 21ST AVE S; small business)
$40,896 with U.S. Army Corps of Engineers - civil program financing only for ADP Data Conversion Services. Taking place in KY. Signed on 2002-03-14. Completion date: 2002-01-29.
YADA YADA INC (1400 18TH AVENUE S STE C-3; small business)
$3,399 with Air Force for Lectures For Training. Taking place in OH. Signed on 2005-03-24. Completion date: 2005-04-29.
THE UPPER ROOM (1908 GRAND AVE)
$2,640 with Army for Books and Pamphlets. Signed on 2004-09-28. Completion date: 2004-09-30.
Top industries in this zip code by the number of employees in 2005:
Educational Services: Colleges, Universities, and Professional Schools (over 1000 employees: 1 establishment, 50-99 employees: 1 establishment, 1-4 employees: 1 establishment)
Health Care and Social Assistance: General Medical and Surgical Hospitals (over 1000: 1)
2003 - 2018 National Fire Incident Reporting System (NFIRS) incidents
Based on the data from the years 2003 - 2018 the average number of fires per year is 39. The highest number of reported fires - 87 took place in 2006, and the least - 16 in 2014. The data has an increasing trend.
When looking into fire subcategories, the most reports belonged to: Outside Fires (45.5%), and Structure Fires (30.7%).
Fire incident types reported to NFIRS in Zip Code 37212

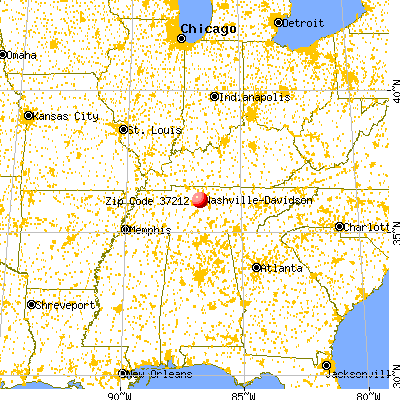


 Nearest zip codes: 37240, 37203, 37246, 37243, 37219, 37204.


 Based on the data from the years 2003 - 2018 the average number of fires per year is 39. The highest number of reported fires - 87 took place in 2006, and the least - 16 in 2014. The data has an increasing trend.
 When looking into fire subcategories, the most reports belonged to: Outside Fires (45.5%), and Structure Fires (30.7%).