Estimated zip code population in 2022: 13,909 Zip code population in 2010: 14,617 Zip code population in 2000: 14,097
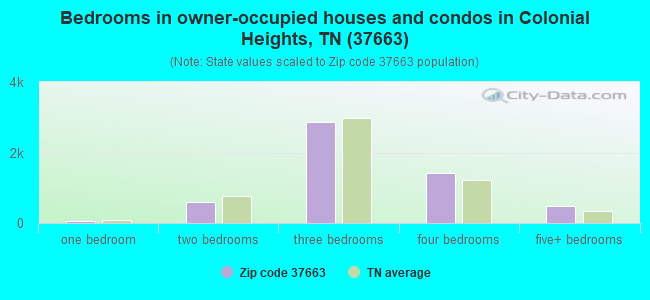
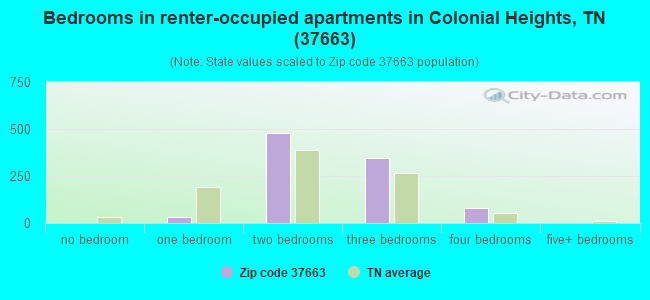
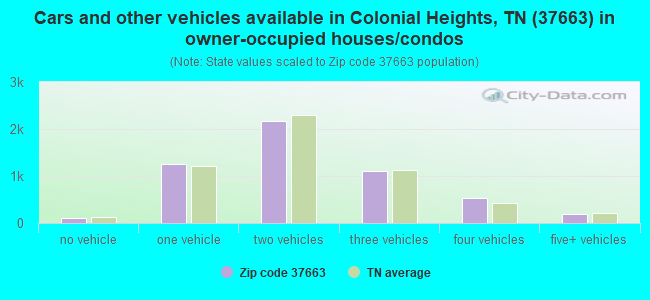
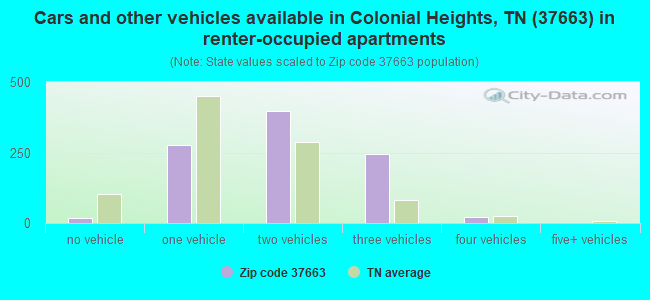
Houses and condos: 6,684 Renter-occupied apartments: 950
% of renters here:
15%
State:
33%
March 2022 cost of living index in zip code 37663: 81.2 (low, U.S. average is 100)
Land area: 26.7 sq. mi. Water area: 1.2 sq. mi.
Population density: 521 people per square mile
(low).
OSM Map
General Map
Google Map
MSN Map
OSM Map
General Map
Google Map
MSN Map
OSM Map
General Map
Google Map
MSN Map
OSM Map
General Map
Google Map
MSN Map
Please wait while loading the map...
Real estate property taxes paid for housing units in 2022:
This zip code:
0.5% ($1,281)
Tennessee:
0.5% ($1,376)
Median real estate property taxes paid for housing units with mortgages in 2022: $1,316 (0.5%) Median real estate property taxes paid for housing units with no mortgage in 2022: $1,240 (0.5%)
Estimated median house/condo value in 2022: $254,246
37663:
$254,246
Tennessee:
$284,800
According to our research of Tennessee and other state lists, there were 24 registered sex offenders living in 37663 zip code as of April 26, 2024. The ratio of all residents to sex offenders in zip code 37663 is 612 to 1. The ratio of registered sex offenders to all residents in this zip code is lower than the state average.
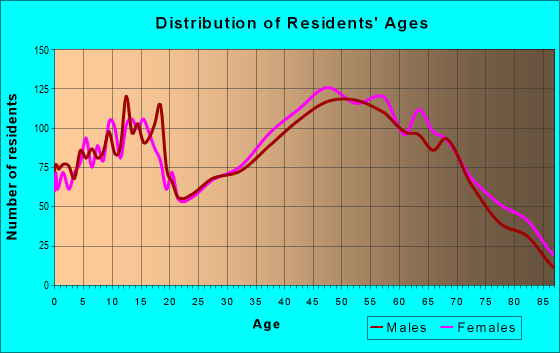
Median resident age:
This zip code:
49.1 years
Tennessee median age:
39.2 years
Average household size:
This zip code:
2.2 people
Tennessee:
2.4 people
Averages for the 2020 tax year for zip code 37663, filed in 2021:
Average Adjusted Gross Income (AGI) in 2020: $66,947 (Individual Income Tax Returns)
Here:
$66,947
State:
$69,014
Salary/wage: $57,947 (reported on 77.2% of returns)
Here:
$57,947
State:
$55,872
(% of AGI for various income ranges: 991.8% for AGIs below $25k, 3151.1% for AGIs $25k-50k, 5527.1% for AGIs $50k-75k, 8375.1% for AGIs $75k-100k, 15107.5% for AGIs $100k-200k, 57131.8% for AGIs over 200k)
Taxable interest for individuals: $1,443 (reported on 55.4% of returns)
This zip code:
$1,443
Tennessee:
$1,945
(% of AGI for various income ranges: 32.2% for AGIs below $25k, 43.4% for AGIs $25k-50k, 79.1% for AGIs $50k-75k, 124.6% for AGIs $75k-100k, 222.5% for AGIs $100k-200k, 1521.8% for AGIs over 200k)
Ordinary dividends: $5,329 (reported on 18.9% of returns)
Here:
$5,329
State:
$8,105
(% of AGI for various income ranges: 22.3% for AGIs below $25k, 37.3% for AGIs $25k-50k, 71.9% for AGIs $50k-75k, 120.7% for AGIs $75k-100k, 299.0% for AGIs $100k-200k, 2704.5% for AGIs over 200k)
Net capital gain/loss in AGI: +$12,717 (reported on 17.1% of returns)
Here:
+$12,717
State:
+$33,664
(% of AGI for various income ranges: 9.4% for AGIs below $25k, 34.4% for AGIs $25k-50k, 89.0% for AGIs $50k-75k, 158.6% for AGIs $75k-100k, 528.8% for AGIs $100k-200k, 8819.1% for AGIs over 200k)
Profit/loss from business: +$24,652 (reported on 14.8% of returns)
Here:
+$24,652
State:
+$18,991
(% of AGI for various income ranges: 116.9% for AGIs below $25k, 127.5% for AGIs $25k-50k, 175.9% for AGIs $50k-75k, 313.9% for AGIs $75k-100k, 985.8% for AGIs $100k-200k, 11138.2% for AGIs over 200k)
Taxable individual retirement arrangement distribution: $23,158 (reported on 15.6% of returns)
37663:
$23,158
Tennessee:
$20,036
(% of AGI for various income ranges: 97.1% for AGIs below $25k, 262.0% for AGIs $25k-50k, 471.4% for AGIs $50k-75k, 570.3% for AGIs $75k-100k, 1336.9% for AGIs $100k-200k, 3876.4% for AGIs over 200k)
Self-employed (Keogh) retirement plans: $30,525 (reported on 0.6% of returns)
37663:
$30,525
Tennessee:
$28,955
(% of AGI for various income ranges: 1110.0% for AGIs over 200k)
Total itemized deductions: $38,806 (reported on 4.3% of returns)
Here:
$38,806
State:
$40,136
(% of AGI for various income ranges: 79.5% for AGIs $25k-50k, 135.2% for AGIs $50k-75k, 163.7% for AGIs $75k-100k, 477.2% for AGIs $100k-200k, 5017.3% for AGIs over 200k)
Charity contributions: $20,358 (reported on 3.6% of returns)
Here:
$20,358
State:
$19,852
(% of AGI for various income ranges: 12.6% for AGIs $25k-50k, 25.6% for AGIs $50k-75k, 49.0% for AGIs $75k-100k, 212.9% for AGIs $100k-200k, 2821.8% for AGIs over 200k)
Taxes paid: $5,387 (reported on 4.1% of returns)
37663:
$5,387
State:
$6,038
(% of AGI for various income ranges: 8.9% for AGIs $25k-50k, 17.6% for AGIs $50k-75k, 21.2% for AGIs $75k-100k, 81.0% for AGIs $100k-200k, 592.7% for AGIs over 200k)
Earned income credit: $2,153 (reported on 13.1% of returns)
Here:
$2,153
State:
$2,391
(% of AGI for various income ranges: 76.2% for AGIs below $25k, 50.8% for AGIs $25k-50k)
Percentage of individuals using paid preparers for their 2020 taxes: 93.8%
Here:
94%
State:
93%
(% for various income ranges: 92.7% for AGIs below $25k, 95.1% for AGIs $25k-50k, 94.1% for AGIs $50k-75k, 95.0% for AGIs $75k-100k, 93.2% for AGIs $100k-200k, 93.3% for AGIs over 200k)
Averages for the 2012 tax year for zip code 37663, filed in 2013:
Average Adjusted Gross Income (AGI) in 2012: $57,928 (Individual Income Tax Returns)
Here:
$57,928
State:
$53,767
Salary/wage: $52,277 (reported on 80.2% of returns)
Here:
$52,277
State:
$45,421
(% of AGI for various income ranges: 67.0% for AGIs below $25k, 68.9% for AGIs $25k-50k, 72.9% for AGIs $50k-75k, 74.7% for AGIs $75k-100k, 77.3% for AGIs $100k-200k, 67.3% for AGIs over 200k)
Taxable interest for individuals: $1,007 (reported on 52.5% of returns)
This zip code:
$1,007
Tennessee:
$1,732
(% of AGI for various income ranges: 1.9% for AGIs below $25k, 1.2% for AGIs $25k-50k, 0.8% for AGIs $50k-75k, 0.8% for AGIs $75k-100k, 0.7% for AGIs $100k-200k, 0.8% for AGIs over 200k)
Ordinary dividends: $3,274 (reported on 19.8% of returns)
Here:
$3,274
State:
$6,739
(% of AGI for various income ranges: 1.3% for AGIs below $25k, 0.9% for AGIs $25k-50k, 0.8% for AGIs $50k-75k, 0.9% for AGIs $75k-100k, 1.1% for AGIs $100k-200k, 1.7% for AGIs over 200k)
Net capital gain/loss in AGI: +$5,726 (reported on 14.8% of returns)
Here:
+$5,726
State:
+$19,082
(% of AGI for various income ranges: 0.4% for AGIs $25k-50k, 0.6% for AGIs $50k-75k, 0.8% for AGIs $75k-100k, 1.3% for AGIs $100k-200k, 4.4% for AGIs over 200k)
Profit/loss from business: +$16,932 (reported on 15.1% of returns)
Here:
+$16,932
State:
+$15,240
(% of AGI for various income ranges: 7.3% for AGIs below $25k, 3.6% for AGIs $25k-50k, 3.5% for AGIs $50k-75k, 3.3% for AGIs $75k-100k, 3.8% for AGIs $100k-200k, 6.5% for AGIs over 200k)
Taxable individual retirement arrangement distribution: $17,737 (reported on 16.7% of returns)
37663:
$17,737
Tennessee:
$15,505
(% of AGI for various income ranges: 8.0% for AGIs below $25k, 6.9% for AGIs $25k-50k, 5.4% for AGIs $50k-75k, 5.9% for AGIs $75k-100k, 5.2% for AGIs $100k-200k, 1.7% for AGIs over 200k)
Self-employment retirement plans: $19,900 (reported on 0.6% of returns)
37663:
$19,900
Tennessee:
$22,567
Total itemized deductions: $20,236 (18% of AGI, reported on 24.9% of returns)
Here:
$20,236
State:
$21,976
Here:
18.2% of AGI
State:
17.8% of AGI
(% of AGI for various income ranges: 7.9% for AGIs below $25k, 8.4% for AGIs $25k-50k, 8.3% for AGIs $50k-75k, 8.6% for AGIs $75k-100k, 9.7% for AGIs $100k-200k, 8.2% for AGIs over 200k)
Charity contributions: $6,866 (reported on 21.0% of returns)
Here:
$6,866
State:
$6,709
(% of AGI for various income ranges: 0.6% for AGIs below $25k, 1.5% for AGIs $25k-50k, 2.0% for AGIs $50k-75k, 2.1% for AGIs $75k-100k, 3.2% for AGIs $100k-200k, 3.6% for AGIs over 200k)
Taxes paid: $4,008 (reported on 24.6% of returns)
37663:
$4,008
State:
$4,829
(% of AGI for various income ranges: 0.9% for AGIs below $25k, 1.3% for AGIs $25k-50k, 1.5% for AGIs $50k-75k, 1.6% for AGIs $75k-100k, 2.2% for AGIs $100k-200k, 1.8% for AGIs over 200k)
Earned income credit: $1,955 (reported on 14.4% of returns)
Here:
$1,955
State:
$2,404
(% of AGI for various income ranges: 4.8% for AGIs below $25k, 1.0% for AGIs $25k-50k)
Percentage of individuals using paid preparers for their 2012 taxes: 48.5%
Here:
48%
State:
52%
(% for various income ranges: 45.3% for AGIs below $25k, 50.3% for AGIs $25k-50k, 51.4% for AGIs $50k-75k, 46.6% for AGIs $75k-100k, 48.8% for AGIs $100k-200k, 65.0% for AGIs over 200k)
Averages for the 2004 tax year for zip code 37663, filed in 2005:
Average Adjusted Gross Income (AGI) in 2004: $47,927 (Individual Income Tax Returns)
Here:
$47,927
State:
$44,088
Salary/wage: $43,810 (reported on 82.8% of returns)
Here:
$43,810
State:
$38,825
(% of AGI for various income ranges: 107.7% for AGIs below $10k, 66.3% for AGIs $10k-25k, 73.9% for AGIs $25k-50k, 77.6% for AGIs $50k-75k, 79.9% for AGIs $75k-100k, 74.1% for AGIs over 100k)
Taxable interest for individuals: $1,456 (reported on 60.2% of returns)
This zip code:
$1,456
Tennessee:
$1,802
(% of AGI for various income ranges: 6.8% for AGIs below $10k, 3.9% for AGIs $10k-25k, 1.9% for AGIs $25k-50k, 1.4% for AGIs $50k-75k, 1.5% for AGIs $75k-100k, 1.6% for AGIs over 100k)
Taxable dividends: $1,789 (reported on 32.2% of returns)
Here:
$1,789
State:
$3,727
(% of AGI for various income ranges: 3.3% for AGIs below $10k, 1.6% for AGIs $10k-25k, 1.1% for AGIs $25k-50k, 0.7% for AGIs $50k-75k, 1.4% for AGIs $75k-100k, 1.3% for AGIs over 100k)
Net capital gain/loss: +$6,383 (reported on 19.8% of returns)
Here:
+$6,383
State:
+$15,776
(% of AGI for various income ranges: -1.8% for AGIs below $10k, 0.7% for AGIs $10k-25k, 0.4% for AGIs $25k-50k, 0.5% for AGIs $50k-75k, 1.3% for AGIs $75k-100k, 6.4% for AGIs over 100k)
Profit/loss from business: +$11,854 (reported on 16.0% of returns)
Here:
+$11,854
State:
+$12,882
(% of AGI for various income ranges: 9.8% for AGIs below $10k, 5.2% for AGIs $10k-25k, 3.6% for AGIs $25k-50k, 3.4% for AGIs $50k-75k, 1.9% for AGIs $75k-100k, 5.0% for AGIs over 100k)
IRA payment deduction: $3,221 (reported on 2.5% of returns)
37663:
$3,221
Tennessee:
$2,934
(% of AGI for various income ranges: 0.2% for AGIs $10k-25k, 0.2% for AGIs $25k-50k, 0.2% for AGIs $50k-75k, 0.2% for AGIs $75k-100k, 0.1% for AGIs over 100k)
Self-employed pension: $15,458 (reported on 0.7% of returns)
Here:
$15,458
Tennessee:
$16,857
Total itemized deductions: $16,578 (20% of AGI, reported on 27.4% of returns)
Here:
$16,578
State:
$18,035
Here:
19.5% of AGI
State:
19.9% of AGI
(% of AGI for various income ranges: 11.5% for AGIs below $10k, 7.8% for AGIs $10k-25k, 10.1% for AGIs $25k-50k, 9.7% for AGIs $50k-75k, 10.2% for AGIs $75k-100k, 8.9% for AGIs over 100k)
Charity contributions deductions: $5,211 (6% of AGI, reported on 23.6% of returns)
Here:
$5,211
State:
$5,167
Here:
5.8% of AGI
State:
5.3% of AGI
(% of AGI for various income ranges: 0.9% for AGIs below $10k, 1.2% for AGIs $10k-25k, 1.8% for AGIs $25k-50k, 2.0% for AGIs $50k-75k, 2.8% for AGIs $75k-100k, 3.6% for AGIs over 100k)
Total tax: $7,094 (reported on 79.2% of returns)
37663:
$7,094
State:
$7,482
(% of AGI for various income ranges: 3.4% for AGIs below $10k, 4.1% for AGIs $10k-25k, 6.8% for AGIs $25k-50k, 9.0% for AGIs $50k-75k, 10.7% for AGIs $75k-100k, 18.5% for AGIs over 100k)
Earned income credit: $1,510 (reported on 11.4% of returns)
Here:
$1,510
State:
$1,826
Percentage of individuals using paid preparers for their 2004 taxes: 53.4%
Here:
53%
State:
60%
(% for various income ranges: 46.7% for AGIs below $10k, 57.6% for AGIs $10k-25k, 58.0% for AGIs $25k-50k, 53.0% for AGIs $50k-75k, 50.4% for AGIs $75k-100k, 50.4% for AGIs over 100k)
Likely homosexual households (counted as self-reported same-sex unmarried-partner households)
Lesbian couples: 0.1% of all households
Gay men: 0.3% of all households
Household received Food Stamps/SNAP in the past 12 months: 283 Household did not receive Food Stamps/SNAP in the past 12 months: 6,058
Women who had a birth in the past 12 months: 87 (74 now married, 13 unmarried) Women who did not have a birth in the past 12 months: 2,640 (1,424 now married, 1,216 unmarried)
Housing units in zip code 37663 with a mortgage: 3,026 (268 second mortgage, 231 both second mortgage and home equity loan) Houses without a mortgage: 185
Median monthly owner costs for units with a mortgage: $1,312 Median monthly owner costs for units without a mortgage: $406
Residents with income below the poverty level in 2022:
This zip code:
5.1%
Whole state:
13.3%
Residents with income below 50% of the poverty level in 2022:
This zip code:
3.7%
Whole state:
7.1%
Median number of rooms in houses and condos:
Here:
6.9
State:
6.5
Median number of rooms in apartments:
Here:
4.6
State:
4.4
Notable locations in this zip code not listed on our city pages
Notable locations in zip code 37663: Lakeside Dock (A), Valley Grove Farm (B), Warriors Path Volunteer Fire Department (C), Tennessee Department of Agriculture Division of Forestry Sullivan (D), Kingsport Fire Department Station 6 (E). Display/hide their locations on the map
Churches in zip code 37663 include: Colonial Heights Baptist Church (A), Colonial Heights Presbyterian Church (B), Summersville Baptist Church (C), Fordtown Church (D), Kendrick Creek Church (E), Liberty Church (F), Fordtown Baptist Church (G), Tri-City Airport Church (H), Colonial Heights Church (I). Display/hide their locations on the map
Cemeteries: Strickler Cemetery (1), Jones Cemetery (2), Wells Cemetery (3), Willard Cemetery (4), Kendricks Creek Cemetery (5), Chase Cemetery (6), Copas Cemetery (7). Display/hide their locations on the map
Streams, rivers, and creeks: Kendrick Creek (A), Watauga River (B), Straight Branch (C), Gammon Creek (D), Brown Creek (E), Sinking Creek (F), Russell Creek (G), Rock Springs Branch (H). Display/hide their locations on the map
In group quarters: 130 (-1 institutionalized population)
Size of family households: 1,953 2-persons, 837 3-persons, 793 4-persons, 323 5-persons, 43 6-persons, 30 7-or-more-persons
Size of nonfamily households: 2,008 1-person, 320 2-persons
1,730 married couples with children.
264 single-parent households (24 men, 240 women).
97.4% of residents of 37663 zip code speak English at home.
0.8% of residents speak Spanish at home (9% very well, 85% well, 6% not well).
1.5% of residents speak other Indo-European language at home (81% very well, 19% well).
0.2% of residents speak Asian or Pacific Island language at home (100% very well).
0.2% of residents speak other language at home (100% very well).
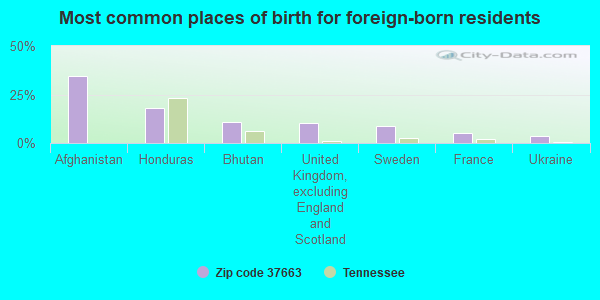
Foreign born population: 395 (2.8%) (62.5% of them are naturalized citizens)
This zip code:
2.8%
Whole state:
5.6%
34%Afghanistan
18%Honduras
11%Bhutan
10%United Kingdom, excluding England and Scotland
9%Sweden
5%France
4%Ukraine
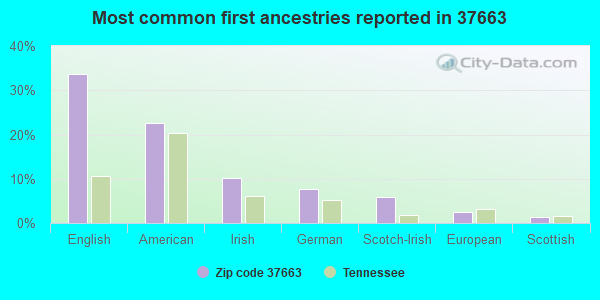
34%English
23%American
10%Irish
8%German
6%Scotch-Irish
2%European
1%Scottish
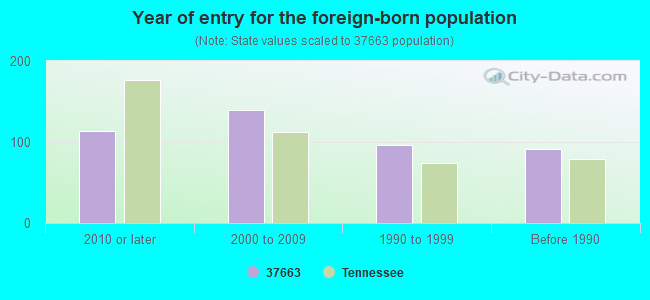
Year of entry for the foreign-born population
1132010 or later
1402000 to 2009
961990 to 1999
91Before 1990
Facilities with environmental interests located in this zip code:
COLONIAL HEIGHTS MIDDLE SCHOOL (415 LEBANON DR in KINGSPORT, TN)
(National Center for Education Statistics) - STATE ID-0075 Organizations: SULLIVAN COUNTY SCHOOL DISTRCT (SCHOOL DISTRICT)
CARTA MUNDI, INC (10444 WALLACE ALLEY STREET in KINGSPORT, TN)
AIR SYNTHETIC MINOR (AIRS/AFS) Small Quantity Generators, between 100 kg and 1000 kg of hazardous waste/month (Resource Conservation and Recovery Act (tracking hazardous waste)) - notification Business NAICS classification: COMMERCIAL LITHOGRAPHIC PRINTING. Organizations: BOB MCDANIEL (CONTACT/OPERATOR)
, PAUL RAECKE (CONTACT/OWNER)
A & M EXPRESS, INC. (840 EASTERN STAR RD KINGSPORT in KINGSPORT, TN)
(Resource Conservation and Recovery Act (tracking hazardous waste))
CENTRAL TRANSPORT INC (MITCHELL RD in KINGSPORT, TN)
(Resource Conservation and Recovery Act (tracking hazardous waste))
(Resource Conservation and Recovery Act (tracking hazardous waste))
A & J ASPHALT, INC. (AIRPORT PARKWAY in KINGSPORT, TN)
AIR SYNTHETIC MINOR (AIRS/AFS) Business SIC classification: ASPHALT PAVING MIXTURES AND BLOCKS Alternative names: BRACKEN PAVING
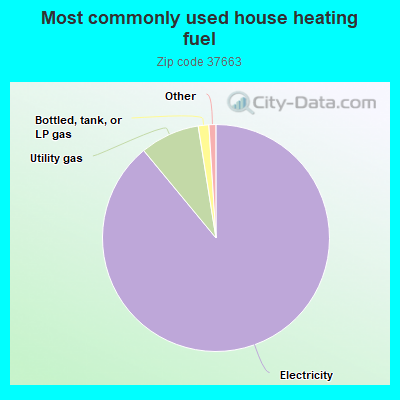
89.1%Electricity
8.5%Utility gas
1.5%Bottled, tank, or LP gas
Population in 1990: 12,097. Population change in the 1990s: +2,000 (+16.5%).
Place of birth for U.S.-born residents:
This state: 8,743
Northeast: 670
Midwest: 905
South: 2,776
West: 311
61% of the 37663 zip code residents lived in the same house 5 years ago. Out of people who lived in different houses, 57% lived in this county. Out of people who lived in different counties, 50% lived in Tennessee.
96% of the 37663 zip code residents lived in the same house 1 year ago. Out of people who lived in different houses, 46% moved from this county. Out of people who lived in different houses, 45% moved from different county within same state. Out of people who lived in different houses, 18% moved from different state. Out of people who lived in different houses, 0% moved from abroad.
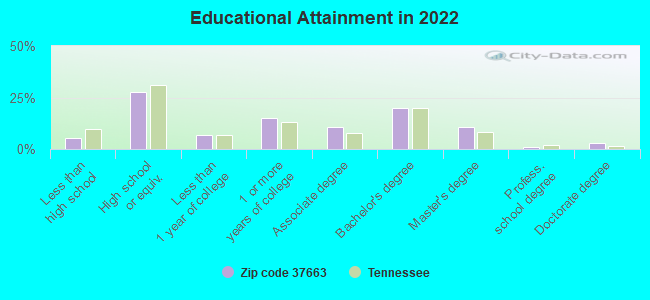
Private vs. public school enrollment:
Students in private schools in grades 1 to 8 (elementary and middle school): 58
Here:
6.6%
Tennessee:
15.0%
Students in private schools in grades 9 to 12 (high school): 99
Here:
13.8%
Tennessee:
16.2%
Students in private undergraduate colleges: 156
Here:
28.7%
Tennessee:
23.5%
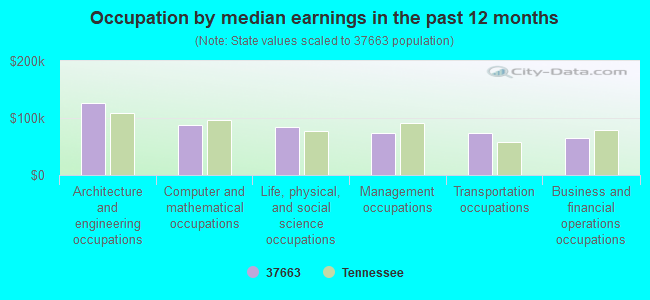
Occupation by median earnings in the past 12 months ($)
126,467Architecture and engineering occupations
87,610Computer and mathematical occupations
84,773Life, physical, and social science occupations
73,530Management occupations
73,249Transportation occupations
65,598Business and financial operations occupations
Companies with federal contracts located in this zip code:
WASTE MANAGEMENT OF TRI-CITIES (1010 SAM WALTON DR in KINGSPORT, TN) : $103,084 in 13 contractsfrom 2002 to 2005
Contracts for Trash/Garbage Collection Services - Including Portable Sanitation Services by Department of Veterans Affairs, Forest Service (disused code: now 12C2), Forest Service, Army, and others Signed by year:2000: $0; 2001: $0; 2002: $1,425; 2003: $1,425; 2004: $14,033; 2005: $86,201; 2006: $0.
Biggest contracts:
$34,050 with Department of Veterans Affairs for Trash/Garbage Collection Services - Including Portable Sanitation Services. Signed on 2005-10-01. Effective on 2006-01-01. Completion date: 2006-03-31.
$33,134, same as above.Signed on 2005-10-01. Completion date: 2006-09-30.
$14,293, same as above.Signed on 2005-10-01. Effective on 2006-04-01. Completion date: 2006-06-30.
$12,608 with Forest Service (disused code: now 12C2) for Trash/Garbage Collection Services - Including Portable Sanitation Services. Signed on 2004-01-12. Effective on 2003-12-01. Completion date: 2004-11-30.
PREMIER EQUIPMENT LLC (320 WYNFIELD CT in KINGSPORT, TN; small business) : $49,980 in 2 contractsin 2005
$24,990 with Army for Truck and Tractor Attachments. Taking place in VA. Signed on 2005-06-21. Completion date: 2005-05-18.
$24,990 with U.S. Army Corps of Engineers - civil program financing only for Truck and Tractor Attachments. Taking place in VA. Signed on 2005-06-21. Completion date: 2005-05-18.
YORK INTERNATIONAL CORPORATION (1004 EASTERN STAR RD in KINGSPORT, TN) : $21,856 in 4 contractsfrom 2003 to 2006
$15,600 with Army for Air Conditioning Equipment. Taking place in VA. Signed on 2006-03-15. Completion date: 2006-05-15.
$9,246 with Federal Technology Service for Other ADP and Telecommunications Services (includes data storage on tapes, compact disks, etc.). Signed on 2003-09-15. Completion date: 2004-09-15.
$0 with Federal Technology Service for ADP Input/Output and Storage Devices. Signed on 2005-08-25. Completion date: 2005-08-28.
-$2,990 with Federal Technology Service for Other ADP and Telecommunications Services (includes data storage on tapes, compact disks, etc.). Signed on 2005-09-26. Completion date: 2003-09-30.
Top industries in this zip code by the number of employees in 2005:
Administrative and Support and Waste Management and Remediation Services: Temporary Help Services (250-499 employees: 2 establishments, 50-99 employees: 1 establishment, 1-4 employees: 1 establishment)
2002 - 2018 National Fire Incident Reporting System (NFIRS) incidents
According to the data from the years 2002 - 2018 the average number of fire incidents per year is 79. The highest number of reported fire incidents - 122 took place in 2014, and the least - 13 in 2004. The data has a growing trend.
When looking into fire subcategories, the most reports belonged to: Outside Fires (44.5%), and Structure Fires (39.3%).
Fire incident types reported to NFIRS in Zip Code 37663


 Nearest zip codes: 37664, 37615, 37660, 37617, 37686, 37665.


 According to the data from the years 2002 - 2018 the average number of fire incidents per year is 79. The highest number of reported fire incidents - 122 took place in 2014, and the least - 13 in 2004. The data has a growing trend.
 When looking into fire subcategories, the most reports belonged to: Outside Fires (44.5%), and Structure Fires (39.3%).