Estimated zip code population in 2022: 5,292 Zip code population in 2010: 5,288 Zip code population in 2000: 4,981
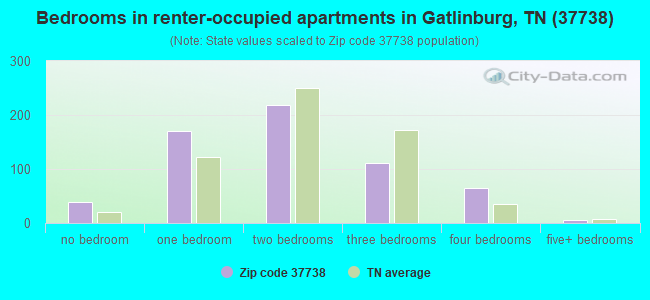
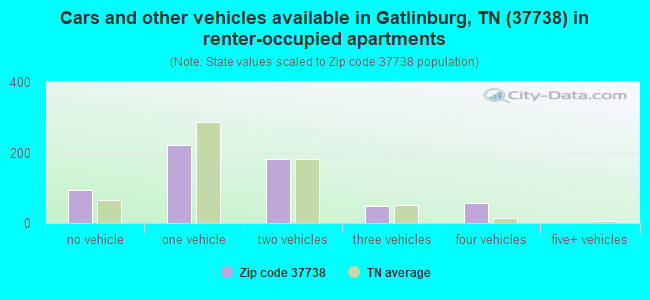
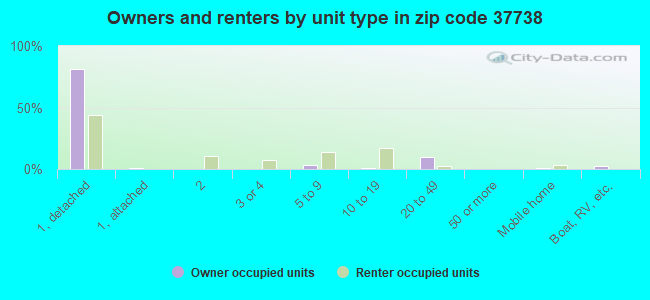
Houses and condos: 7,131 Renter-occupied apartments: 602
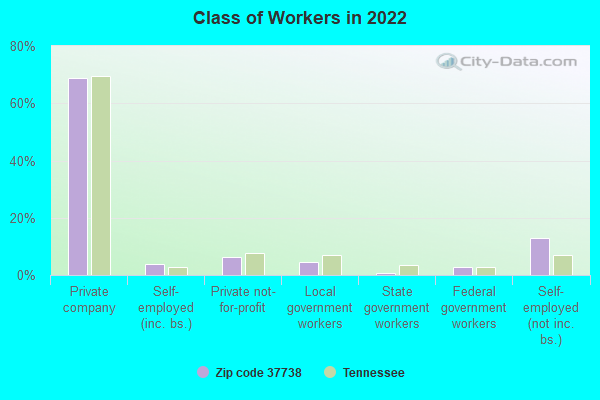
% of renters here:
29%
State:
33%
March 2022 cost of living index in zip code 37738: 82.4 (low, U.S. average is 100)
Land area: 210.0 sq. mi. Water area: 0.0 sq. mi.
Population density: 25 people per square mile
(very low).
OSM Map
General Map
Google Map
MSN Map
OSM Map
General Map
Google Map
MSN Map
OSM Map
General Map
Google Map
MSN Map
OSM Map
General Map
Google Map
MSN Map
Please wait while loading the map...
Real estate property taxes paid for housing units in 2022:
This zip code:
0.3% ($972)
Tennessee:
0.5% ($1,376)
Median real estate property taxes paid for housing units with mortgages in 2022: $1,184 (0.4%) Median real estate property taxes paid for housing units with no mortgage in 2022: $766 (0.2%)
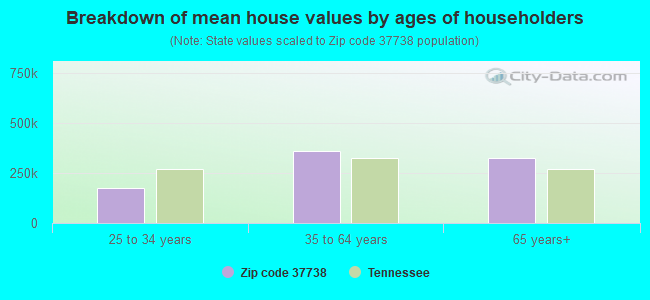
Estimated median house/condo value in 2022: $321,121
37738:
$321,121
Tennessee:
$284,800
According to our research of Tennessee and other state lists, there were 19 registered sex offenders living in 37738 zip code as of April 25, 2024. The ratio of all residents to sex offenders in zip code 37738 is 309 to 1. The ratio of registered sex offenders to all residents in this zip code is near the state average.
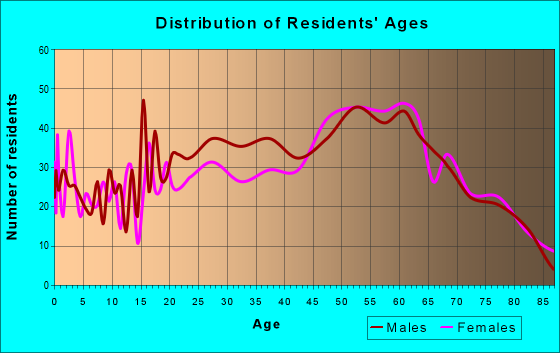
Median resident age:
This zip code:
44.4 years
Tennessee median age:
39.2 years
Average household size:
This zip code:
2.4 people
Tennessee:
2.4 people
Averages for the 2020 tax year for zip code 37738, filed in 2021:
Average Adjusted Gross Income (AGI) in 2020: $65,687 (Individual Income Tax Returns)
Here:
$65,687
State:
$69,014
Salary/wage: $34,881 (reported on 76.6% of returns)
Here:
$34,881
State:
$55,872
(% of AGI for various income ranges: 1293.0% for AGIs below $25k, 3539.6% for AGIs $25k-50k, 6219.4% for AGIs $50k-75k, 8526.0% for AGIs $75k-100k, 14084.0% for AGIs $100k-200k, 48000.0% for AGIs over 200k)
Taxable interest for individuals: $2,504 (reported on 30.0% of returns)
This zip code:
$2,504
Tennessee:
$1,945
(% of AGI for various income ranges: 27.0% for AGIs below $25k, 23.5% for AGIs $25k-50k, 127.2% for AGIs $50k-75k, 241.0% for AGIs $75k-100k, 576.0% for AGIs $100k-200k, 2790.0% for AGIs over 200k)
Ordinary dividends: $6,059 (reported on 14.5% of returns)
Here:
$6,059
State:
$8,105
(% of AGI for various income ranges: 14.2% for AGIs below $25k, 31.4% for AGIs $25k-50k, 160.0% for AGIs $50k-75k, 282.0% for AGIs $75k-100k, 753.0% for AGIs $100k-200k, 3420.0% for AGIs over 200k)
Net capital gain/loss in AGI: +$47,789 (reported on 14.5% of returns)
Here:
+$47,789
State:
+$33,664
(% of AGI for various income ranges: 17.6% for AGIs below $25k, 31.2% for AGIs $25k-50k, 253.3% for AGIs $50k-75k, 609.0% for AGIs $75k-100k, 1806.0% for AGIs $100k-200k, 59356.7% for AGIs over 200k)
Profit/loss from business: +$28,441 (reported on 17.8% of returns)
Here:
+$28,441
State:
+$18,991
(% of AGI for various income ranges: 144.1% for AGIs below $25k, 319.6% for AGIs $25k-50k, 1027.2% for AGIs $50k-75k, 1305.0% for AGIs $75k-100k, 1994.0% for AGIs $100k-200k, 23300.0% for AGIs over 200k)
Taxable individual retirement arrangement distribution: $19,886 (reported on 7.3% of returns)
37738:
$19,886
Tennessee:
$20,036
(% of AGI for various income ranges: 41.2% for AGIs below $25k, 82.6% for AGIs $25k-50k, 306.1% for AGIs $50k-75k, 578.0% for AGIs $75k-100k, 2375.0% for AGIs $100k-200k)
Total itemized deductions: $43,693 (reported on 4.6% of returns)
Here:
$43,693
State:
$40,136
(% of AGI for various income ranges: 65.2% for AGIs below $25k, 373.9% for AGIs $50k-75k, 587.0% for AGIs $100k-200k, 14083.3% for AGIs over 200k)
Charity contributions: $14,536 (reported on 3.6% of returns)
Here:
$14,536
State:
$19,852
(% of AGI for various income ranges: 33.3% for AGIs $25k-50k, 277.0% for AGIs $75k-100k, 3773.3% for AGIs over 200k)
Taxes paid: $5,400 (reported on 4.6% of returns)
37738:
$5,400
State:
$6,038
(% of AGI for various income ranges: 10.2% for AGIs below $25k, 59.4% for AGIs $50k-75k, 117.0% for AGIs $100k-200k, 1443.3% for AGIs over 200k)
Earned income credit: $1,938 (reported on 15.8% of returns)
Here:
$1,938
State:
$2,391
(% of AGI for various income ranges: 60.9% for AGIs below $25k, 59.5% for AGIs $25k-50k)
Percentage of individuals using paid preparers for their 2020 taxes: 90.1%
Here:
90%
State:
93%
(% for various income ranges: 88.1% for AGIs below $25k, 88.6% for AGIs $25k-50k, 93.9% for AGIs $50k-75k, 94.7% for AGIs $75k-100k, 95.7% for AGIs $100k-200k, 92.9% for AGIs over 200k)
Averages for the 2012 tax year for zip code 37738, filed in 2013:
Average Adjusted Gross Income (AGI) in 2012: $43,700 (Individual Income Tax Returns)
Here:
$43,700
State:
$53,767
Salary/wage: $30,247 (reported on 79.6% of returns)
Here:
$30,247
State:
$45,421
(% of AGI for various income ranges: 80.2% for AGIs below $25k, 75.9% for AGIs $25k-50k, 59.9% for AGIs $50k-75k, 50.2% for AGIs $75k-100k, 51.2% for AGIs $100k-200k, 25.6% for AGIs over 200k)
Taxable interest for individuals: $2,442 (reported on 31.1% of returns)
This zip code:
$2,442
Tennessee:
$1,732
(% of AGI for various income ranges: 1.4% for AGIs below $25k, 1.2% for AGIs $25k-50k, 1.6% for AGIs $50k-75k, 2.8% for AGIs $75k-100k, 1.5% for AGIs $100k-200k, 2.1% for AGIs over 200k)
Ordinary dividends: $5,202 (reported on 12.4% of returns)
Here:
$5,202
State:
$6,739
(% of AGI for various income ranges: 0.7% for AGIs below $25k, 0.8% for AGIs $25k-50k, 1.2% for AGIs $50k-75k, 1.4% for AGIs $75k-100k, 2.2% for AGIs $100k-200k, 2.2% for AGIs over 200k)
Net capital gain/loss in AGI: +$22,176 (reported on 9.8% of returns)
Here:
+$22,176
State:
+$19,082
(% of AGI for various income ranges: 0.1% for AGIs below $25k, 0.4% for AGIs $50k-75k, 1.3% for AGIs $75k-100k, 4.9% for AGIs $100k-200k, 15.4% for AGIs over 200k)
Profit/loss from business: +$13,105 (reported on 19.2% of returns)
Here:
+$13,105
State:
+$15,240
(% of AGI for various income ranges: 9.1% for AGIs below $25k, 6.2% for AGIs $25k-50k, 7.1% for AGIs $50k-75k, 7.6% for AGIs $75k-100k, 9.1% for AGIs $100k-200k)
Taxable individual retirement arrangement distribution: $12,643 (reported on 8.3% of returns)
37738:
$12,643
Tennessee:
$15,505
(% of AGI for various income ranges: 2.4% for AGIs below $25k, 2.2% for AGIs $25k-50k, 2.7% for AGIs $50k-75k, 2.9% for AGIs $75k-100k, 5.9% for AGIs $100k-200k)
Total itemized deductions: $24,540 (21% of AGI, reported on 17.2% of returns)
Here:
$24,540
State:
$21,976
Here:
20.6% of AGI
State:
17.8% of AGI
(% of AGI for various income ranges: 5.8% for AGIs below $25k, 9.4% for AGIs $25k-50k, 10.5% for AGIs $50k-75k, 11.1% for AGIs $75k-100k, 13.0% for AGIs $100k-200k, 9.2% for AGIs over 200k)
Charity contributions: $5,796 (reported on 13.3% of returns)
Here:
$5,796
State:
$6,709
(% of AGI for various income ranges: 0.5% for AGIs below $25k, 1.0% for AGIs $25k-50k, 1.7% for AGIs $50k-75k, 2.6% for AGIs $75k-100k, 2.1% for AGIs $100k-200k, 2.6% for AGIs over 200k)
Taxes paid: $4,360 (reported on 16.9% of returns)
37738:
$4,360
State:
$4,829
(% of AGI for various income ranges: 0.7% for AGIs below $25k, 1.2% for AGIs $25k-50k, 1.7% for AGIs $50k-75k, 2.0% for AGIs $75k-100k, 2.4% for AGIs $100k-200k, 2.1% for AGIs over 200k)
Earned income credit: $1,954 (reported on 21.9% of returns)
Here:
$1,954
State:
$2,404
(% of AGI for various income ranges: 4.9% for AGIs below $25k, 1.1% for AGIs $25k-50k)
Percentage of individuals using paid preparers for their 2012 taxes: 58.3%
Here:
58%
State:
52%
(% for various income ranges: 51.7% for AGIs below $25k, 61.2% for AGIs $25k-50k, 68.8% for AGIs $50k-75k, 64.7% for AGIs $75k-100k, 70.6% for AGIs $100k-200k, 100.0% for AGIs over 200k)
Averages for the 2004 tax year for zip code 37738, filed in 2005:
Average Adjusted Gross Income (AGI) in 2004: $43,395 (Individual Income Tax Returns)
Here:
$43,395
State:
$44,088
Salary/wage: $28,463 (reported on 76.1% of returns)
Here:
$28,463
State:
$38,825
(% of AGI for various income ranges: 123.1% for AGIs below $10k, 77.9% for AGIs $10k-25k, 69.3% for AGIs $25k-50k, 55.8% for AGIs $50k-75k, 50.8% for AGIs $75k-100k, 29.2% for AGIs over 100k)
Taxable interest for individuals: $3,116 (reported on 41.8% of returns)
This zip code:
$3,116
Tennessee:
$1,802
(% of AGI for various income ranges: 7.2% for AGIs below $10k, 2.6% for AGIs $10k-25k, 2.9% for AGIs $25k-50k, 3.1% for AGIs $50k-75k, 2.9% for AGIs $75k-100k, 3.0% for AGIs over 100k)
Taxable dividends: $3,499 (reported on 19.1% of returns)
Here:
$3,499
State:
$3,727
(% of AGI for various income ranges: 2.3% for AGIs below $10k, 1.1% for AGIs $10k-25k, 1.1% for AGIs $25k-50k, 1.6% for AGIs $50k-75k, 1.1% for AGIs $75k-100k, 1.9% for AGIs over 100k)
Net capital gain/loss: +$19,696 (reported on 18.1% of returns)
Here:
+$19,696
State:
+$15,776
(% of AGI for various income ranges: -0.8% for AGIs below $10k, 2.8% for AGIs $10k-25k, 1.5% for AGIs $25k-50k, 5.2% for AGIs $50k-75k, 5.5% for AGIs $75k-100k, 14.3% for AGIs over 100k)
Profit/loss from business: +$14,733 (reported on 23.5% of returns)
Here:
+$14,733
State:
+$12,882
(% of AGI for various income ranges: 9.4% for AGIs below $10k, 8.2% for AGIs $10k-25k, 7.6% for AGIs $25k-50k, 8.9% for AGIs $50k-75k, 10.0% for AGIs $75k-100k, 7.3% for AGIs over 100k)
IRA payment deduction: $3,837 (reported on 3.5% of returns)
37738:
$3,837
Tennessee:
$2,934
(% of AGI for various income ranges: 0.4% for AGIs $10k-25k, 0.6% for AGIs $25k-50k, 0.5% for AGIs $50k-75k, 0.2% for AGIs over 100k)
Total itemized deductions: $20,021 (20% of AGI, reported on 21.3% of returns)
Here:
$20,021
State:
$18,035
Here:
19.8% of AGI
State:
19.9% of AGI
(% of AGI for various income ranges: 18.4% for AGIs below $10k, 7.0% for AGIs $10k-25k, 9.7% for AGIs $25k-50k, 12.8% for AGIs $50k-75k, 12.9% for AGIs $75k-100k, 8.8% for AGIs over 100k)
Charity contributions deductions: $5,049 (5% of AGI, reported on 17.8% of returns)
Here:
$5,049
State:
$5,167
Here:
4.5% of AGI
State:
5.3% of AGI
(% of AGI for various income ranges: 0.8% for AGIs below $10k, 0.7% for AGIs $10k-25k, 1.3% for AGIs $25k-50k, 2.6% for AGIs $50k-75k, 3.1% for AGIs $75k-100k, 2.4% for AGIs over 100k)
Total tax: $8,712 (reported on 75.7% of returns)
37738:
$8,712
State:
$7,482
(% of AGI for various income ranges: 6.5% for AGIs below $10k, 4.9% for AGIs $10k-25k, 7.9% for AGIs $25k-50k, 10.9% for AGIs $50k-75k, 12.9% for AGIs $75k-100k, 23.2% for AGIs over 100k)
Earned income credit: $1,605 (reported on 17.5% of returns)
Here:
$1,605
State:
$1,826
Percentage of individuals using paid preparers for their 2004 taxes: 64.0%
Here:
64%
State:
60%
(% for various income ranges: 61.0% for AGIs below $10k, 58.0% for AGIs $10k-25k, 64.2% for AGIs $25k-50k, 69.7% for AGIs $50k-75k, 72.5% for AGIs $75k-100k, 87.8% for AGIs over 100k)
Notable locations in zip code 37738: The Loop (A), Chimneys Campground (B), Morton Overlook (C), Greenbrier Ranger Station (D), Greenbrier Campground (E), Millsap Picnic Grounds (F), Proffitt View (G), Elkmont Ranger Station (H), Camp Rock Campsite (I), Dripping Spring Mountain Campsite (J), Injun Creek Campsite (K), King Branch Campsite (L), Lower Buckeye Gap Campsite (M), Lower Jakes Gap Campsite (N), Marks Cove Campsite (O), Medicine Branch Bluff Campsite (P), Mount Collins Shelter (Q), Porters Flat Campsite (R), Rhododendron Creek Campsite (S), Rough Creek Campsite (T). Display/hide their locations on the map
Shopping Centers: Windmill Towne Shopping Center (1), Village Shopping Center (2), Park Plaza Shopping Center (3), Mountain Mall Shopping Center (4). Display/hide their locations on the map
Churches in zip code 37738 include: Huskey Grove Church (A), Spurgeon Church (B), Banner Church (C), Ringen Memorial Church (D), Roaring Fork Church (E), First Baptist Church (F), First United Methodist Church (G), Gatlinburg Church of Christ (H), Gatlinburg Presbyterian Church (I). Display/hide their locations on the map
Cemeteries: Sutton Cemetery (1), Whitted Cemetery (2), White Oak Flats Cemetery (3), Webbs Creek Cemetery (4), Trentham Cemetery (5), Spurgeon Cemetery (6), Shults-Whaley Cemetery (7). Display/hide their locations on the map
Streams, rivers, and creeks: Mannis Branch (A), Lowes Creek (B), Bird Branch (C), Lost Prong (D), Lost Creek (E), Lookout Branch (F), Big Medicine Branch (G), Log Ridge Branch (H), Lester Prong (I). Display/hide their locations on the map
In group quarters: 198 (-1 institutionalized population)
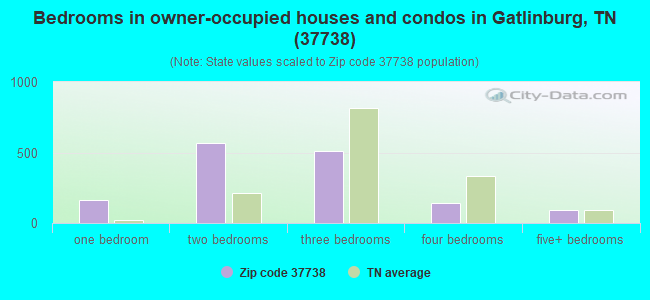
Size of family households: 655 2-persons, 286 3-persons, 232 4-persons, 103 5-persons, 15 6-persons, 7 7-or-more-persons
Size of nonfamily households: 617 1-person, 159 2-persons, 8 3-persons
617 married couples with children.
144 single-parent households (93 men, 51 women).
85.9% of residents of 37738 zip code speak English at home.
9.0% of residents speak Spanish at home (43% very well, 32% well, 21% not well, 4% not at all).
2.3% of residents speak other Indo-European language at home (97% very well, 3% well).
2.8% of residents speak Asian or Pacific Island language at home (41% very well, 53% well, 6% not well).
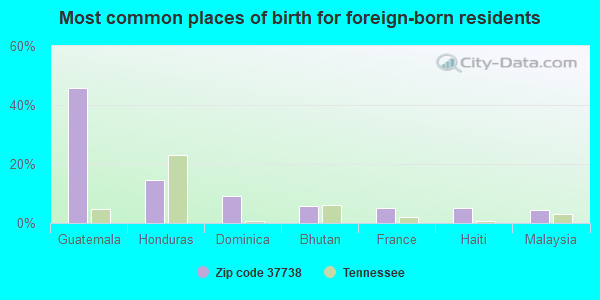
Foreign born population: 694 (13.1%) (19.4% of them are naturalized citizens)
This zip code:
13.1%
Whole state:
5.6%
46%Guatemala
15%Honduras
9%Dominica
6%Bhutan
5%France
5%Haiti
4%Malaysia
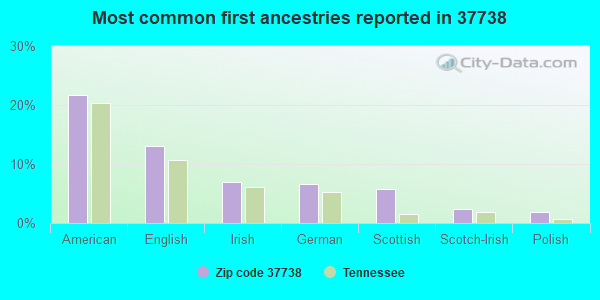
22%American
13%English
7%Irish
7%German
6%Scottish
2%Scotch-Irish
2%Polish
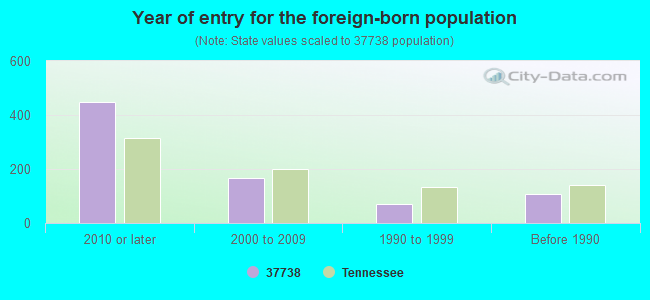
Year of entry for the foreign-born population
4472010 or later
1652000 to 2009
701990 to 1999
107Before 1990
Facilities with environmental interests located in this zip code:
APPALACHIAN CRAFT CAULDRON (REAGAN TERRACE MALL in GATLINBURG, TN)
(Resource Conservation and Recovery Act (tracking hazardous waste))
AYRES JIM LTD (PO BOX 296 in GATLINBURG, TN)
(Resource Conservation and Recovery Act (tracking hazardous waste)) Business NAICS classification: JEWELRY (EXCEPT COSTUME) MANUFACTURING.
BUCKHORN PRESS (PO BOX 407 in GATLINBURG, TN)
(Resource Conservation and Recovery Act (tracking hazardous waste))
CANDLE ESSENCE (RURAL RT 1 in GATLINBURG, TN)
(Resource Conservation and Recovery Act (tracking hazardous waste)) Business NAICS classification: ALL OTHER MISCELLANEOUS MANUFACTURING.
CANDLE SHOP (PARKWAY in GATLINBURG, TN)
(Resource Conservation and Recovery Act (tracking hazardous waste)) Business NAICS classification: ALL OTHER MISCELLANEOUS MANUFACTURING.; ALL OTHER MISCELLANEOUS STORE RETAILERS (EXCEPT TOBACCO STORES).
CANDLES BY CAROLE (BOX 716 in GATLINBURG, TN)
(Resource Conservation and Recovery Act (tracking hazardous waste)) Business NAICS classification: ALL OTHER MISCELLANEOUS MANUFACTURING.; ALL OTHER MISCELLANEOUS STORE RETAILERS (EXCEPT TOBACCO STORES).
CITY OF GATLINBURG - WASTEWATER TREATMEN (175 AIRPORT ROAD in GATLINBURG, TN)
(Resource Conservation and Recovery Act (tracking hazardous waste))
CRESCENT PRTG CO GATLINBURG (BASKINS CREEK ROAD in GATLINBURG, TN)
(Resource Conservation and Recovery Act (tracking hazardous waste)) Business NAICS classification: COMMERCIAL LITHOGRAPHIC PRINTING.
CROSS ROADS PUBLICATIONS INC (805 PARKWAY in GATLINBURG, TN)
(Resource Conservation and Recovery Act (tracking hazardous waste)) Business NAICS classification: BOOK STORES.
Housing units lacking complete plumbing facilities: 1.3% Housing units lacking complete kitchen facilities: 2.0%
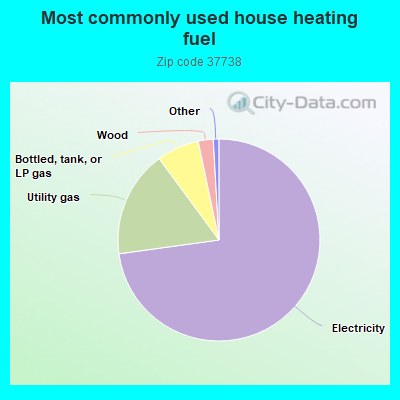
72.9%Electricity
17.1%Utility gas
6.8%Bottled, tank, or LP gas
2.4%Wood
Population in 1990: 4,352. Population change in the 1990s: +629 (+14.5%).
Place of birth for U.S.-born residents:
This state: 2,524
Northeast: 409
Midwest: 560
South: 918
West: 142
56% of the 37738 zip code residents lived in the same house 5 years ago. Out of people who lived in different houses, 43% lived in this county. Out of people who lived in different counties, 50% lived in Tennessee.
88% of the 37738 zip code residents lived in the same house 1 year ago. Out of people who lived in different houses, 21% moved from this county. Out of people who lived in different houses, 33% moved from different county within same state. Out of people who lived in different houses, 47% moved from different state. Out of people who lived in different houses, 2% moved from abroad.
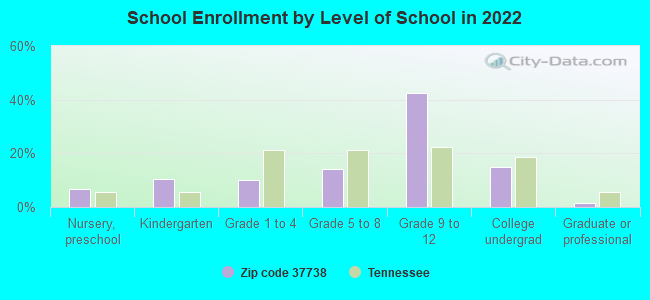
Private vs. public school enrollment:
Students in private schools in grades 1 to 8 (elementary and middle school): 21
Here:
7.5%
Tennessee:
15.0%
Students in private schools in grades 9 to 12 (high school): 5
Here:
1.2%
Tennessee:
16.2%
Students in private undergraduate colleges: 67
Here:
39.0%
Tennessee:
23.5%
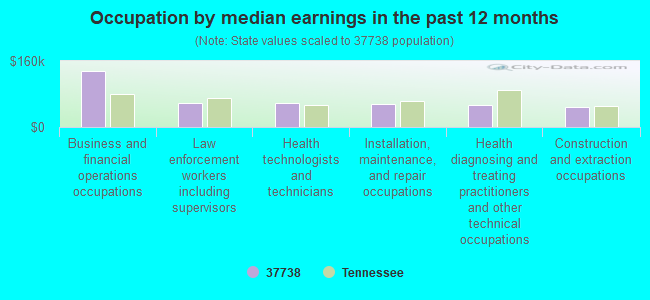
Occupation by median earnings in the past 12 months ($)
135,291Business and financial operations occupations
58,814Law enforcement workers including supervisors
57,812Health technologists and technicians
55,166Installation, maintenance, and repair occupations
52,720Health diagnosing and treating practitioners and other technical occupations
47,952Construction and extraction occupations
Top industries in this zip code by the number of employees in 2005:
Detailed PMIC statistics for the following Tracts:0807.00
, 0811.00
2002 - 2018 National Fire Incident Reporting System (NFIRS) incidents
Based on the data from the years 2002 - 2018 the average number of fire incidents per year is 180. The highest number of reported fire incidents - 1,790 took place in 2016, and the least - 16 in 2017. The data has a declining trend.
When looking into fire subcategories, the most reports belonged to: Structure Fires (72.2%), and Outside Fires (19.8%).
Fire incident types reported to NFIRS in Zip Code 37738
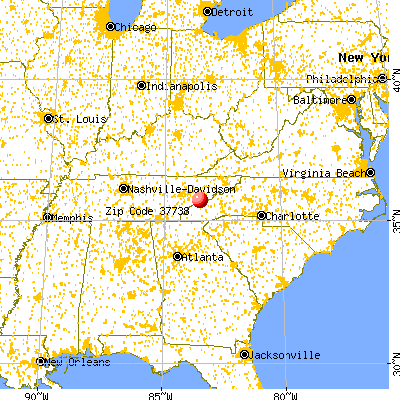


 Nearest zip codes: 37863, 37862, 37876, 28719, 28702, 28713.
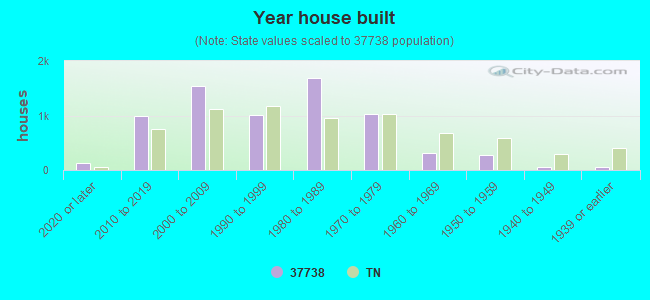


 Based on the data from the years 2002 - 2018 the average number of fire incidents per year is 180. The highest number of reported fire incidents - 1,790 took place in 2016, and the least - 16 in 2017. The data has a declining trend.
 When looking into fire subcategories, the most reports belonged to: Structure Fires (72.2%), and Outside Fires (19.8%).