Estimated zip code population in 2022: 21,141 Zip code population in 2010: 21,309 Zip code population in 2000: 20,063
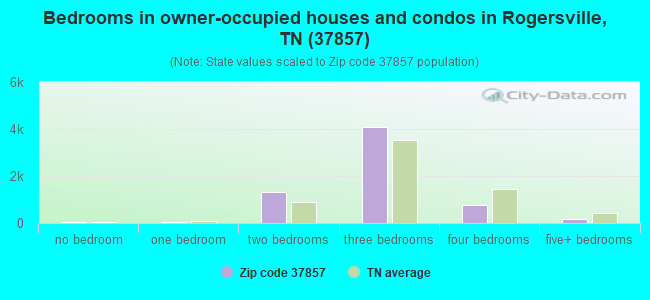
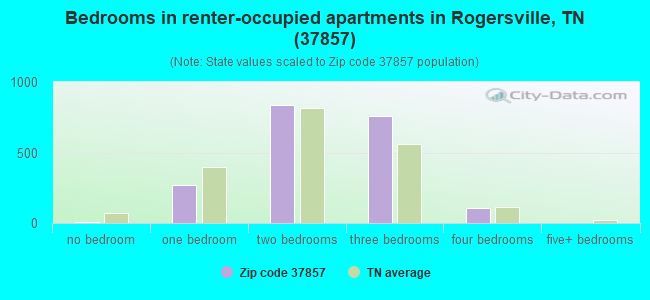
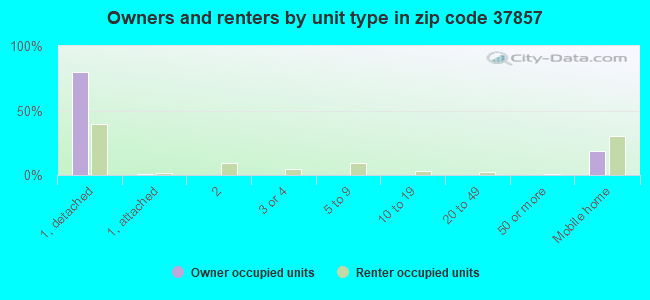
Houses and condos: 9,981 Renter-occupied apartments: 1,994
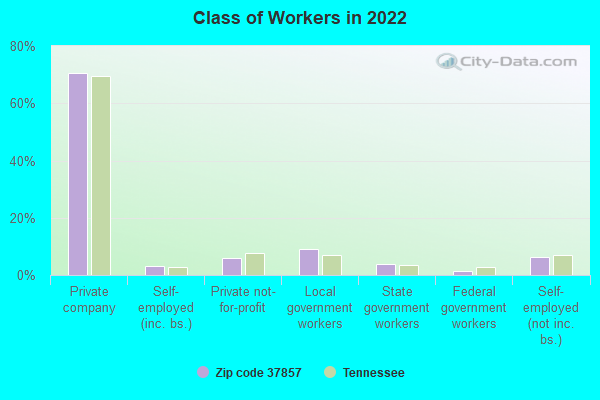
% of renters here:
24%
State:
33%
March 2022 cost of living index in zip code 37857: 78.8 (low, U.S. average is 100)
Land area: 236.9 sq. mi. Water area: 3.5 sq. mi.
Population density: 89 people per square mile
(very low).
OSM Map
General Map
Google Map
MSN Map
OSM Map
General Map
Google Map
MSN Map
OSM Map
General Map
Google Map
MSN Map
OSM Map
General Map
Google Map
MSN Map
Please wait while loading the map...
Real estate property taxes paid for housing units in 2022:
This zip code:
0.5% ($876)
Tennessee:
0.5% ($1,376)
Median real estate property taxes paid for housing units with mortgages in 2022: $943 (0.5%) Median real estate property taxes paid for housing units with no mortgage in 2022: $747 (0.5%)
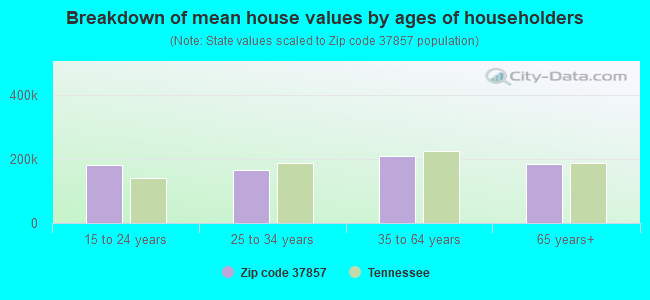
Estimated median house/condo value in 2022: $179,396
37857:
$179,396
Tennessee:
$284,800
According to our research of Tennessee and other state lists, there were 41 registered sex offenders living in 37857 zip code as of April 27, 2024. The ratio of all residents to sex offenders in zip code 37857 is 512 to 1. The ratio of registered sex offenders to all residents in this zip code is lower than the state average.
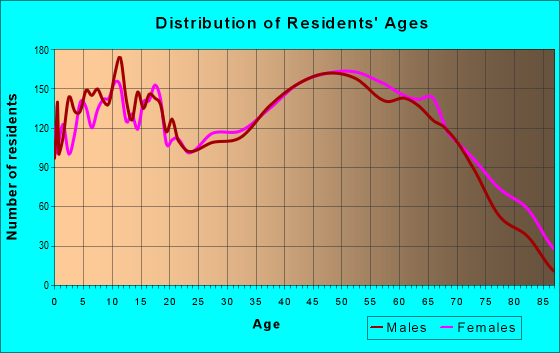
Median resident age:
This zip code:
46.9 years
Tennessee median age:
39.2 years
Average household size:
This zip code:
2.5 people
Tennessee:
2.4 people
Averages for the 2020 tax year for zip code 37857, filed in 2021:
Average Adjusted Gross Income (AGI) in 2020: $46,129 (Individual Income Tax Returns)
Here:
$46,129
State:
$69,014
Salary/wage: $40,935 (reported on 79.0% of returns)
Here:
$40,935
State:
$55,872
(% of AGI for various income ranges: 999.2% for AGIs below $25k, 3235.9% for AGIs $25k-50k, 5803.3% for AGIs $50k-75k, 8435.7% for AGIs $75k-100k, 13114.3% for AGIs $100k-200k, 41462.0% for AGIs over 200k)
Taxable interest for individuals: $1,043 (reported on 34.4% of returns)
This zip code:
$1,043
Tennessee:
$1,945
(% of AGI for various income ranges: 19.3% for AGIs below $25k, 23.4% for AGIs $25k-50k, 55.8% for AGIs $50k-75k, 84.7% for AGIs $75k-100k, 124.9% for AGIs $100k-200k, 942.0% for AGIs over 200k)
Ordinary dividends: $3,518 (reported on 10.0% of returns)
Here:
$3,518
State:
$8,105
(% of AGI for various income ranges: 9.1% for AGIs below $25k, 16.0% for AGIs $25k-50k, 28.9% for AGIs $50k-75k, 65.5% for AGIs $75k-100k, 132.2% for AGIs $100k-200k, 2404.0% for AGIs over 200k)
Net capital gain/loss in AGI: +$12,395 (reported on 9.1% of returns)
Here:
+$12,395
State:
+$33,664
(% of AGI for various income ranges: 6.8% for AGIs below $25k, 30.7% for AGIs $25k-50k, 35.1% for AGIs $50k-75k, 161.0% for AGIs $75k-100k, 411.8% for AGIs $100k-200k, 11588.0% for AGIs over 200k)
Profit/loss from business: +$12,462 (reported on 13.7% of returns)
Here:
+$12,462
State:
+$18,991
(% of AGI for various income ranges: 145.0% for AGIs below $25k, 111.8% for AGIs $25k-50k, 147.5% for AGIs $50k-75k, 204.7% for AGIs $75k-100k, 689.6% for AGIs $100k-200k, 5070.0% for AGIs over 200k)
Taxable individual retirement arrangement distribution: $16,781 (reported on 9.1% of returns)
37857:
$16,781
Tennessee:
$20,036
(% of AGI for various income ranges: 63.0% for AGIs below $25k, 116.2% for AGIs $25k-50k, 254.8% for AGIs $50k-75k, 297.2% for AGIs $75k-100k, 790.8% for AGIs $100k-200k, 2494.0% for AGIs over 200k)
Total itemized deductions: $34,274 (reported on 2.2% of returns)
Here:
$34,274
State:
$40,136
(% of AGI for various income ranges: 80.7% for AGIs $25k-50k, 90.9% for AGIs $50k-75k, 110.3% for AGIs $75k-100k, 266.1% for AGIs $100k-200k, 4174.0% for AGIs over 200k)
Charity contributions: $14,679 (reported on 1.6% of returns)
Here:
$14,679
State:
$19,852
(% of AGI for various income ranges: 10.0% for AGIs $25k-50k, 18.0% for AGIs $50k-75k, 37.3% for AGIs $75k-100k, 85.9% for AGIs $100k-200k, 2088.0% for AGIs over 200k)
Taxes paid: $5,406 (reported on 2.1% of returns)
37857:
$5,406
State:
$6,038
(% of AGI for various income ranges: 6.7% for AGIs $25k-50k, 17.2% for AGIs $50k-75k, 20.5% for AGIs $75k-100k, 52.2% for AGIs $100k-200k, 602.0% for AGIs over 200k)
Earned income credit: $2,473 (reported on 23.3% of returns)
Here:
$2,473
State:
$2,391
(% of AGI for various income ranges: 116.9% for AGIs below $25k, 82.0% for AGIs $25k-50k, 1.5% for AGIs $50k-75k)
Percentage of individuals using paid preparers for their 2020 taxes: 95.0%
Here:
95%
State:
93%
(% for various income ranges: 94.1% for AGIs below $25k, 96.2% for AGIs $25k-50k, 95.0% for AGIs $50k-75k, 94.9% for AGIs $75k-100k, 95.9% for AGIs $100k-200k, 91.7% for AGIs over 200k)
Averages for the 2012 tax year for zip code 37857, filed in 2013:
Average Adjusted Gross Income (AGI) in 2012: $37,686 (Individual Income Tax Returns)
Here:
$37,686
State:
$53,767
Salary/wage: $34,114 (reported on 81.0% of returns)
Here:
$34,114
State:
$45,421
(% of AGI for various income ranges: 68.9% for AGIs below $25k, 79.0% for AGIs $25k-50k, 79.6% for AGIs $50k-75k, 78.2% for AGIs $75k-100k, 69.0% for AGIs $100k-200k, 45.7% for AGIs over 200k)
Taxable interest for individuals: $1,169 (reported on 30.1% of returns)
This zip code:
$1,169
Tennessee:
$1,732
(% of AGI for various income ranges: 1.6% for AGIs below $25k, 0.6% for AGIs $25k-50k, 0.8% for AGIs $50k-75k, 0.9% for AGIs $75k-100k, 1.2% for AGIs $100k-200k, 0.6% for AGIs over 200k)
Ordinary dividends: $2,954 (reported on 9.6% of returns)
Here:
$2,954
State:
$6,739
(% of AGI for various income ranges: 0.7% for AGIs below $25k, 0.4% for AGIs $25k-50k, 0.6% for AGIs $50k-75k, 0.6% for AGIs $75k-100k, 1.1% for AGIs $100k-200k, 2.2% for AGIs over 200k)
Net capital gain/loss in AGI: +$4,871 (reported on 9.6% of returns)
Here:
+$4,871
State:
+$19,082
(% of AGI for various income ranges: 0.3% for AGIs below $25k, 0.1% for AGIs $25k-50k, 0.4% for AGIs $50k-75k, 0.6% for AGIs $75k-100k, 2.1% for AGIs $100k-200k, 8.7% for AGIs over 200k)
Profit/loss from business: +$11,742 (reported on 14.8% of returns)
Here:
+$11,742
State:
+$15,240
(% of AGI for various income ranges: 10.9% for AGIs below $25k, 3.2% for AGIs $25k-50k, 1.4% for AGIs $50k-75k, 1.6% for AGIs $75k-100k, 10.7% for AGIs $100k-200k)
Taxable individual retirement arrangement distribution: $13,731 (reported on 9.6% of returns)
37857:
$13,731
Tennessee:
$15,505
(% of AGI for various income ranges: 4.0% for AGIs below $25k, 3.3% for AGIs $25k-50k, 2.9% for AGIs $50k-75k, 3.6% for AGIs $75k-100k, 6.0% for AGIs $100k-200k)
Total itemized deductions: $19,132 (23% of AGI, reported on 12.0% of returns)
Here:
$19,132
State:
$21,976
Here:
22.5% of AGI
State:
17.8% of AGI
(% of AGI for various income ranges: 4.4% for AGIs below $25k, 4.9% for AGIs $25k-50k, 6.0% for AGIs $50k-75k, 7.2% for AGIs $75k-100k, 8.4% for AGIs $100k-200k, 6.7% for AGIs over 200k)
Charity contributions: $5,172 (reported on 8.4% of returns)
Here:
$5,172
State:
$6,709
(% of AGI for various income ranges: 0.3% for AGIs below $25k, 0.7% for AGIs $25k-50k, 0.9% for AGIs $50k-75k, 1.4% for AGIs $75k-100k, 1.9% for AGIs $100k-200k, 3.1% for AGIs over 200k)
Taxes paid: $3,623 (reported on 11.6% of returns)
37857:
$3,623
State:
$4,829
(% of AGI for various income ranges: 0.5% for AGIs below $25k, 0.7% for AGIs $25k-50k, 1.0% for AGIs $50k-75k, 1.4% for AGIs $75k-100k, 2.0% for AGIs $100k-200k, 1.6% for AGIs over 200k)
Earned income credit: $2,366 (reported on 28.2% of returns)
Here:
$2,366
State:
$2,404
(% of AGI for various income ranges: 8.8% for AGIs below $25k, 1.5% for AGIs $25k-50k)
Percentage of individuals using paid preparers for their 2012 taxes: 58.8%
Here:
59%
State:
52%
(% for various income ranges: 56.8% for AGIs below $25k, 58.7% for AGIs $25k-50k, 61.3% for AGIs $50k-75k, 58.9% for AGIs $75k-100k, 71.4% for AGIs $100k-200k, 80.0% for AGIs over 200k)
Averages for the 2004 tax year for zip code 37857, filed in 2005:
Average Adjusted Gross Income (AGI) in 2004: $32,097 (Individual Income Tax Returns)
Here:
$32,097
State:
$44,088
Salary/wage: $31,064 (reported on 84.7% of returns)
Here:
$31,064
State:
$38,825
(% of AGI for various income ranges: 104.3% for AGIs below $10k, 78.2% for AGIs $10k-25k, 86.3% for AGIs $25k-50k, 83.5% for AGIs $50k-75k, 81.8% for AGIs $75k-100k, 70.4% for AGIs over 100k)
Taxable interest for individuals: $1,443 (reported on 36.7% of returns)
This zip code:
$1,443
Tennessee:
$1,802
(% of AGI for various income ranges: 5.8% for AGIs below $10k, 2.5% for AGIs $10k-25k, 1.4% for AGIs $25k-50k, 0.9% for AGIs $50k-75k, 1.6% for AGIs $75k-100k, 1.6% for AGIs over 100k)
Taxable dividends: $2,054 (reported on 14.9% of returns)
Here:
$2,054
State:
$3,727
(% of AGI for various income ranges: 1.4% for AGIs below $10k, 0.6% for AGIs $10k-25k, 0.5% for AGIs $25k-50k, 0.7% for AGIs $50k-75k, 0.9% for AGIs $75k-100k, 2.7% for AGIs over 100k)
Net capital gain/loss: +$7,331 (reported on 9.0% of returns)
Here:
+$7,331
State:
+$15,776
(% of AGI for various income ranges: 1.1% for AGIs below $10k, 0.4% for AGIs $10k-25k, 0.7% for AGIs $25k-50k, 0.8% for AGIs $50k-75k, 1.9% for AGIs $75k-100k, 8.9% for AGIs over 100k)
Profit/loss from business: +$7,602 (reported on 14.8% of returns)
Here:
+$7,602
State:
+$12,882
(% of AGI for various income ranges: 8.5% for AGIs below $10k, 5.0% for AGIs $10k-25k, 2.0% for AGIs $25k-50k, 1.5% for AGIs $50k-75k, 2.1% for AGIs $75k-100k, 8.5% for AGIs over 100k)
IRA payment deduction: $2,970 (reported on 1.2% of returns)
37857:
$2,970
Tennessee:
$2,934
(% of AGI for various income ranges: 0.1% for AGIs $10k-25k, 0.2% for AGIs $25k-50k, 0.1% for AGIs $50k-75k, 0.2% for AGIs $75k-100k)
Self-employed pension: $11,133 (reported on 0.2% of returns)
Here:
$11,133
Tennessee:
$16,857
Total itemized deductions: $16,038 (26% of AGI, reported on 12.2% of returns)
Here:
$16,038
State:
$18,035
Here:
26.1% of AGI
State:
19.9% of AGI
(% of AGI for various income ranges: 4.2% for AGIs below $10k, 4.1% for AGIs $10k-25k, 5.5% for AGIs $25k-50k, 7.1% for AGIs $50k-75k, 8.4% for AGIs $75k-100k, 6.6% for AGIs over 100k)
Charity contributions deductions: $3,996 (6% of AGI, reported on 9.5% of returns)
Here:
$3,996
State:
$5,167
Here:
6.1% of AGI
State:
5.3% of AGI
(% of AGI for various income ranges: 0.3% for AGIs below $10k, 0.4% for AGIs $10k-25k, 0.8% for AGIs $25k-50k, 1.2% for AGIs $50k-75k, 1.9% for AGIs $75k-100k, 2.4% for AGIs over 100k)
Total tax: $4,197 (reported on 68.7% of returns)
37857:
$4,197
State:
$7,482
(% of AGI for various income ranges: 3.5% for AGIs below $10k, 3.6% for AGIs $10k-25k, 6.0% for AGIs $25k-50k, 8.3% for AGIs $50k-75k, 10.9% for AGIs $75k-100k, 21.6% for AGIs over 100k)
Earned income credit: $1,802 (reported on 24.5% of returns)
Here:
$1,802
State:
$1,826
Percentage of individuals using paid preparers for their 2004 taxes: 67.9%
Here:
68%
State:
60%
(% for various income ranges: 63.4% for AGIs below $10k, 70.6% for AGIs $10k-25k, 68.6% for AGIs $25k-50k, 67.4% for AGIs $50k-75k, 64.8% for AGIs $75k-100k, 75.6% for AGIs over 100k)
Likely homosexual households (counted as self-reported same-sex unmarried-partner households)
Lesbian couples: 0.2% of all households
Gay men: 0.0% of all households
Household received Food Stamps/SNAP in the past 12 months: 1,318 Household did not receive Food Stamps/SNAP in the past 12 months: 7,078
Women who had a birth in the past 12 months: 195 (126 now married, 68 unmarried) Women who did not have a birth in the past 12 months: 4,004 (1,850 now married, 2,154 unmarried)
Housing units in zip code 37857 with a mortgage: 3,139 (182 second mortgage, 9 home equity loan, 110 both second mortgage and home equity loan) Houses without a mortgage: 43
Median monthly owner costs for units with a mortgage: $1,071 Median monthly owner costs for units without a mortgage: $318
Residents with income below the poverty level in 2022:
This zip code:
17.0%
Whole state:
13.3%
Residents with income below 50% of the poverty level in 2022:
This zip code:
8.8%
Whole state:
7.1%
Median number of rooms in houses and condos:
Here:
5.9
State:
6.5
Median number of rooms in apartments:
Here:
4.5
State:
4.4
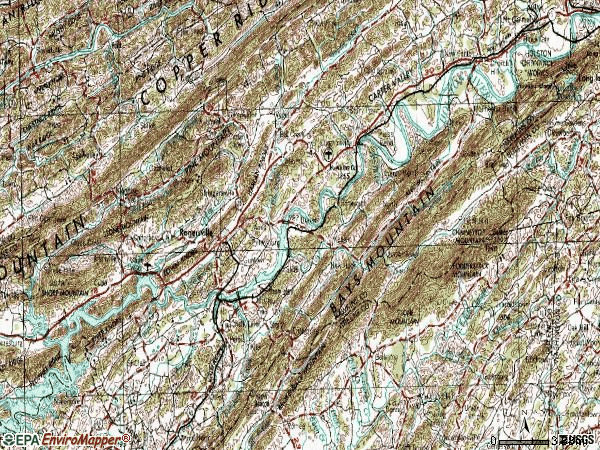
Notable locations in this zip code not listed on our city pages
Notable locations in zip code 37857: Hawkins County Milestone (A), Kite (B), Melody Orchard (C), Slide (D), Light Mill (E), North Fork (F), Dykes Store (G), Marble Hall (H), McDonald Golf Club (I), Yellow Store (J), Persia Volunteer Fire Department (K), Hawkins County Rescue Squad (L), Rogersville Fire Department (M), Goshen Valley Volunteer Fire Department Station 2 (N), Striggersville Volunteer Fire Department Station 2 (O), Striggersville Volunteer Fire Department Station 1 (P), John Sevier Steam Plant (Q), Rogersville Fire Department Station 1 (R), Rogersville City Hall (S), Hawkins County Jail (T). Display/hide their locations on the map
Churches in zip code 37857 include: Price Grove Church (A), Freewill Church (B), Providence Church (C), Choptack Baptist Church (D), Spires Chapel (E), Liberty Church (F), Spruce Pine Church (G), Dodson Creek Church (H), Sulphur Springs Church (I). Display/hide their locations on the map
Cemeteries: Strahl Cemetery (1), Hunter Cemetery (2), Tarter Cemetery (3), Self Cemetery (4), Jake Jones Cemetery (5), Tunnel Cemetery (6), Tunnel Hill Cemetery (7). Display/hide their locations on the map
Lakes and reservoirs: Heck Pond (A), Clearwater Pond (B), Beal Pond (C), Cantrell Pond (D), Pressmens Home Lake (E), John Sevier Detention Reservoir (F), Burem Lake (G). Display/hide their locations on the map
Streams, rivers, and creeks: Louderback Creek (A), Little Poor Valley Creek (B), Big Creek (C), Limestone Branch (D), Lickskillet Branch (E), Laurel Branch (F), Heck Hollow Branch (G), Heck Branch (H), Tarpine Valley Branch (I). Display/hide their locations on the map
In group quarters: 374 (-1 institutionalized population)
Size of family households: 2,983 2-persons, 1,752 3-persons, 678 4-persons, 395 5-persons, 121 6-persons, 28 7-or-more-persons
Size of nonfamily households: 2,127 1-person, 287 2-persons, 46 4-persons
1,783 married couples with children.
1,103 single-parent households (404 men, 699 women).
97.4% of residents of 37857 zip code speak English at home.
1.8% of residents speak Spanish at home (75% very well, 23% well, 2% not well).
0.5% of residents speak other Indo-European language at home (67% very well, 33% not well).
0.1% of residents speak Asian or Pacific Island language at home (71% very well, 29% well).
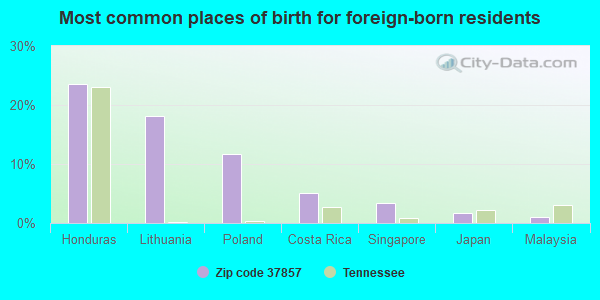
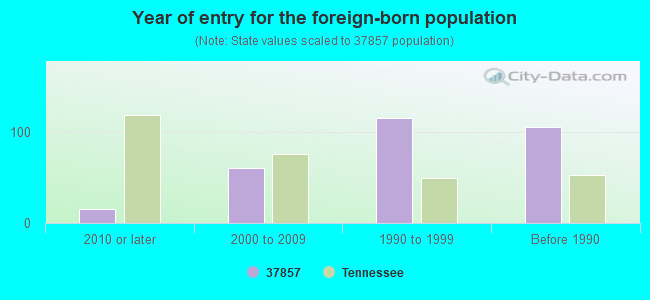
Foreign born population: 292 (1.4%) (30.7% of them are naturalized citizens)
This zip code:
1.4%
Whole state:
5.6%
24%Honduras
18%Lithuania
12%Poland
5%Costa Rica
3%Singapore
2%Japan
1%Malaysia
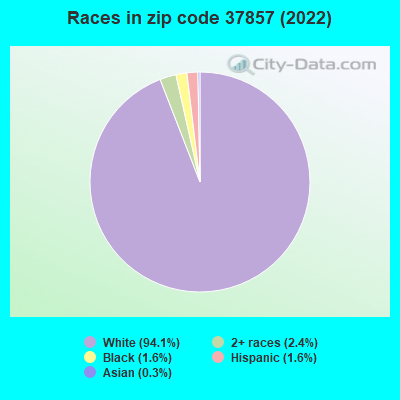
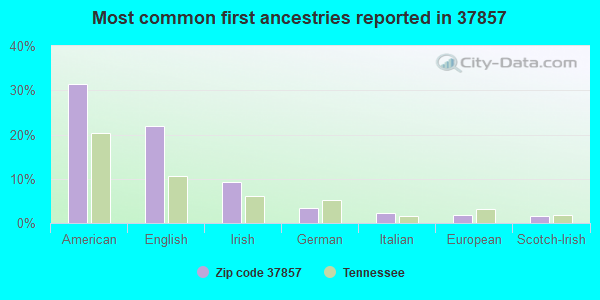
31%American
22%English
9%Irish
3%German
2%Italian
2%European
2%Scotch-Irish
Year of entry for the foreign-born population
152010 or later
612000 to 2009
1161990 to 1999
106Before 1990
Facilities with environmental interests located in this zip code:
ASSURED CASTINGS CORPORATION (300 INDUSTRIAL PARK RD. in ROGERSVILLE, TN)
AIR MINOR (AIRS/AFS) (Resource Conservation and Recovery Act (tracking hazardous waste)) TRI REPORTER (Tracking of toxic chemicals releasing facilities) Business SIC classification: ALUMINUM DIE-CASTINGS Business NAICS classification: ALUMINUM DIE-CASTING FOUNDRIES. Organizations: JOHN SLAVEN (CONTACT/OPERATOR)
, LEGGETT & PLATT CORPORATION (CONTACT/OWNER)
Alternative names: ASSURED CASTING CORPORATION
CHEROKEE HIGH SCHOOL (2927 HWY 66 in ROGERSVILLE, TN)
(Geographic Names Information System) (National Center for Education Statistics) - STATE ID-0017 Organizations: HAWKINS COUNTY SCHOOL DISTRICT (SCHOOL DISTRICT)
COLLIERS CLEANERS, WAYNE ROSE, INC. (213 S. DEPOT STREET in ROGERSVILLE, TN)
AIR MINOR (AIRS/AFS) Conditionally Exempt Small Quantity Generators, less than 100 kg/month of hazardous waste (Resource Conservation and Recovery Act (tracking hazardous waste)) - notification Business SIC classification: COIN-OPERATED LAUNDRIES AND DRYCLEANING Business NAICS classification: LINEN SUPPLY. Organizations: JAMES M. COLLIER (CONTACT/OPERATOR)
, DAVID WATSON (CONTACT/OPERATOR)
, WAYNE ROSE INC. (CONTACT/OWNER)
Alternative names: COLLIER'S CLEANERS INC
CHEROKEE COMPR. HIGH SCHOOL (2927 HWY 68 SOUTH in ROGERSVILLE, TN)
National Pollutant Discharge Elimination System NON-MAJOR (Tracking pollutant discharge elimination systems) - permit Business SIC classification: SEWERAGE SYSTEMS Organizations: HAWKINS COUNTY BOARD OF EDUCAT (CONTACT/OWNER)
Alternative names: HAWKINS CO-CHEROKEE COMP. HS, HAWKINS CTY BOARD OF EDUCATION
AVERY-DENNISON (530 WEST MAIN STREET in ROGERSVILLE, TN)
AIR MINOR (AIRS/AFS) Business SIC classification: OIL AND GAS FIELD SERVICES
CLOUD # 9 ENTERPRISE (135 MORELAND ROAD in ROGERSVILLE, TN)
AIR MINOR (AIRS/AFS) Business SIC classification: READY-MIXED CONCRETE
APAC-TENNESSEE, INC./KNOXVILLE DIV. (415 SHEPARDS CHAPEL ROAD in ROGERSVILLE, TN)
AIR SYNTHETIC MINOR (AIRS/AFS) COMPLIANCE ACTIVITY (Tracking inspections of insecticide, fungicide, and rodenticide, and toxic substances) Business SIC classification: ASPHALT PAVING MIXTURES AND BLOCKS Alternative names: APAC TENNESSEE ROGERSVILLE PLANT
Housing units lacking complete plumbing facilities: 4.3% Housing units lacking complete kitchen facilities: 4.6%
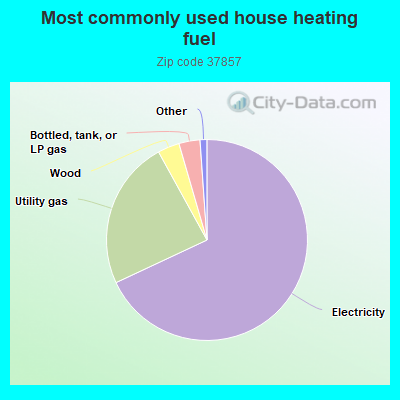
68.1%Electricity
24.0%Utility gas
3.5%Wood
3.4%Bottled, tank, or LP gas
Population in 1990: 10,374. Population change in the 1990s: +9,689 (+93.4%).
Place of birth for U.S.-born residents:
This state: 14,842
Northeast: 656
Midwest: 1,155
South: 3,771
West: 224
65% of the 37857 zip code residents lived in the same house 5 years ago. Out of people who lived in different houses, 63% lived in this county. Out of people who lived in different counties, 50% lived in Tennessee.
94% of the 37857 zip code residents lived in the same house 1 year ago. Out of people who lived in different houses, 51% moved from this county. Out of people who lived in different houses, 22% moved from different county within same state. Out of people who lived in different houses, 32% moved from different state.
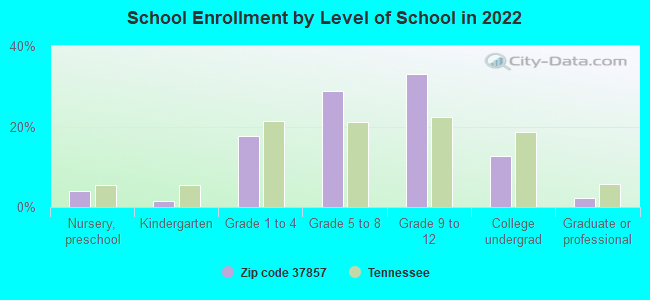
Private vs. public school enrollment:
Students in private schools in grades 1 to 8 (elementary and middle school): 160
Here:
9.7%
Tennessee:
15.0%
Students in private schools in grades 9 to 12 (high school): 34
Here:
2.9%
Tennessee:
16.2%
Students in private undergraduate colleges: 22
Here:
4.8%
Tennessee:
23.5%
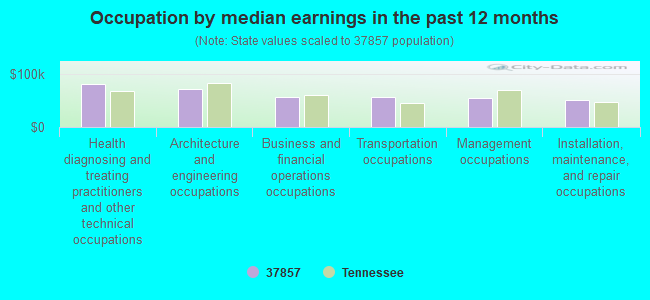
Occupation by median earnings in the past 12 months ($)
80,072Health diagnosing and treating practitioners and other technical occupations
70,502Architecture and engineering occupations
57,030Business and financial operations occupations
56,519Transportation occupations
55,413Management occupations
51,389Installation, maintenance, and repair occupations
Companies with federal contracts located in this zip code:
PURVIS, ROBERT W DDS (313 W BROADWAY ST in ROGERSVILLE, TN; small business) : $10,668 in 3 contractsin 2004
$5,880 with Army for Dentistry Services. Signed on 2004-06-01. Completion date: 2004-06-18.
$4,712, same as above.Signed on 2004-03-26. Completion date: 2004-04-02.
$76, same as above.Signed on 2004-04-22. Completion date: 2004-04-02.
Top industries in this zip code by the number of employees in 2005:
2002 - 2018 National Fire Incident Reporting System (NFIRS) incidents
Based on the data from the years 2002 - 2018 the average number of fire incidents per year is 95. The highest number of reported fires - 246 took place in 2007, and the least - 18 in 2015. The data has a declining trend.
When looking into fire subcategories, the most incidents belonged to: Structure Fires (55.3%), and Outside Fires (31.0%).
Fire incident types reported to NFIRS in Zip Code 37857
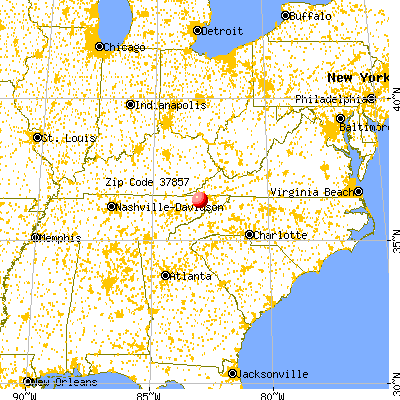


 Nearest zip codes: 37731, 37873, 37711, 37765, 37745, 24221.


 Based on the data from the years 2002 - 2018 the average number of fire incidents per year is 95. The highest number of reported fires - 246 took place in 2007, and the least - 18 in 2015. The data has a declining trend.
 When looking into fire subcategories, the most incidents belonged to: Structure Fires (55.3%), and Outside Fires (31.0%).