Estimated zip code population in 2022: 4,039 Zip code population in 2010: 4,113 Zip code population in 2000: 3,191
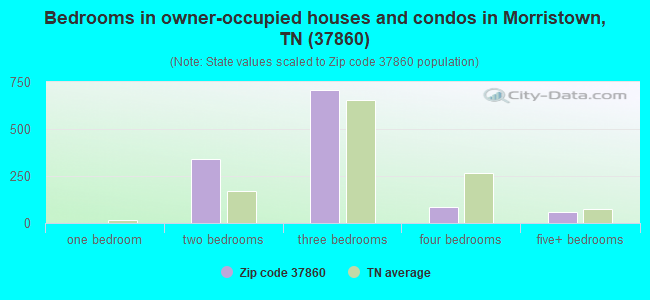
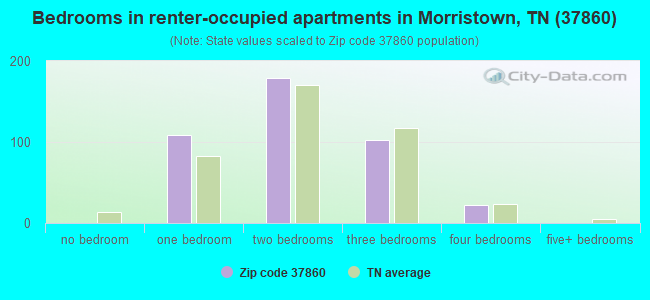
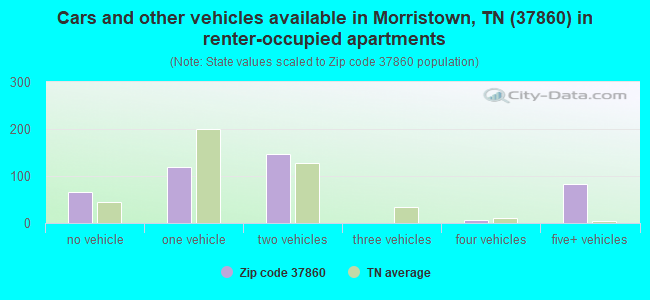
Houses and condos: 1,578 Renter-occupied apartments: 412
% of renters here:
26%
State:
33%
March 2022 cost of living index in zip code 37860: 75.6 (low, U.S. average is 100)
Land area: 25.5 sq. mi. Water area: 2.0 sq. mi.
Population density: 159 people per square mile
(very low).
OSM Map
General Map
Google Map
MSN Map
OSM Map
General Map
Google Map
MSN Map
OSM Map
General Map
Google Map
MSN Map
OSM Map
General Map
Google Map
MSN Map
Please wait while loading the map...
Real estate property taxes paid for housing units in 2022:
This zip code:
0.3% ($610)
Tennessee:
0.5% ($1,376)
Median real estate property taxes paid for housing units with mortgages in 2022: $725 (0.3%) Median real estate property taxes paid for housing units with no mortgage in 2022: $497 (0.4%)
Business Search- 14 Million verified businesses
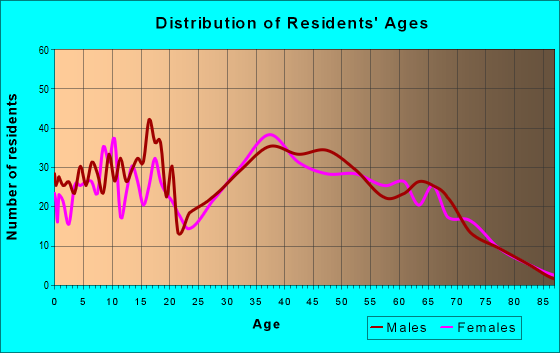
Males: 2,132
(52.8%)
Females: 1,906
(47.2%)
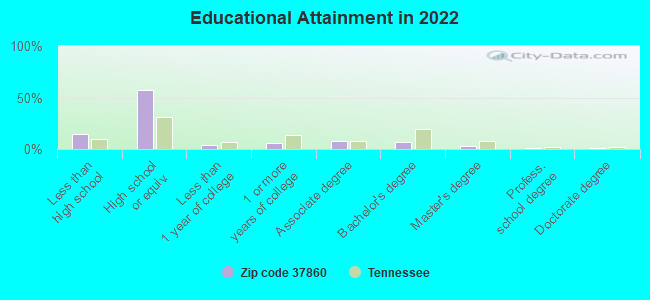
For population 25 years and over in 37860:
High school or higher: 83.4%
Bachelor's degree or higher: 10.8%
Graduate or professional degree: 4.4%
Unemployed: 3.9%
Mean travel time to work (commute): 29.0 minutes
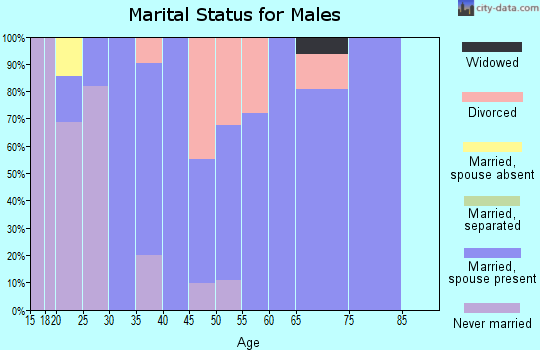
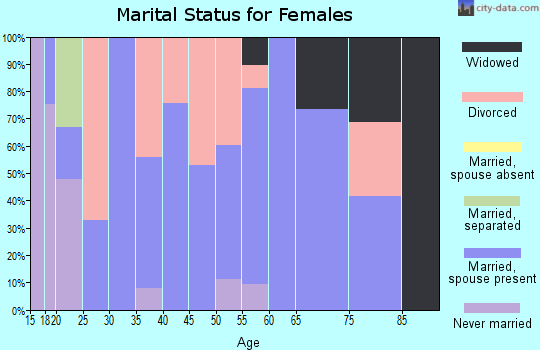
For population 15 years and over in 37860:
Never married: 29.1%
Now married: 53.8%
Separated: 1.0%
Widowed: 10.5%
Divorced: 5.7%
Zip code 37860 compared to state average:
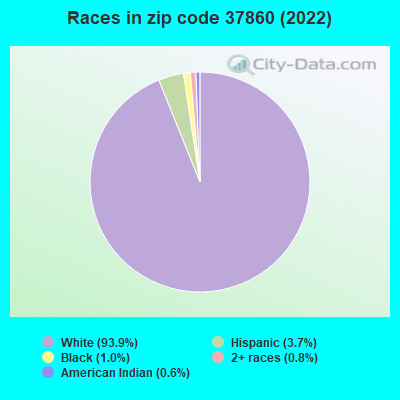
Black race population percentage significantly below state average.
Median age above state average.
Foreign-born population percentage significantly below state average.
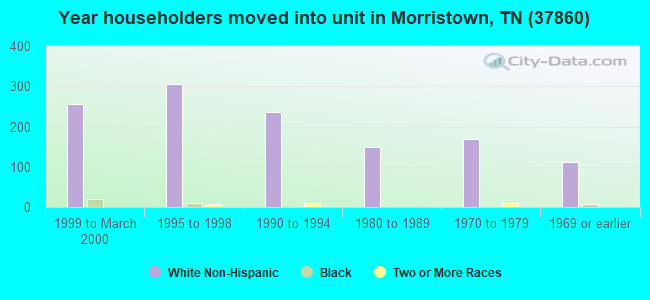
Length of stay since moving in significantly above state average.
Percentage of population with a bachelor's degree or higher significantly below state average.
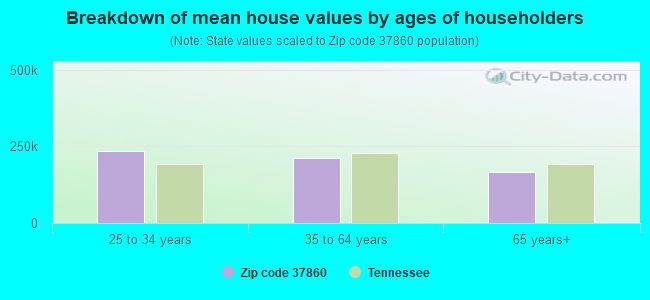
Estimated median house/condo value in 2022: $190,930
37860:
$190,930
Tennessee:
$284,800
According to our research of Tennessee and other state lists, there were 12 registered sex offenders living in 37860 zip code as of April 27, 2024. The ratio of all residents to sex offenders in zip code 37860 is 352 to 1. The ratio of registered sex offenders to all residents in this zip code is near the state average.
Median resident age:
This zip code:
47.0 years
Tennessee median age:
39.2 years
Average household size:
This zip code:
2.5 people
Tennessee:
2.4 people
Averages for the 2020 tax year for zip code 37860, filed in 2021:
Average Adjusted Gross Income (AGI) in 2020: $53,192 (Individual Income Tax Returns)
Here:
$53,192
State:
$69,014
Salary/wage: $48,936 (reported on 85.5% of returns)
Here:
$48,936
State:
$55,872
(% of AGI for various income ranges: 1088.0% for AGIs below $25k, 3538.4% for AGIs $25k-50k, 5847.2% for AGIs $50k-75k, 8919.4% for AGIs $75k-100k, 14398.7% for AGIs $100k-200k, 43930.0% for AGIs over 200k)
Taxable interest for individuals: $1,038 (reported on 24.9% of returns)
This zip code:
$1,038
Tennessee:
$1,945
(% of AGI for various income ranges: 13.3% for AGIs below $25k, 28.0% for AGIs $25k-50k, 19.6% for AGIs $50k-75k, 33.8% for AGIs $75k-100k, 70.0% for AGIs $100k-200k, 480.0% for AGIs over 200k)
Ordinary dividends: $2,500 (reported on 10.4% of returns)
Here:
$2,500
State:
$8,105
(% of AGI for various income ranges: 8.6% for AGIs below $25k, 17.1% for AGIs $25k-50k, 19.6% for AGIs $50k-75k, 27.5% for AGIs $75k-100k, 190.7% for AGIs $100k-200k)
Net capital gain/loss in AGI: +$6,955 (reported on 10.4% of returns)
Here:
+$6,955
State:
+$33,664
(% of AGI for various income ranges: 22.0% for AGIs below $25k, 15.1% for AGIs $25k-50k, 114.0% for AGIs $50k-75k, 46.2% for AGIs $75k-100k, 568.0% for AGIs $100k-200k)
Profit/loss from business: +$7,740 (reported on 13.0% of returns)
Here:
+$7,740
State:
+$18,991
(% of AGI for various income ranges: 110.6% for AGIs below $25k, 75.1% for AGIs $25k-50k, 247.6% for AGIs $50k-75k, 195.0% for AGIs $75k-100k, 68.0% for AGIs $100k-200k)
Taxable individual retirement arrangement distribution: $15,277 (reported on 6.7% of returns)
37860:
$15,277
Tennessee:
$20,036
(% of AGI for various income ranges: 44.3% for AGIs below $25k, 70.2% for AGIs $25k-50k, 210.4% for AGIs $50k-75k, 612.0% for AGIs $100k-200k)
Total itemized deductions: $38,275 (reported on 2.1% of returns)
Here:
$38,275
State:
$40,136
(% of AGI for various income ranges: 1020.7% for AGIs $100k-200k)
Charity contributions: $16,933 (reported on 1.6% of returns)
Here:
$16,933
State:
$19,852
(% of AGI for various income ranges: 338.7% for AGIs $100k-200k)
Taxes paid: $6,767 (reported on 1.6% of returns)
37860:
$6,767
State:
$6,038
(% of AGI for various income ranges: 135.3% for AGIs $100k-200k)
Earned income credit: $2,233 (reported on 18.7% of returns)
Here:
$2,233
State:
$2,391
(% of AGI for various income ranges: 95.9% for AGIs below $25k, 70.0% for AGIs $25k-50k)
Percentage of individuals using paid preparers for their 2020 taxes: 95.9%
Here:
96%
State:
93%
(% for various income ranges: 92.3% for AGIs below $25k, 98.1% for AGIs $25k-50k, 96.7% for AGIs $50k-75k, 100.0% for AGIs $75k-100k, 95.2% for AGIs $100k-200k, 100.0% for AGIs over 200k)
Averages for the 2012 tax year for zip code 37860, filed in 2013:
Average Adjusted Gross Income (AGI) in 2012: $41,439 (Individual Income Tax Returns)
Here:
$41,439
State:
$53,767
Salary/wage: $39,389 (reported on 85.9% of returns)
Here:
$39,389
State:
$45,421
(% of AGI for various income ranges: 74.1% for AGIs below $25k, 85.0% for AGIs $25k-50k, 85.1% for AGIs $50k-75k, 82.8% for AGIs $75k-100k, 77.4% for AGIs $100k-200k)
Taxable interest for individuals: $739 (reported on 24.9% of returns)
This zip code:
$739
Tennessee:
$1,732
(% of AGI for various income ranges: 1.0% for AGIs below $25k, 0.5% for AGIs $25k-50k, 0.2% for AGIs $50k-75k, 0.4% for AGIs $75k-100k, 0.4% for AGIs $100k-200k)
Ordinary dividends: $1,129 (reported on 9.2% of returns)
Here:
$1,129
State:
$6,739
(% of AGI for various income ranges: 0.3% for AGIs below $25k, 0.4% for AGIs $25k-50k, 0.3% for AGIs $75k-100k, 0.2% for AGIs $100k-200k)
Net capital gain/loss in AGI: +$23 (reported on 7.0% of returns)
Here:
+$23
State:
+$19,082
(% of AGI for various income ranges: 0.2% for AGIs $75k-100k)
Profit/loss from business: +$6,388 (reported on 13.5% of returns)
Here:
+$6,388
State:
+$15,240
(% of AGI for various income ranges: 7.8% for AGIs below $25k, 1.6% for AGIs $25k-50k, 1.5% for AGIs $50k-75k, 1.9% for AGIs $75k-100k)
Taxable individual retirement arrangement distribution: $10,067 (reported on 8.1% of returns)
37860:
$10,067
Tennessee:
$15,505
(% of AGI for various income ranges: 2.3% for AGIs below $25k, 1.7% for AGIs $25k-50k, 1.6% for AGIs $50k-75k, 4.3% for AGIs $75k-100k)
Total itemized deductions: $17,258 (23% of AGI, reported on 17.8% of returns)
Here:
$17,258
State:
$21,976
Here:
23.4% of AGI
State:
17.8% of AGI
(% of AGI for various income ranges: 4.8% for AGIs below $25k, 5.8% for AGIs $25k-50k, 7.8% for AGIs $50k-75k, 8.4% for AGIs $75k-100k, 9.4% for AGIs $100k-200k)
Charity contributions: $4,333 (reported on 11.4% of returns)
Here:
$4,333
State:
$6,709
(% of AGI for various income ranges: 0.7% for AGIs $25k-50k, 1.2% for AGIs $50k-75k, 1.1% for AGIs $75k-100k, 2.5% for AGIs $100k-200k)
Taxes paid: $3,006 (reported on 17.8% of returns)
37860:
$3,006
State:
$4,829
(% of AGI for various income ranges: 0.5% for AGIs below $25k, 0.9% for AGIs $25k-50k, 1.2% for AGIs $50k-75k, 1.5% for AGIs $75k-100k, 2.1% for AGIs $100k-200k)
Earned income credit: $2,100 (reported on 23.8% of returns)
Here:
$2,100
State:
$2,404
(% of AGI for various income ranges: 7.7% for AGIs below $25k, 1.1% for AGIs $25k-50k)
Percentage of individuals using paid preparers for their 2012 taxes: 62.7%
Here:
63%
State:
52%
(% for various income ranges: 61.0% for AGIs below $25k, 63.3% for AGIs $25k-50k, 65.5% for AGIs $50k-75k, 63.2% for AGIs $75k-100k, 63.6% for AGIs $100k-200k)
Averages for the 2004 tax year for zip code 37860, filed in 2005:
Average Adjusted Gross Income (AGI) in 2004: $34,515 (Individual Income Tax Returns)
Here:
$34,515
State:
$44,088
Salary/wage: $33,683 (reported on 90.7% of returns)
Here:
$33,683
State:
$38,825
(% of AGI for various income ranges: 94.8% for AGIs below $10k, 82.9% for AGIs $10k-25k, 90.8% for AGIs $25k-50k, 88.2% for AGIs $50k-75k, 91.7% for AGIs $75k-100k, 82.8% for AGIs over 100k)
Taxable interest for individuals: $790 (reported on 32.6% of returns)
This zip code:
$790
Tennessee:
$1,802
(% of AGI for various income ranges: 3.8% for AGIs below $10k, 1.5% for AGIs $10k-25k, 0.7% for AGIs $25k-50k, 0.5% for AGIs $50k-75k, 0.1% for AGIs $75k-100k, 0.5% for AGIs over 100k)
Taxable dividends: $658 (reported on 10.6% of returns)
Here:
$658
State:
$3,727
(% of AGI for various income ranges: 0.2% for AGIs below $10k, 0.2% for AGIs $10k-25k, 0.3% for AGIs $25k-50k, 0.2% for AGIs $50k-75k, 0.1% for AGIs $75k-100k, 0.2% for AGIs over 100k)
Net capital gain/loss: +$1,576 (reported on 7.6% of returns)
Here:
+$1,576
State:
+$15,776
(% of AGI for various income ranges: 1.5% for AGIs below $10k, -0.1% for AGIs $10k-25k, -0.0% for AGIs $25k-50k, 0.7% for AGIs $50k-75k, 0.3% for AGIs $75k-100k, 0.8% for AGIs over 100k)
Profit/loss from business: +$5,379 (reported on 15.2% of returns)
Here:
+$5,379
State:
+$12,882
(% of AGI for various income ranges: 8.8% for AGIs below $10k, 6.2% for AGIs $10k-25k, 2.2% for AGIs $25k-50k, 2.0% for AGIs $50k-75k, -0.1% for AGIs $75k-100k)
IRA payment deduction: $1,812 (reported on 1.8% of returns)
37860:
$1,812
Tennessee:
$2,934
Total itemized deductions: $14,676 (25% of AGI, reported on 18.8% of returns)
Here:
$14,676
State:
$18,035
Here:
24.8% of AGI
State:
19.9% of AGI
(% of AGI for various income ranges: 4.8% for AGIs $10k-25k, 8.0% for AGIs $25k-50k, 8.0% for AGIs $50k-75k, 11.1% for AGIs $75k-100k, 10.9% for AGIs over 100k)
Charity contributions deductions: $3,246 (5% of AGI, reported on 15.0% of returns)
Here:
$3,246
State:
$5,167
Here:
5.2% of AGI
State:
5.3% of AGI
(% of AGI for various income ranges: 0.4% for AGIs $10k-25k, 1.0% for AGIs $25k-50k, 1.5% for AGIs $50k-75k, 2.5% for AGIs $75k-100k, 3.1% for AGIs over 100k)
Total tax: $3,657 (reported on 74.3% of returns)
37860:
$3,657
State:
$7,482
(% of AGI for various income ranges: 3.0% for AGIs below $10k, 4.0% for AGIs $10k-25k, 6.2% for AGIs $25k-50k, 8.4% for AGIs $50k-75k, 10.5% for AGIs $75k-100k, 16.1% for AGIs over 100k)
Earned income credit: $1,711 (reported on 20.6% of returns)
Here:
$1,711
State:
$1,826
Percentage of individuals using paid preparers for their 2004 taxes: 68.2%
Here:
68%
State:
60%
(% for various income ranges: 58.8% for AGIs below $10k, 68.9% for AGIs $10k-25k, 69.8% for AGIs $25k-50k, 74.7% for AGIs $50k-75k, 65.4% for AGIs $75k-100k, 75.9% for AGIs over 100k)
Likely homosexual households (counted as self-reported same-sex unmarried-partner households)
Lesbian couples: 0.9% of all households
Gay men: 0.0% of all households
Household received Food Stamps/SNAP in the past 12 months: 154 Household did not receive Food Stamps/SNAP in the past 12 months: 1,453
Women who had a birth in the past 12 months: 35 (36 now married, 0 unmarried) Women who did not have a birth in the past 12 months: 1,062 (490 now married, 572 unmarried)
Housing units in zip code 37860 with a mortgage: 582 (24 second mortgage, 24 both second mortgage and home equity loan) Houses without a mortgage: 11
Median monthly owner costs for units with a mortgage: $1,148 Median monthly owner costs for units without a mortgage: $314
Residents with income below the poverty level in 2022:
This zip code:
7.9%
Whole state:
13.3%
Residents with income below 50% of the poverty level in 2022:
This zip code:
3.9%
Whole state:
7.1%
Median number of rooms in houses and condos:
Here:
5.9
State:
6.5
Median number of rooms in apartments:
Here:
4.9
State:
4.4
Notable locations in this zip code not listed on our city pages
Notable locations in zip code 37860: Sequoyah Council Boy Scout Reservation (A), Morristown State Fish Hatchery (B), Fall Creek Campground (C), Whites Little Mountain Orchard (D), East Hamblen County Volunteer Fire Department (E). Display/hide their locations on the map
Churches in zip code 37860 include: Rocky Point Church (A), Talley Chapel (B), Union Grove Church (C), Cedar Grove Church (D), Cedar Creek Church (E). Display/hide their locations on the map
Cemeteries: Ramsey Cemetery (1), McKenney Cemetery (2), Hamblen Memory Gardens Cemetery (3), Davis Cemetery (4), Thomason Cemetery (5), Heath Cemetery (6), Dodson Cemetery (7). Display/hide their locations on the map
Streams, rivers, and creeks: Kellar Branch (A), Hale Branch (B), Fall Creek (C), Silver City Branch (D), Dry Branch (E), Bingham Branch (F), Bent Creek (G), Needmore Creek (H), Marshall Creek (I). Display/hide their locations on the map
Size of family households: 475 2-persons, 398 3-persons, 129 4-persons, 103 5-persons
Size of nonfamily households: 332 1-person, 174 2-persons
463 married couples with children.
106 single-parent households (106 men).
97.8% of residents of 37860 zip code speak English at home.
1.9% of residents speak Spanish at home (100% very well).
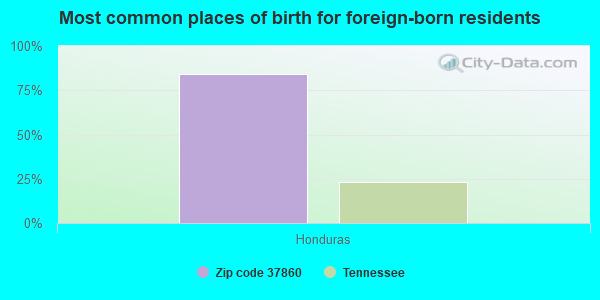
Foreign born population: 49 (1.2%) (100.0% of them are naturalized citizens)
This zip code:
1.2%
Whole state:
5.6%
84%Honduras
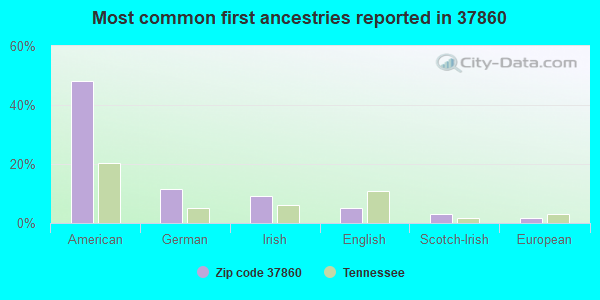
48%American
11%German
9%Irish
5%English
3%Scotch-Irish
2%European
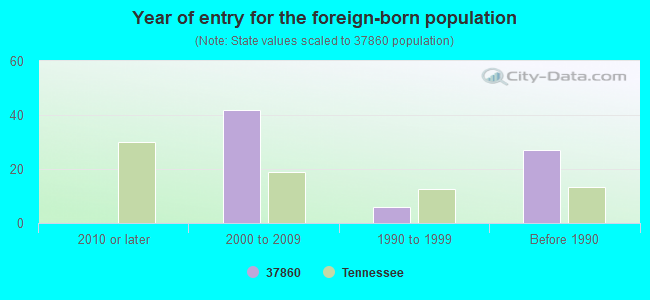
Year of entry for the foreign-born population
02010 or later
422000 to 2009
61990 to 1999
27Before 1990
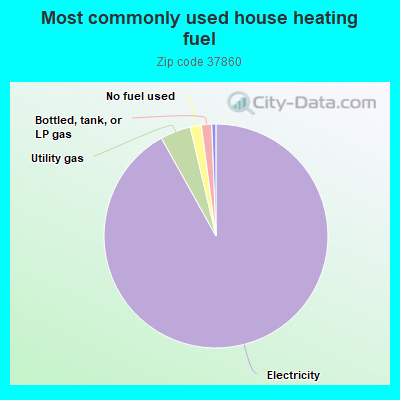
92.0%Electricity
4.4%Utility gas
1.6%No fuel used
1.5%Bottled, tank, or LP gas
0.6%Other fuel
Population in 1990: 2,329. Population change in the 1990s: +862 (+37.0%).
Place of birth for U.S.-born residents:
This state: 3,027
Northeast: 76
Midwest: 151
South: 657
57% of the 37860 zip code residents lived in the same house 5 years ago. Out of people who lived in different houses, 57% lived in this county. Out of people who lived in different counties, 50% lived in Tennessee.
94% of the 37860 zip code residents lived in the same house 1 year ago. Out of people who lived in different houses, 58% moved from this county. Out of people who lived in different houses, 24% moved from different county within same state. Out of people who lived in different houses, 20% moved from different state.
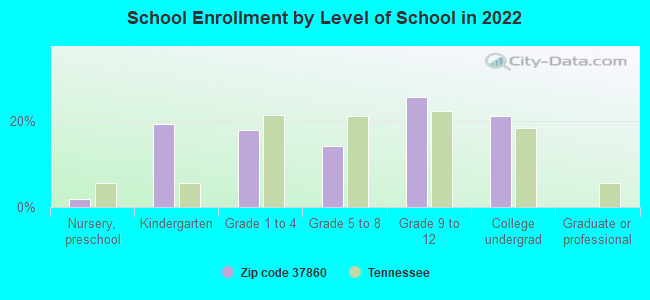
Private vs. public school enrollment:
Students in private schools in grades 1 to 8 (elementary and middle school):
Here:
0.0%
Tennessee:
15.0%
Students in private schools in grades 9 to 12 (high school):
Here:
0.0%
Tennessee:
16.2%
Students in private undergraduate colleges: 115
Here:
84.0%
Tennessee:
23.5%
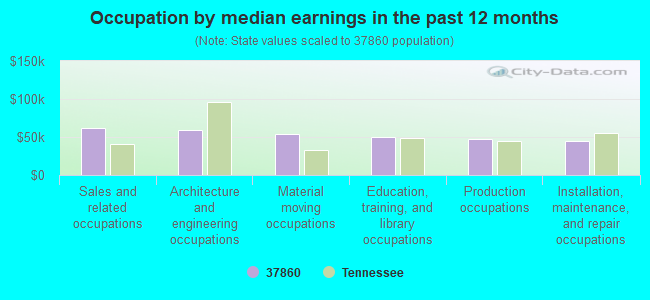
Occupation by median earnings in the past 12 months ($)
61,543Sales and related occupations
59,714Architecture and engineering occupations
53,978Material moving occupations
50,504Education, training, and library occupations
47,502Production occupations
45,268Installation, maintenance, and repair occupations
Companies with federal contracts located in this zip code:
KATOM RESTAURANT SUPPLY (5450 HWY 11 E in RUSSELLVILLE, TN; small business) : $72,993 in 3 contractsin 2005
$66,841 with Army for Construction of Structures and Facilities -- Dining Facilities. Signed on 2005-03-04. Completion date: 2005-04-29.
$3,323 with Army for Refrigeration Equipment. Taking place in SC. Signed on 2005-09-28. Completion date: 2005-11-30.
$2,829 with Army for Construction of Structures and Facilities -- Dining Facilities. Signed on 2005-03-30. Completion date: 2005-04-29.
Top industries in this zip code by the number of employees in 2005:
Management of Companies and Enterprises: Offices of Other Holding Companies (20-49 employees: 1 establishment)
Other Services (except Public Administration): Religious Organizations (10-19: 1, 1-4: 3)
Administrative and Support and Waste Management and Remediation Services: Janitorial Services (10-19: 1)
Accommodation and Food Services: Limited-Service Restaurants (10-19: 1)
Fatal accident statistics in 2014:
Fatal accident count: 3
Vehicles involved in fatal accidents: 5
Fatal accidents caused by drunken drivers: 1
Fatalities: 4
Persons involved in fatal accidents: 8
Pedestrians involved in fatal accidents: 0
Fatal accident statistics in 2010:
Fatal accident count: 1
Vehicles involved in fatal accidents: 1
Fatal accidents caused by drunken drivers: 0
Fatalities: 1
Persons involved in fatal accidents: 2
Pedestrians involved in fatal accidents: 0
Home Mortgage Disclosure Act Aggregated Statistics For Year 2009 (Based on 4 partial tracts)
A) FHA, FSA/RHS & VA Home Purchase Loans
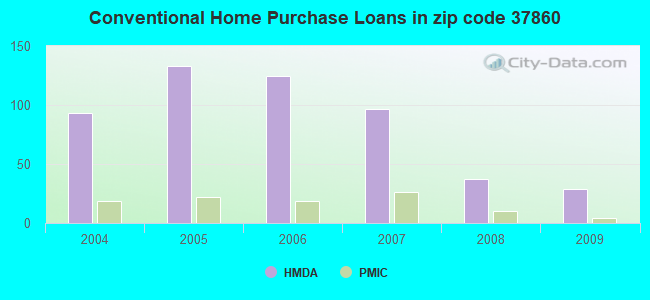
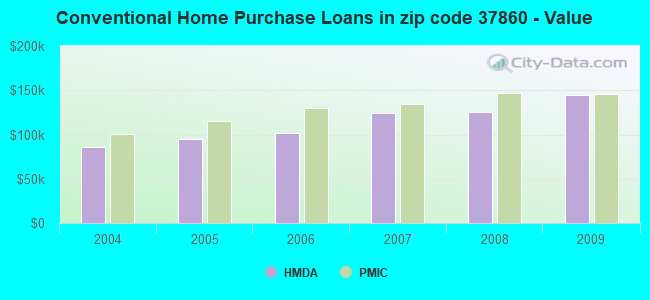
B) Conventional Home Purchase Loans
C) Refinancings
D) Home Improvement Loans
F) Non-occupant Loans on < 5 Family Dwellings (A B C & D)
G) Loans On Manufactured Home Dwelling (A B C & D)
Number
Average Value
Number
Average Value
Number
Average Value
Number
Average Value
Number
Average Value
Number
Average Value
LOANS ORIGINATED
31
$116,457
29
$144,294
159
$126,546
15
$47,551
15
$134,305
17
$51,135
APPLICATIONS APPROVED, NOT ACCEPTED
2
$128,730
5
$112,314
12
$113,809
2
$17,545
2
$153,935
2
$80,625
APPLICATIONS DENIED
2
$96,850
7
$109,120
43
$114,768
4
$58,570
3
$103,430
6
$49,052
APPLICATIONS WITHDRAWN
0
$0
3
$146,993
34
$134,891
1
$7,190
2
$86,285
2
$46,335
FILES CLOSED FOR INCOMPLETENESS
1
$118,920
0
$0
10
$132,893
1
$8,630
0
$0
1
$84,100
Aggregated Statistics For Year 2008 (Based on 4 partial tracts)
A) FHA, FSA/RHS & VA Home Purchase Loans
B) Conventional Home Purchase Loans
C) Refinancings
D) Home Improvement Loans
F) Non-occupant Loans on < 5 Family Dwellings (A B C & D)
G) Loans On Manufactured Home Dwelling (A B C & D)
Number
Average Value
Number
Average Value
Number
Average Value
Number
Average Value
Number
Average Value
Number
Average Value
LOANS ORIGINATED
31
$119,138
37
$125,424
128
$124,838
17
$39,908
17
$104,229
12
$71,572
APPLICATIONS APPROVED, NOT ACCEPTED
2
$133,725
3
$90,413
16
$112,623
3
$60,337
1
$129,380
2
$95,760
APPLICATIONS DENIED
1
$98,810
7
$115,237
65
$125,056
15
$38,414
2
$82,825
9
$48,958
APPLICATIONS WITHDRAWN
0
$0
5
$130,604
27
$129,964
3
$131,217
2
$56,610
2
$91,665
FILES CLOSED FOR INCOMPLETENESS
0
$0
1
$148,010
9
$147,708
0
$0
0
$0
1
$50,320
Aggregated Statistics For Year 2007 (Based on 4 partial tracts)
A) FHA, FSA/RHS & VA Home Purchase Loans
B) Conventional Home Purchase Loans
C) Refinancings
D) Home Improvement Loans
F) Non-occupant Loans on < 5 Family Dwellings (A B C & D)
G) Loans On Manufactured Home Dwelling (A B C & D)
Number
Average Value
Number
Average Value
Number
Average Value
Number
Average Value
Number
Average Value
Number
Average Value
LOANS ORIGINATED
17
$121,404
97
$124,409
105
$120,472
17
$36,986
24
$134,020
25
$63,544
APPLICATIONS APPROVED, NOT ACCEPTED
1
$163,790
2
$217,740
18
$113,342
4
$27,932
1
$398,700
2
$54,675
APPLICATIONS DENIED
1
$201,260
16
$115,994
109
$116,175
16
$71,479
7
$103,736
12
$71,042
APPLICATIONS WITHDRAWN
0
$0
8
$134,218
38
$121,327
2
$93,625
2
$188,325
2
$54,770
FILES CLOSED FOR INCOMPLETENESS
0
$0
5
$149,384
16
$130,094
0
$0
1
$115,730
0
$0
Aggregated Statistics For Year 2006 (Based on 4 partial tracts)
A) FHA, FSA/RHS & VA Home Purchase Loans
B) Conventional Home Purchase Loans
C) Refinancings
D) Home Improvement Loans
F) Non-occupant Loans on < 5 Family Dwellings (A B C & D)
G) Loans On Manufactured Home Dwelling (A B C & D)
Number
Average Value
Number
Average Value
Number
Average Value
Number
Average Value
Number
Average Value
Number
Average Value
LOANS ORIGINATED
22
$104,758
125
$101,929
106
$98,486
23
$39,737
23
$108,904
29
$67,508
APPLICATIONS APPROVED, NOT ACCEPTED
0
$0
21
$81,433
21
$82,006
2
$12,515
9
$80,361
12
$61,971
APPLICATIONS DENIED
1
$65,410
32
$80,431
107
$95,241
21
$42,028
14
$63,506
19
$59,996
APPLICATIONS WITHDRAWN
0
$0
13
$131,588
43
$117,557
3
$47,457
2
$43,920
2
$93,460
FILES CLOSED FOR INCOMPLETENESS
0
$0
5
$115,988
22
$119,869
2
$97,685
0
$0
1
$54,630
Aggregated Statistics For Year 2005 (Based on 4 partial tracts)
A) FHA, FSA/RHS & VA Home Purchase Loans
B) Conventional Home Purchase Loans
C) Refinancings
D) Home Improvement Loans
E) Loans on Dwellings For 5+ Families
F) Non-occupant Loans on < 5 Family Dwellings (A B C & D)
G) Loans On Manufactured Home Dwelling (A B C & D)
Number
Average Value
Number
Average Value
Number
Average Value
Number
Average Value
Number
Average Value
Number
Average Value
Number
Average Value
LOANS ORIGINATED
23
$99,627
133
$94,417
136
$90,404
14
$40,062
1
$1,228,940
25
$94,072
27
$57,841
APPLICATIONS APPROVED, NOT ACCEPTED
1
$86,970
13
$63,723
22
$95,142
2
$10,965
0
$0
1
$95,600
8
$55,495
APPLICATIONS DENIED
4
$65,300
47
$69,651
115
$96,120
17
$48,559
0
$0
5
$114,434
32
$55,265
APPLICATIONS WITHDRAWN
1
$107,890
14
$111,434
71
$106,986
3
$171,757
0
$0
4
$180,790
3
$64,953
FILES CLOSED FOR INCOMPLETENESS
0
$0
3
$132,407
13
$110,725
1
$171,070
0
$0
0
$0
1
$126,510
Aggregated Statistics For Year 2004 (Based on 4 partial tracts)
A) FHA, FSA/RHS & VA Home Purchase Loans
B) Conventional Home Purchase Loans
C) Refinancings
D) Home Improvement Loans
F) Non-occupant Loans on < 5 Family Dwellings (A B C & D)
G) Loans On Manufactured Home Dwelling (A B C & D)
Detailed PMIC statistics for the following Tracts:1006.00
, 1010.00
2003 - 2018 National Fire Incident Reporting System (NFIRS) incidents
Based on the data from the years 2003 - 2018 the average number of fire incidents per year is 8. The highest number of reported fires - 29 took place in 2006, and the least - 0 in 2009. The data has a declining trend.
When looking into fire subcategories, the most incidents belonged to: Structure Fires (41.0%), and Outside Fires (41.0%).
Fire incident types reported to NFIRS in Zip Code 37860
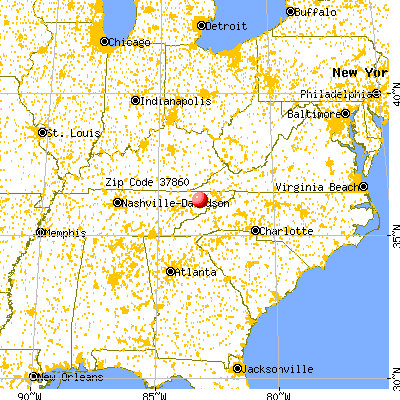


 Nearest zip codes: 37891, 37810, 37813, 37811, 37711, 37708.


 : $72,993 in 3 contracts in 2005
 Based on the data from the years 2003 - 2018 the average number of fire incidents per year is 8. The highest number of reported fires - 29 took place in 2006, and the least - 0 in 2009. The data has a declining trend.
 When looking into fire subcategories, the most incidents belonged to: Structure Fires (41.0%), and Outside Fires (41.0%).