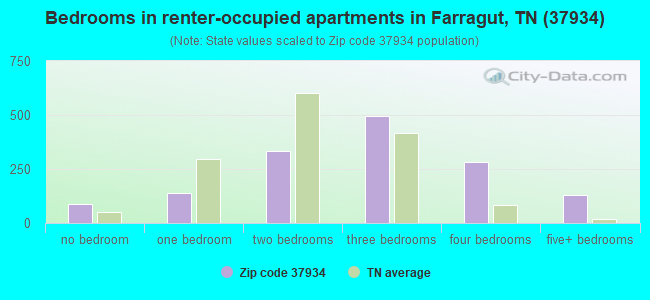
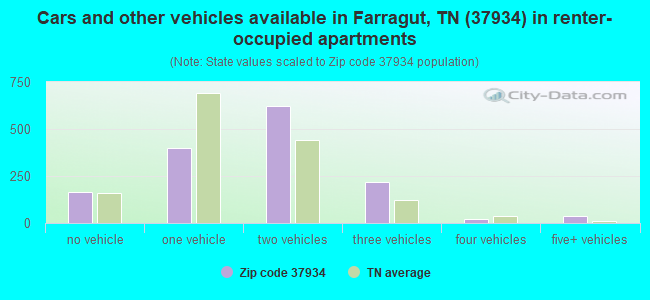
Houses and condos: 10,933 Renter-occupied apartments: 1,469
% of renters here:
13%
State:
33%
March 2022 cost of living index in zip code 37934: 83.1 (low, U.S. average is 100)
Land area: 17.5 sq. mi. Water area: 0.3 sq. mi.
Population density: 1,612 people per square mile
(low).
OSM Map
Google Map
MSN Map
OSM Map
General Map
Google Map
MSN Map
OSM Map
Google Map
MSN Map
OSM Map
Google Map
MSN Map
Please wait while loading the map...
Real estate property taxes paid for housing units in 2022:
This zip code:
0.4% ($1,952)
Tennessee:
0.5% ($1,376)
Median real estate property taxes paid for housing units with mortgages in 2022: $2,045 (0.4%) Median real estate property taxes paid for housing units with no mortgage in 2022: $1,805 (0.4%)
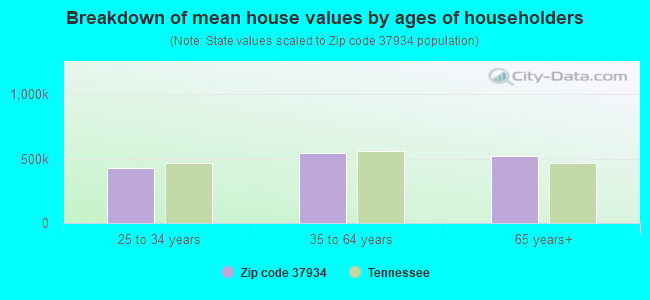
Estimated median house/condo value in 2022: $526,530
37934:
$526,530
Tennessee:
$284,800
According to our research of Tennessee and other state lists, there were 9 registered sex offenders living in 37934 zip code as of May 10, 2024. The ratio of all residents to sex offenders in zip code 37934 is 2,859 to 1. The ratio of registered sex offenders to all residents in this zip code is much lower than the state average.
Median resident age:
This zip code:
45.0 years
Tennessee median age:
39.2 years
Average household size:
This zip code:
2.6 people
Tennessee:
2.4 people
Averages for the 2020 tax year for zip code 37934, filed in 2021:
Average Adjusted Gross Income (AGI) in 2020: $129,867 (Individual Income Tax Returns)
Here:
$129,867
State:
$69,014
Salary/wage: $101,387 (reported on 75.7% of returns)
Here:
$101,387
State:
$55,872
(% of AGI for various income ranges: 1092.9% for AGIs below $25k, 3266.3% for AGIs $25k-50k, 5702.6% for AGIs $50k-75k, 8097.1% for AGIs $75k-100k, 17173.4% for AGIs $100k-200k, 69271.7% for AGIs over 200k)
Taxable interest for individuals: $2,797 (reported on 52.2% of returns)
This zip code:
$2,797
Tennessee:
$1,945
(% of AGI for various income ranges: 28.3% for AGIs below $25k, 64.7% for AGIs $25k-50k, 130.9% for AGIs $50k-75k, 123.2% for AGIs $75k-100k, 223.7% for AGIs $100k-200k, 1568.5% for AGIs over 200k)
Ordinary dividends: $8,348 (reported on 38.2% of returns)
Here:
$8,348
State:
$8,105
(% of AGI for various income ranges: 49.5% for AGIs below $25k, 118.5% for AGIs $25k-50k, 255.9% for AGIs $50k-75k, 339.7% for AGIs $75k-100k, 574.5% for AGIs $100k-200k, 3244.1% for AGIs over 200k)
Net capital gain/loss in AGI: +$29,725 (reported on 34.8% of returns)
Here:
+$29,725
State:
+$33,664
(% of AGI for various income ranges: 25.9% for AGIs below $25k, 80.2% for AGIs $25k-50k, 233.1% for AGIs $50k-75k, 311.0% for AGIs $75k-100k, 727.9% for AGIs $100k-200k, 16065.6% for AGIs over 200k)
Profit/loss from business: +$36,409 (reported on 19.3% of returns)
Here:
+$36,409
State:
+$18,991
(% of AGI for various income ranges: 141.4% for AGIs below $25k, 366.7% for AGIs $25k-50k, 520.9% for AGIs $50k-75k, 610.0% for AGIs $75k-100k, 1162.4% for AGIs $100k-200k, 7314.1% for AGIs over 200k)
Taxable individual retirement arrangement distribution: $29,327 (reported on 15.9% of returns)
37934:
$29,327
Tennessee:
$20,036
(% of AGI for various income ranges: 90.4% for AGIs below $25k, 255.8% for AGIs $25k-50k, 554.9% for AGIs $50k-75k, 720.9% for AGIs $75k-100k, 1149.6% for AGIs $100k-200k, 3230.6% for AGIs over 200k)
Self-employed (Keogh) retirement plans: $30,873 (reported on 2.3% of returns)
37934:
$30,873
Tennessee:
$28,955
(% of AGI for various income ranges: 37.8% for AGIs $50k-75k, 77.2% for AGIs $100k-200k, 1053.8% for AGIs over 200k)
Total itemized deductions: $42,521 (reported on 12.0% of returns)
Here:
$42,521
State:
$40,136
(% of AGI for various income ranges: 69.2% for AGIs below $25k, 185.4% for AGIs $25k-50k, 357.5% for AGIs $50k-75k, 473.3% for AGIs $75k-100k, 766.1% for AGIs $100k-200k, 5763.0% for AGIs over 200k)
Charity contributions: $20,474 (reported on 10.6% of returns)
Here:
$20,474
State:
$19,852
(% of AGI for various income ranges: 5.7% for AGIs below $25k, 31.0% for AGIs $25k-50k, 61.6% for AGIs $50k-75k, 128.1% for AGIs $75k-100k, 284.9% for AGIs $100k-200k, 2907.6% for AGIs over 200k)
Taxes paid: $6,024 (reported on 11.8% of returns)
37934:
$6,024
State:
$6,038
(% of AGI for various income ranges: 6.9% for AGIs below $25k, 17.9% for AGIs $25k-50k, 42.4% for AGIs $50k-75k, 70.3% for AGIs $75k-100k, 123.1% for AGIs $100k-200k, 782.4% for AGIs over 200k)
Earned income credit: $2,001 (reported on 5.7% of returns)
Here:
$2,001
State:
$2,391
(% of AGI for various income ranges: 44.4% for AGIs below $25k, 44.2% for AGIs $25k-50k)
Percentage of individuals using paid preparers for their 2020 taxes: 91.1%
Here:
91%
State:
93%
(% for various income ranges: 90.6% for AGIs below $25k, 90.3% for AGIs $25k-50k, 92.0% for AGIs $50k-75k, 91.7% for AGIs $75k-100k, 90.1% for AGIs $100k-200k, 93.2% for AGIs over 200k)
Averages for the 2012 tax year for zip code 37934, filed in 2013:
Average Adjusted Gross Income (AGI) in 2012: $100,412 (Individual Income Tax Returns)
Here:
$100,412
State:
$53,767
Salary/wage: $82,418 (reported on 80.6% of returns)
Here:
$82,418
State:
$45,421
(% of AGI for various income ranges: 71.7% for AGIs below $25k, 69.3% for AGIs $25k-50k, 64.8% for AGIs $50k-75k, 69.3% for AGIs $75k-100k, 74.6% for AGIs $100k-200k, 58.2% for AGIs over 200k)
Taxable interest for individuals: $1,941 (reported on 51.9% of returns)
This zip code:
$1,941
Tennessee:
$1,732
(% of AGI for various income ranges: 2.4% for AGIs below $25k, 1.7% for AGIs $25k-50k, 1.2% for AGIs $50k-75k, 1.1% for AGIs $75k-100k, 0.8% for AGIs $100k-200k, 1.0% for AGIs over 200k)
Ordinary dividends: $6,525 (reported on 35.5% of returns)
Here:
$6,525
State:
$6,739
(% of AGI for various income ranges: 3.9% for AGIs below $25k, 2.5% for AGIs $25k-50k, 2.3% for AGIs $50k-75k, 1.7% for AGIs $75k-100k, 1.4% for AGIs $100k-200k, 3.0% for AGIs over 200k)
Net capital gain/loss in AGI: +$15,585 (reported on 30.2% of returns)
Here:
+$15,585
State:
+$19,082
(% of AGI for various income ranges: 0.4% for AGIs $25k-50k, 0.7% for AGIs $50k-75k, 0.5% for AGIs $75k-100k, 1.1% for AGIs $100k-200k, 10.1% for AGIs over 200k)
Profit/loss from business: +$31,058 (reported on 19.3% of returns)
Here:
+$31,058
State:
+$15,240
(% of AGI for various income ranges: 8.3% for AGIs below $25k, 5.4% for AGIs $25k-50k, 4.9% for AGIs $50k-75k, 5.0% for AGIs $75k-100k, 4.7% for AGIs $100k-200k, 7.3% for AGIs over 200k)
Taxable individual retirement arrangement distribution: $21,569 (reported on 15.7% of returns)
37934:
$21,569
Tennessee:
$15,505
(% of AGI for various income ranges: 5.4% for AGIs below $25k, 4.8% for AGIs $25k-50k, 5.0% for AGIs $50k-75k, 4.2% for AGIs $75k-100k, 3.9% for AGIs $100k-200k, 2.2% for AGIs over 200k)
Self-employment retirement plans: $24,676 (reported on 2.2% of returns)
37934:
$24,676
Tennessee:
$22,567
(% of AGI for various income ranges: 0.4% for AGIs $50k-75k, 0.3% for AGIs $100k-200k, 1.0% for AGIs over 200k)
Total itemized deductions: $25,311 (16% of AGI, reported on 43.8% of returns)
Here:
$25,311
State:
$21,976
Here:
15.6% of AGI
State:
17.8% of AGI
(% of AGI for various income ranges: 15.3% for AGIs below $25k, 13.8% for AGIs $25k-50k, 14.2% for AGIs $50k-75k, 13.2% for AGIs $75k-100k, 11.7% for AGIs $100k-200k, 8.8% for AGIs over 200k)
Charity contributions: $7,221 (reported on 38.4% of returns)
Here:
$7,221
State:
$6,709
(% of AGI for various income ranges: 1.6% for AGIs below $25k, 1.9% for AGIs $25k-50k, 2.3% for AGIs $50k-75k, 2.5% for AGIs $75k-100k, 3.0% for AGIs $100k-200k, 2.9% for AGIs over 200k)
Taxes paid: $5,573 (reported on 43.3% of returns)
37934:
$5,573
State:
$4,829
(% of AGI for various income ranges: 2.2% for AGIs below $25k, 2.2% for AGIs $25k-50k, 2.7% for AGIs $50k-75k, 2.6% for AGIs $75k-100k, 2.6% for AGIs $100k-200k, 2.2% for AGIs over 200k)
Earned income credit: $1,780 (reported on 7.5% of returns)
Here:
$1,780
State:
$2,404
(% of AGI for various income ranges: 3.2% for AGIs below $25k, 0.7% for AGIs $25k-50k)
Percentage of individuals using paid preparers for their 2012 taxes: 43.2%
Here:
43%
State:
52%
(% for various income ranges: 36.7% for AGIs below $25k, 42.4% for AGIs $25k-50k, 45.6% for AGIs $50k-75k, 41.1% for AGIs $75k-100k, 43.5% for AGIs $100k-200k, 62.1% for AGIs over 200k)
Averages for the 2004 tax year for zip code 37934, filed in 2005:
Average Adjusted Gross Income (AGI) in 2004: $67,662 (Individual Income Tax Returns)
Here:
$67,662
State:
$44,088
Salary/wage: $55,634 (reported on 86.1% of returns)
Here:
$55,634
State:
$38,825
(% of AGI for various income ranges: 109.8% for AGIs below $10k, 75.6% for AGIs $10k-25k, 82.0% for AGIs $25k-50k, 77.8% for AGIs $50k-75k, 79.7% for AGIs $75k-100k, 65.9% for AGIs over 100k)
Taxable interest for individuals: $1,751 (reported on 48.8% of returns)
This zip code:
$1,751
Tennessee:
$1,802
(% of AGI for various income ranges: 2.2% for AGIs below $10k, 2.3% for AGIs $10k-25k, 2.7% for AGIs $25k-50k, 1.6% for AGIs $50k-75k, 2.8% for AGIs $75k-100k, 0.7% for AGIs over 100k)
Taxable dividends: $3,016 (reported on 27.2% of returns)
Here:
$3,016
State:
$3,727
(% of AGI for various income ranges: 3.9% for AGIs below $10k, 1.2% for AGIs $10k-25k, 1.6% for AGIs $25k-50k, 1.1% for AGIs $50k-75k, 0.8% for AGIs $75k-100k, 1.2% for AGIs over 100k)
Net capital gain/loss: +$7,388 (reported on 26.6% of returns)
Here:
+$7,388
State:
+$15,776
(% of AGI for various income ranges: -1.7% for AGIs below $10k, 0.2% for AGIs $10k-25k, 0.7% for AGIs $25k-50k, 0.4% for AGIs $50k-75k, 1.4% for AGIs $75k-100k, 4.0% for AGIs over 100k)
Profit/loss from business: +$31,479 (reported on 20.3% of returns)
Here:
+$31,479
State:
+$12,882
(% of AGI for various income ranges: -3.0% for AGIs below $10k, 8.8% for AGIs $10k-25k, 5.2% for AGIs $25k-50k, 8.7% for AGIs $50k-75k, 3.4% for AGIs $75k-100k, 11.3% for AGIs over 100k)
IRA payment deduction: $3,724 (reported on 2.5% of returns)
37934:
$3,724
Tennessee:
$2,934
Self-employed pension: $22,038 (reported on 2.2% of returns)
Here:
$22,038
Tennessee:
$16,857
Total itemized deductions: $21,755 (18% of AGI, reported on 40.1% of returns)
Here:
$21,755
State:
$18,035
Here:
17.5% of AGI
State:
19.9% of AGI
(% of AGI for various income ranges: 10.1% for AGIs below $10k, 17.6% for AGIs $10k-25k, 14.1% for AGIs $25k-50k, 16.4% for AGIs $50k-75k, 19.7% for AGIs $75k-100k, 11.0% for AGIs over 100k)
Charity contributions deductions: $5,248 (4% of AGI, reported on 34.8% of returns)
Here:
$5,248
State:
$5,167
Here:
4.0% of AGI
State:
5.3% of AGI
(% of AGI for various income ranges: 1.5% for AGIs $10k-25k, 2.2% for AGIs $25k-50k, 2.7% for AGIs $50k-75k, 3.6% for AGIs $75k-100k, 2.8% for AGIs over 100k)
Total tax: $15,409 (reported on 74.3% of returns)
37934:
$15,409
State:
$7,482
(% of AGI for various income ranges: 2.7% for AGIs below $10k, 5.2% for AGIs $10k-25k, 7.0% for AGIs $25k-50k, 9.6% for AGIs $50k-75k, 10.0% for AGIs $75k-100k, 21.2% for AGIs over 100k)
Earned income credit: $1,886 (reported on 6.0% of returns)
Here:
$1,886
State:
$1,826
Percentage of individuals using paid preparers for their 2004 taxes: 46.3%
Here:
46%
State:
60%
(% for various income ranges: 25.9% for AGIs below $10k, 46.5% for AGIs $10k-25k, 49.1% for AGIs $25k-50k, 50.8% for AGIs $50k-75k, 67.0% for AGIs $75k-100k, 63.2% for AGIs over 100k)
Likely homosexual households (counted as self-reported same-sex unmarried-partner households)
Lesbian couples: 0.2% of all households
Gay men: 0.0% of all households
Household received Food Stamps/SNAP in the past 12 months: 63 Household did not receive Food Stamps/SNAP in the past 12 months: 10,901
Women who had a birth in the past 12 months: 355 (298 now married, 60 unmarried) Women who did not have a birth in the past 12 months: 5,648 (3,136 now married, 2,512 unmarried)
Housing units in zip code 37934 with a mortgage: 5,687 (694 second mortgage, 621 both second mortgage and home equity loan) Houses without a mortgage: 86
Median monthly owner costs for units with a mortgage: $2,010 Median monthly owner costs for units without a mortgage: $535
Residents with income below the poverty level in 2022:
This zip code:
2.3%
Whole state:
13.3%
Residents with income below 50% of the poverty level in 2022:
This zip code:
1.3%
Whole state:
7.1%
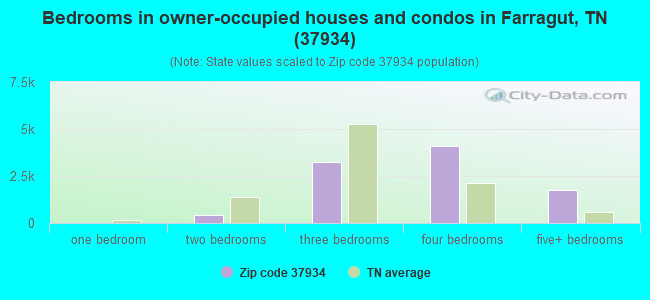
Median number of rooms in houses and condos:
Here:
8.2
State:
6.5
Median number of rooms in apartments:
Here:
5.2
State:
4.4
Notable locations in this zip code not listed on our city pages
Notable locations in zip code 37934: Campbell Station (A), Rural / Metro Fire Department Knoxville 14 (B), Rural / Metro Fire Department Knoxville Station 11 (C). Display/hide their locations on the map
Churches in zip code 37934 include: Kingston Pike Church (A), Union Church (B), Concord Church (C), Aichton Memorial Baptist Church (D), Farragut Christian Church (E), Virtue Church (F), Grigsby Chapel (G), Community Church (H), Farragut Church (I). Display/hide their locations on the map
In group quarters: 285 (-1 institutionalized population)
Size of family households: 3,564 2-persons, 2,316 3-persons, 1,432 4-persons, 684 5-persons, 234 6-persons, 23 7-or-more-persons
Size of nonfamily households: 2,344 1-person, 191 2-persons, 93 3-persons
4,971 married couples with children.
742 single-parent households (172 men, 570 women).
93.5% of residents of 37934 zip code speak English at home.
1.0% of residents speak Spanish at home (53% very well, 7% well, 33% not well, 8% not at all).
3.3% of residents speak other Indo-European language at home (90% very well, 3% well, 7% not well).
1.9% of residents speak Asian or Pacific Island language at home (71% very well, 22% well, 7% not well).
0.4% of residents speak other language at home (76% very well, 24% well).
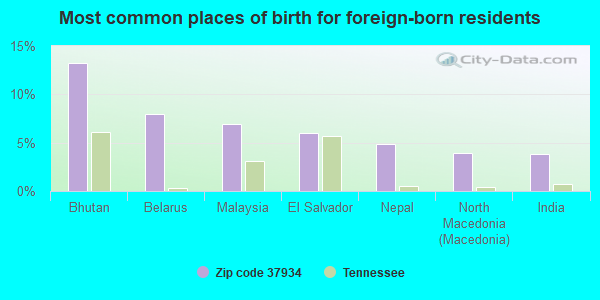
Foreign born population: 2,068 (7.3%) (71.8% of them are naturalized citizens)
This zip code:
7.3%
Whole state:
5.6%
13%Bhutan
8%Belarus
7%Malaysia
6%El Salvador
5%Nepal
4%North Macedonia (Macedonia)
4%India
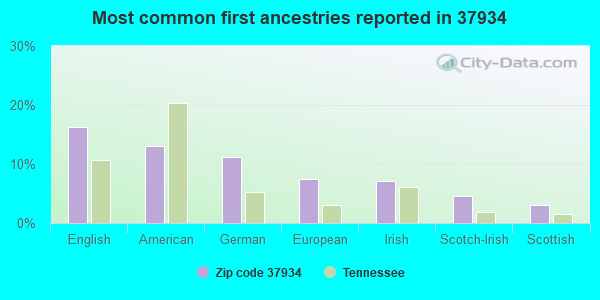
16%English
13%American
11%German
7%European
7%Irish
5%Scotch-Irish
3%Scottish
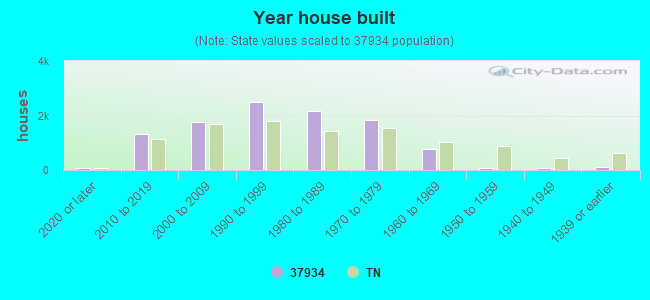
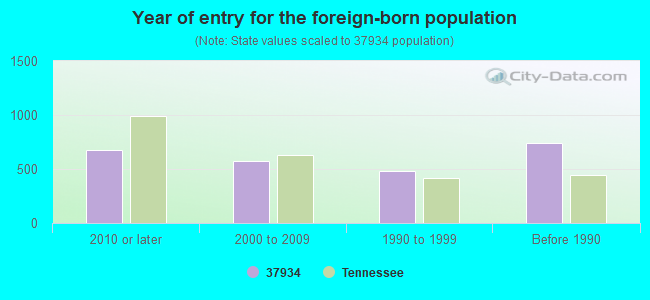
Year of entry for the foreign-born population
6782010 or later
5722000 to 2009
4831990 to 1999
745Before 1990
Housing units lacking complete kitchen facilities: 1.7%
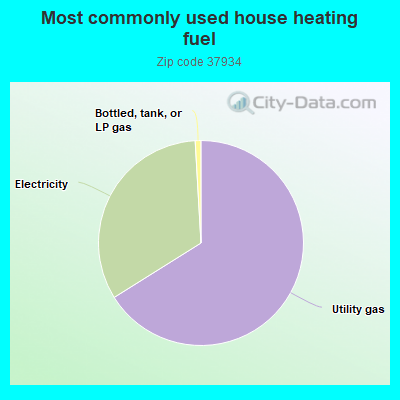
65.9%Utility gas
32.9%Electricity
0.9%Bottled, tank, or LP gas
Place of birth for U.S.-born residents:
This state: 11,774
Northeast: 2,944
Midwest: 2,967
South: 6,652
West: 1,540
90% of the 37934 zip code residents lived in the same house 1 year ago. Out of people who lived in different houses, 44% moved from this county. Out of people who lived in different houses, 19% moved from different county within same state. Out of people who lived in different houses, 38% moved from different state. Out of people who lived in different houses, 1% moved from abroad.
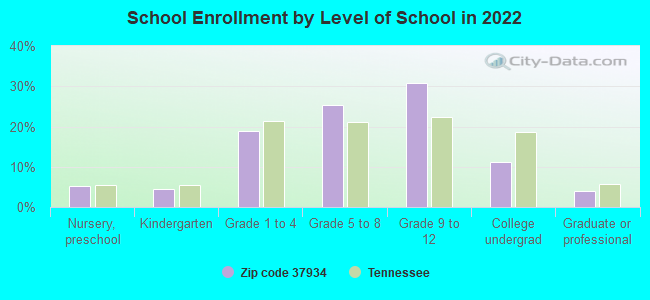
Private vs. public school enrollment:
Students in private schools in grades 1 to 8 (elementary and middle school): 755
Here:
26.1%
Tennessee:
15.0%
Students in private schools in grades 9 to 12 (high school): 413
Here:
20.5%
Tennessee:
16.2%
Students in private undergraduate colleges: 151
Here:
20.8%
Tennessee:
23.5%
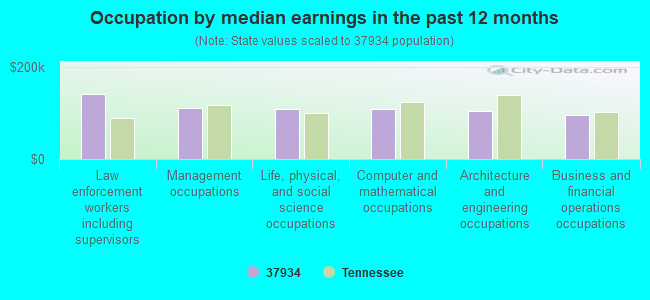
Occupation by median earnings in the past 12 months ($)
142,371Law enforcement workers including supervisors
110,708Management occupations
108,946Life, physical, and social science occupations
108,260Computer and mathematical occupations
104,489Architecture and engineering occupations
94,976Business and financial operations occupations
Top industries in this zip code by the number of employees in 2005:
Construction: New Single-Family Housing Construction (except Operative Builders) (10-19: 1, 1-4: 1)
Fatal accident statistics in 2014:
Fatal accident count: 2
Vehicles involved in fatal accidents: 3
Fatal accidents caused by drunken drivers: 0
Fatalities: 2
Persons involved in fatal accidents: 4
Pedestrians involved in fatal accidents: 1
Fatal accident statistics in 2013:
Fatal accident count: 1
Vehicles involved in fatal accidents: 1
Fatal accidents caused by drunken drivers: 0
Fatalities: 1
Persons involved in fatal accidents: 3
Pedestrians involved in fatal accidents: 0
2005 - 2018 National Fire Incident Reporting System (NFIRS) incidents
Based on the data from the years 2005 - 2018 the average number of fires per year is 30. The highest number of reported fires - 45 took place in 2016, and the least - 6 in 2005. The data has an increasing trend.
When looking into fire subcategories, the most reports belonged to: Outside Fires (49.9%), and Structure Fires (28.4%).
Fire incident types reported to NFIRS in Zip Code 37934


 Based on the data from the years 2005 - 2018 the average number of fires per year is 30. The highest number of reported fires - 45 took place in 2016, and the least - 6 in 2005. The data has an increasing trend.
 When looking into fire subcategories, the most reports belonged to: Outside Fires (49.9%), and Structure Fires (28.4%).