Estimated zip code population in 2022: 10,299 Zip code population in 2010: 9,898 Zip code population in 2000: 9,690
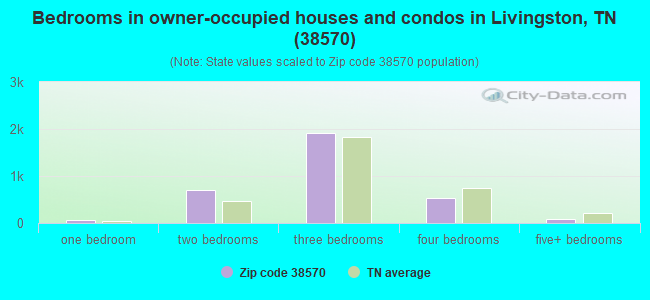
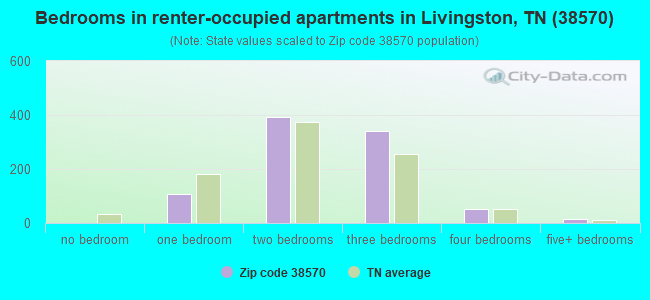
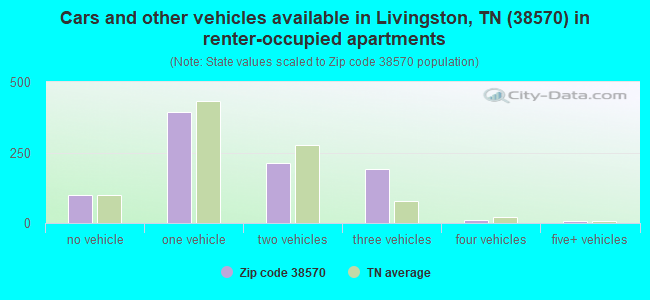
Houses and condos: 4,868 Renter-occupied apartments: 913
% of renters here:
22%
State:
33%
March 2022 cost of living index in zip code 38570: 80.3 (low, U.S. average is 100)
Land area: 106.8 sq. mi. Water area: 0.1 sq. mi.
Population density: 96 people per square mile
(very low).
OSM Map
General Map
Google Map
MSN Map
OSM Map
General Map
Google Map
MSN Map
OSM Map
General Map
Google Map
MSN Map
OSM Map
General Map
Google Map
MSN Map
Please wait while loading the map...
Real estate property taxes paid for housing units in 2022:
This zip code:
0.4% ($712)
Tennessee:
0.5% ($1,376)
Median real estate property taxes paid for housing units with mortgages in 2022: $726 (0.4%) Median real estate property taxes paid for housing units with no mortgage in 2022: $690 (0.4%)
Business Search- 14 Million verified businesses
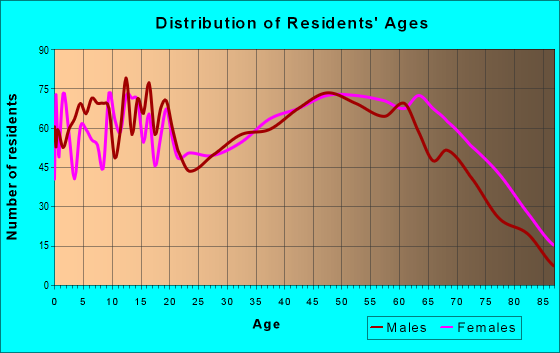
Males: 4,721
(45.8%)
Females: 5,578
(54.2%)
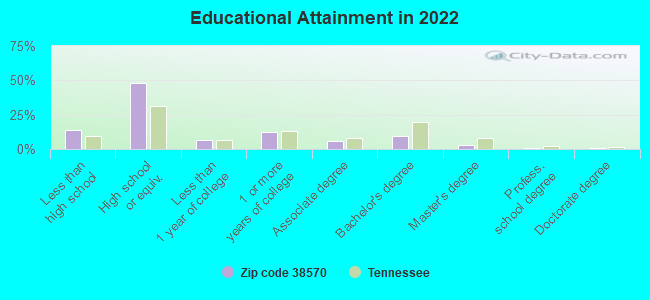
For population 25 years and over in 38570:
High school or higher: 84.9%
Bachelor's degree or higher: 13.3%
Graduate or professional degree: 4.1%
Unemployed: 2.3%
Mean travel time to work (commute): 24.7 minutes
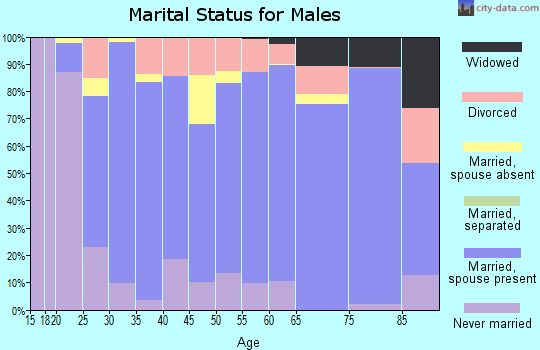
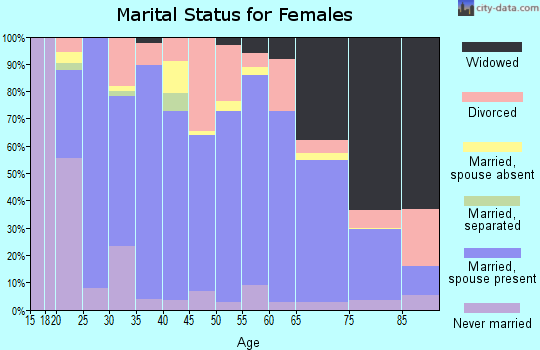
For population 15 years and over in 38570:
Never married: 22.8%
Now married: 48.0%
Separated: 2.5%
Widowed: 10.0%
Divorced: 16.7%
Zip code 38570 compared to state average:
Median household income below state average.
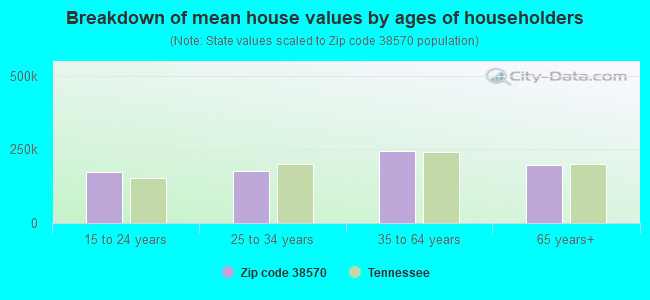
Median house value below state average.
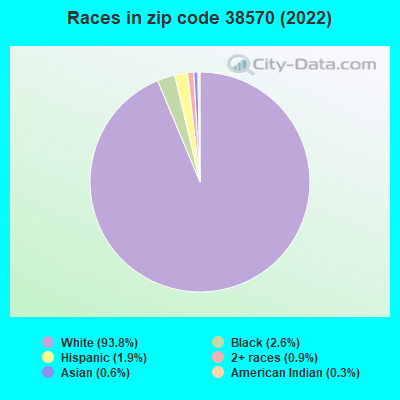
Black race population percentage significantly below state average.
Hispanic race population percentage significantly below state average.
Median age above state average.
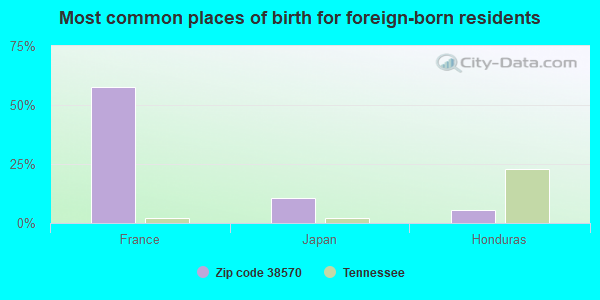
Foreign-born population percentage significantly below state average.
Renting percentage below state average.
Length of stay since moving in significantly above state average.
Percentage of population with a bachelor's degree or higher below state average.
Estimated median house/condo value in 2022: $173,260
38570:
$173,260
Tennessee:
$284,800
According to our research of Tennessee and other state lists, there were 18 registered sex offenders living in 38570 zip code as of April 27, 2024. The ratio of all residents to sex offenders in zip code 38570 is 519 to 1. The ratio of registered sex offenders to all residents in this zip code is lower than the state average.
Median resident age:
This zip code:
44.1 years
Tennessee median age:
39.2 years
Average household size:
This zip code:
2.4 people
Tennessee:
2.4 people
Averages for the 2020 tax year for zip code 38570, filed in 2021:
Average Adjusted Gross Income (AGI) in 2020: $52,078 (Individual Income Tax Returns)
Here:
$52,078
State:
$69,014
Salary/wage: $41,591 (reported on 81.7% of returns)
Here:
$41,591
State:
$55,872
(% of AGI for various income ranges: 1076.1% for AGIs below $25k, 3375.1% for AGIs $25k-50k, 6224.1% for AGIs $50k-75k, 9021.9% for AGIs $75k-100k, 13743.8% for AGIs $100k-200k)
Taxable interest for individuals: $1,873 (reported on 27.5% of returns)
This zip code:
$1,873
Tennessee:
$1,945
(% of AGI for various income ranges: 21.6% for AGIs below $25k, 33.2% for AGIs $25k-50k, 57.4% for AGIs $50k-75k, 84.2% for AGIs $75k-100k, 194.3% for AGIs $100k-200k)
Ordinary dividends: $3,148 (reported on 7.3% of returns)
Here:
$3,148
State:
$8,105
(% of AGI for various income ranges: 7.3% for AGIs below $25k, 4.5% for AGIs $25k-50k, 14.6% for AGIs $50k-75k, 43.5% for AGIs $75k-100k, 138.1% for AGIs $100k-200k)
Net capital gain/loss in AGI: +$60,431 (reported on 9.2% of returns)
Here:
+$60,431
State:
+$33,664
(% of AGI for various income ranges: 7.1% for AGIs below $25k, 44.5% for AGIs $25k-50k, 102.4% for AGIs $50k-75k, 306.2% for AGIs $75k-100k, 1153.8% for AGIs $100k-200k)
Profit/loss from business: +$16,417 (reported on 18.1% of returns)
Here:
+$16,417
State:
+$18,991
(% of AGI for various income ranges: 175.5% for AGIs below $25k, 192.3% for AGIs $25k-50k, 237.4% for AGIs $50k-75k, 392.7% for AGIs $75k-100k, 874.8% for AGIs $100k-200k)
Taxable individual retirement arrangement distribution: $15,538 (reported on 6.1% of returns)
38570:
$15,538
Tennessee:
$20,036
(% of AGI for various income ranges: 37.7% for AGIs below $25k, 58.8% for AGIs $25k-50k, 160.4% for AGIs $50k-75k, 280.4% for AGIs $75k-100k, 708.6% for AGIs $100k-200k)
Total itemized deductions: $34,711 (reported on 2.1% of returns)
Here:
$34,711
State:
$40,136
(% of AGI for various income ranges: 168.0% for AGIs $50k-75k, 316.7% for AGIs $100k-200k)
Charity contributions: $19,500 (reported on 1.9% of returns)
Here:
$19,500
State:
$19,852
(% of AGI for various income ranges: 18.5% for AGIs $25k-50k, 180.5% for AGIs $100k-200k)
Taxes paid: $5,067 (reported on 2.1% of returns)
38570:
$5,067
State:
$6,038
(% of AGI for various income ranges: 9.0% for AGIs $25k-50k, 55.2% for AGIs $100k-200k)
Earned income credit: $2,323 (reported on 23.2% of returns)
Here:
$2,323
State:
$2,391
(% of AGI for various income ranges: 107.3% for AGIs below $25k, 86.7% for AGIs $25k-50k, 3.7% for AGIs $50k-75k)
Percentage of individuals using paid preparers for their 2020 taxes: 96.9%
Here:
97%
State:
93%
(% for various income ranges: 96.5% for AGIs below $25k, 96.6% for AGIs $25k-50k, 98.3% for AGIs $50k-75k, 97.2% for AGIs $75k-100k, 96.9% for AGIs $100k-200k, 100.0% for AGIs over 200k)
Averages for the 2012 tax year for zip code 38570, filed in 2013:
Average Adjusted Gross Income (AGI) in 2012: $38,651 (Individual Income Tax Returns)
Here:
$38,651
State:
$53,767
Salary/wage: $33,995 (reported on 82.0% of returns)
Here:
$33,995
State:
$45,421
(% of AGI for various income ranges: 74.7% for AGIs below $25k, 82.2% for AGIs $25k-50k, 83.2% for AGIs $50k-75k, 76.8% for AGIs $75k-100k, 68.6% for AGIs $100k-200k, 36.6% for AGIs over 200k)
Taxable interest for individuals: $1,493 (reported on 34.4% of returns)
This zip code:
$1,493
Tennessee:
$1,732
(% of AGI for various income ranges: 1.5% for AGIs below $25k, 1.1% for AGIs $25k-50k, 1.3% for AGIs $50k-75k, 1.2% for AGIs $75k-100k, 0.7% for AGIs $100k-200k, 2.3% for AGIs over 200k)
Ordinary dividends: $2,431 (reported on 6.9% of returns)
Here:
$2,431
State:
$6,739
(% of AGI for various income ranges: 0.4% for AGIs below $25k, 0.2% for AGIs $25k-50k, 0.3% for AGIs $50k-75k, 0.2% for AGIs $75k-100k, 0.2% for AGIs $100k-200k, 1.6% for AGIs over 200k)
Net capital gain/loss in AGI: +$7,647 (reported on 7.9% of returns)
Here:
+$7,647
State:
+$19,082
(% of AGI for various income ranges: 0.6% for AGIs below $25k, 0.5% for AGIs $25k-50k, 0.5% for AGIs $50k-75k, 0.7% for AGIs $75k-100k, 2.5% for AGIs $100k-200k, 5.9% for AGIs over 200k)
Profit/loss from business: +$14,713 (reported on 22.2% of returns)
Here:
+$14,713
State:
+$15,240
(% of AGI for various income ranges: 10.5% for AGIs below $25k, 4.7% for AGIs $25k-50k, 2.5% for AGIs $50k-75k, 1.7% for AGIs $75k-100k, 11.9% for AGIs $100k-200k, 23.2% for AGIs over 200k)
Taxable individual retirement arrangement distribution: $11,559 (reported on 7.7% of returns)
38570:
$11,559
Tennessee:
$15,505
(% of AGI for various income ranges: 2.6% for AGIs below $25k, 2.1% for AGIs $25k-50k, 2.8% for AGIs $50k-75k, 2.5% for AGIs $75k-100k, 3.9% for AGIs $100k-200k)
Total itemized deductions: $20,257 (20% of AGI, reported on 12.4% of returns)
Here:
$20,257
State:
$21,976
Here:
20.5% of AGI
State:
17.8% of AGI
(% of AGI for various income ranges: 2.6% for AGIs below $25k, 4.4% for AGIs $25k-50k, 6.9% for AGIs $50k-75k, 7.7% for AGIs $75k-100k, 9.9% for AGIs $100k-200k, 9.6% for AGIs over 200k)
Charity contributions: $7,219 (reported on 9.8% of returns)
Here:
$7,219
State:
$6,709
(% of AGI for various income ranges: 0.2% for AGIs below $25k, 0.7% for AGIs $25k-50k, 1.2% for AGIs $50k-75k, 1.8% for AGIs $75k-100k, 3.1% for AGIs $100k-200k, 5.1% for AGIs over 200k)
Taxes paid: $3,564 (reported on 11.9% of returns)
38570:
$3,564
State:
$4,829
(% of AGI for various income ranges: 0.3% for AGIs below $25k, 0.6% for AGIs $25k-50k, 1.0% for AGIs $50k-75k, 1.4% for AGIs $75k-100k, 1.8% for AGIs $100k-200k, 2.1% for AGIs over 200k)
Earned income credit: $2,350 (reported on 27.2% of returns)
Here:
$2,350
State:
$2,404
(% of AGI for various income ranges: 7.6% for AGIs below $25k, 1.8% for AGIs $25k-50k)
Percentage of individuals using paid preparers for their 2012 taxes: 73.5%
Here:
74%
State:
52%
(% for various income ranges: 71.1% for AGIs below $25k, 74.7% for AGIs $25k-50k, 75.0% for AGIs $50k-75k, 78.3% for AGIs $75k-100k, 81.2% for AGIs $100k-200k, 83.3% for AGIs over 200k)
Averages for the 2004 tax year for zip code 38570, filed in 2005:
Average Adjusted Gross Income (AGI) in 2004: $31,430 (Individual Income Tax Returns)
Here:
$31,430
State:
$44,088
Salary/wage: $28,869 (reported on 85.0% of returns)
Here:
$28,869
State:
$38,825
(% of AGI for various income ranges: 114.9% for AGIs below $10k, 83.4% for AGIs $10k-25k, 84.8% for AGIs $25k-50k, 85.5% for AGIs $50k-75k, 84.0% for AGIs $75k-100k, 47.0% for AGIs over 100k)
Taxable interest for individuals: $1,826 (reported on 41.3% of returns)
This zip code:
$1,826
Tennessee:
$1,802
(% of AGI for various income ranges: 9.5% for AGIs below $10k, 2.5% for AGIs $10k-25k, 1.8% for AGIs $25k-50k, 1.8% for AGIs $50k-75k, 1.4% for AGIs $75k-100k, 3.4% for AGIs over 100k)
Taxable dividends: $2,031 (reported on 9.5% of returns)
Here:
$2,031
State:
$3,727
(% of AGI for various income ranges: 1.2% for AGIs below $10k, 0.3% for AGIs $10k-25k, 0.2% for AGIs $25k-50k, 0.6% for AGIs $50k-75k, 0.1% for AGIs $75k-100k, 1.8% for AGIs over 100k)
Net capital gain/loss: +$9,738 (reported on 8.9% of returns)
Here:
+$9,738
State:
+$15,776
(% of AGI for various income ranges: -1.4% for AGIs below $10k, 0.5% for AGIs $10k-25k, 1.2% for AGIs $25k-50k, 1.0% for AGIs $50k-75k, 1.9% for AGIs $75k-100k, 10.0% for AGIs over 100k)
Profit/loss from business: +$12,639 (reported on 21.8% of returns)
Here:
+$12,639
State:
+$12,882
(% of AGI for various income ranges: 22.5% for AGIs below $10k, 6.2% for AGIs $10k-25k, 3.7% for AGIs $25k-50k, 2.9% for AGIs $50k-75k, 6.4% for AGIs $75k-100k, 24.5% for AGIs over 100k)
IRA payment deduction: $3,150 (reported on 3.0% of returns)
38570:
$3,150
Tennessee:
$2,934
(% of AGI for various income ranges: 0.4% for AGIs $10k-25k, 0.3% for AGIs $25k-50k, 0.4% for AGIs $50k-75k, 0.3% for AGIs over 100k)
Self-employed pension: $18,385 (reported on 0.3% of returns)
Here:
$18,385
Tennessee:
$16,857
Total itemized deductions: $16,932 (22% of AGI, reported on 12.1% of returns)
Here:
$16,932
State:
$18,035
Here:
22.3% of AGI
State:
19.9% of AGI
(% of AGI for various income ranges: 5.9% for AGIs below $10k, 3.1% for AGIs $10k-25k, 5.1% for AGIs $25k-50k, 7.5% for AGIs $50k-75k, 7.3% for AGIs $75k-100k, 10.3% for AGIs over 100k)
Charity contributions deductions: $4,383 (5% of AGI, reported on 10.3% of returns)
Here:
$4,383
State:
$5,167
Here:
5.5% of AGI
State:
5.3% of AGI
(% of AGI for various income ranges: 0.5% for AGIs below $10k, 0.4% for AGIs $10k-25k, 0.7% for AGIs $25k-50k, 1.5% for AGIs $50k-75k, 2.2% for AGIs $75k-100k, 3.0% for AGIs over 100k)
Total tax: $4,354 (reported on 69.7% of returns)
38570:
$4,354
State:
$7,482
(% of AGI for various income ranges: 5.9% for AGIs below $10k, 3.9% for AGIs $10k-25k, 6.3% for AGIs $25k-50k, 8.5% for AGIs $50k-75k, 11.2% for AGIs $75k-100k, 20.8% for AGIs over 100k)
Earned income credit: $1,723 (reported on 24.2% of returns)
Here:
$1,723
State:
$1,826
Percentage of individuals using paid preparers for their 2004 taxes: 77.7%
Here:
78%
State:
60%
(% for various income ranges: 73.7% for AGIs below $10k, 79.5% for AGIs $10k-25k, 79.1% for AGIs $25k-50k, 76.7% for AGIs $50k-75k, 75.4% for AGIs $75k-100k, 84.7% for AGIs over 100k)
Household received Food Stamps/SNAP in the past 12 months: 527 Household did not receive Food Stamps/SNAP in the past 12 months: 3,714
Women who had a birth in the past 12 months: 113 (106 now married, 8 unmarried) Women who did not have a birth in the past 12 months: 2,064 (962 now married, 1,102 unmarried)
Housing units in zip code 38570 with a mortgage: 1,245 (54 second mortgage, 55 both second mortgage and home equity loan) Houses without a mortgage: 36
Median monthly owner costs for units with a mortgage: $958 Median monthly owner costs for units without a mortgage: $362
Residents with income below the poverty level in 2022:
This zip code:
18.1%
Whole state:
13.3%
Residents with income below 50% of the poverty level in 2022:
This zip code:
12.3%
Whole state:
7.1%
Median number of rooms in houses and condos:
Here:
5.8
State:
6.5
Median number of rooms in apartments:
Here:
5.0
State:
4.4
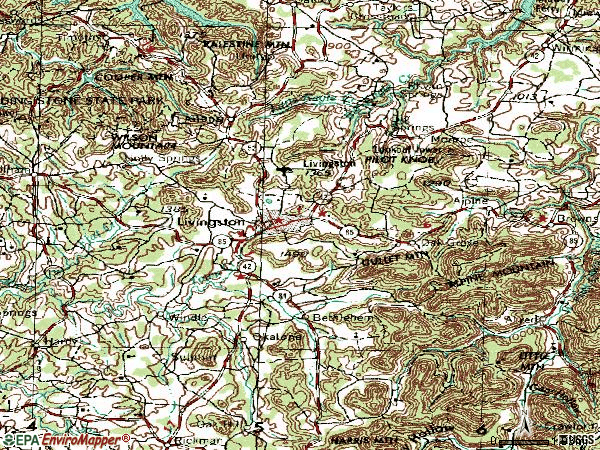
Notable locations in this zip code not listed on our city pages
Notable locations in zip code 38570: Livingston Fire Department (A), Overton County Rescue Squad (B), Fairgrounds Volunteer Fire Department (C), Overton County Courthouse (D), Overton County Ambulance Service (E). Display/hide their locations on the map
Churches in zip code 38570 include: Memorial Baptist Church (A), Livingston First Baptist Church (B), Flat Creek Church (C), Fredonia Church (D), Liberty Church (E), Ruth Chapel (F), Swallows Chapel (G), Walnut Grove Church (H), Henard Church (I). Display/hide their locations on the map
Cemeteries: Highland Cemetery (1), White Cemetery (2), Oak Grove Cemetery (3), Walnut Grove Cemetery (4), Ruths Chapel Cemetery (5), Okalona Cemetery (6), Nettlecarrier Creek Cemetery (7). Display/hide their locations on the map
Streams, rivers, and creeks: Town Creek (A), Copeland Creek (B), Crawford Branch (C), Zollicoffer Creek (D), Carr Creek (E), Nalier Branch (F), Sulphur Branch (G), Mathews Branch (H). Display/hide their locations on the map
1,202 married couples with children.
378 single-parent households (12 men, 366 women).
97.5% of residents of 38570 zip code speak English at home.
1.3% of residents speak Spanish at home (35% very well, 65% well).
0.9% of residents speak other Indo-European language at home (100% very well).
0.5% of residents speak Asian or Pacific Island language at home (79% very well, 21% well).
Foreign born population: 113 (1.1%) (66.6% of them are naturalized citizens)
This zip code:
1.1%
Whole state:
5.6%
58%France
11%Japan
5%Honduras
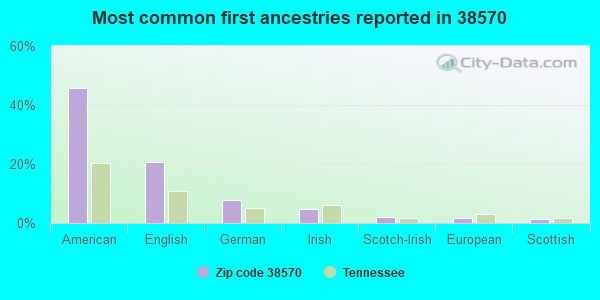
46%American
21%English
8%German
5%Irish
2%Scotch-Irish
2%European
2%Scottish
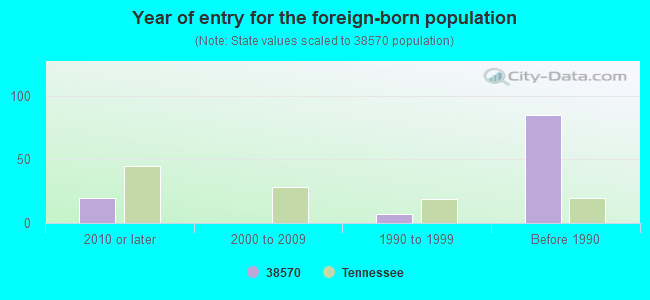
Year of entry for the foreign-born population
202010 or later
02000 to 2009
71990 to 1999
85Before 1990
Facilities with environmental interests located in this zip code:
AEROQUIP INOAC CORPORATION (132 INDUSTRIAL PARK CIRCLE in LIVINGSTON, TN)
AIR MAJOR (AIRS/AFS) CRITERIA AND HAZARDOUS AIR POLLUTANT INVENTORY (Inventory of air pollution sources) HAZARDOUS WASTE BIENNIAL REPORTER (Resource Conservation and Recovery Act (tracking hazardous waste)) - ICIS-, ENFORCEMENT/COMPLIANCE ACTIVITY Large Quantity Generators, more that 1000 kg of hazardous waste/month (Resource Conservation and Recovery Act (tracking hazardous waste)) - notification - ICIS-, ENFORCEMENT/COMPLIANCE ACTIVITY TRI REPORTER (Tracking of toxic chemicals releasing facilities) Business SIC classification: PLASTICS PRODUCTS; AUTOMOTIVE STAMPINGS Business NAICS classification: ALL OTHER PLASTICS PRODUCT MANUFACTURING. Organizations: EATON INOAC COMPANY (CONTACT/OPERATOR)
Alternative names: EATON INOAC CO
A H ROBERTS ELEMENTARY SCHOOL (301 ZACHARY ST in LIVINGSTON, TN)
(Geographic Names Information System) (National Center for Education Statistics) - STATE ID-0065 Organizations: OVERTON COUNTY SCHOOL DISTRICT (SCHOOL DISTRICT)
Alternative names: A H ROBERTS SCHOOL
ADVANCED ENVIRONMENTAL INDUSTRIES INC. (633 MONTEREY HWY. in LIVINGSTON, TN)
(Resource Conservation and Recovery Act (tracking hazardous waste))
BRAD RAGAN TIRE & APPLIANCE (BRADFORD HICKS DR in LIVINGSTON, TN)
(Resource Conservation and Recovery Act (tracking hazardous waste)) Business NAICS classification: GENERAL AUTOMOTIVE REPAIR.
CUMBERLAND MANUFACTURING CO* (E CEDAR STREET in LIVINGSTON, TN)
(Resource Conservation and Recovery Act (tracking hazardous waste)) Business NAICS classification: UPHOLSTERED HOUSEHOLD FURNITURE MANUFACTURING.
DESIGN INTENT INC (825 OAKLAND PARK in LIVINGSTON, TN)
(Resource Conservation and Recovery Act (tracking hazardous waste)) Business NAICS classification: OTHER COMMERCIAL AND SERVICE INDUSTRY MACHINERY MANUFACTURING.
QUIN-T- GROUP/MACALLEN (BAY ROAD in NEWMARKET, NH)
CRITERIA AND HAZARDOUS AIR POLLUTANT INVENTORY (Inventory of air pollution sources) Business SIC classification: NONMETALLIC MINERAL PRODUCTS Business NAICS classification: NONCURRENT-CARRYING WIRING DEVICE MANUFACTURING.
Housing units lacking complete plumbing facilities: 5.4% Housing units lacking complete kitchen facilities: 3.6%
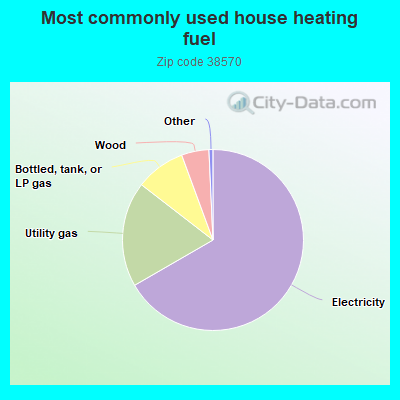
66.6%Electricity
18.8%Utility gas
8.9%Bottled, tank, or LP gas
4.9%Wood
Population in 1990: 7,274. Population change in the 1990s: +2,416 (+33.2%).
Place of birth for U.S.-born residents:
This state: 7,544
Northeast: 258
Midwest: 1,237
South: 899
West: 125
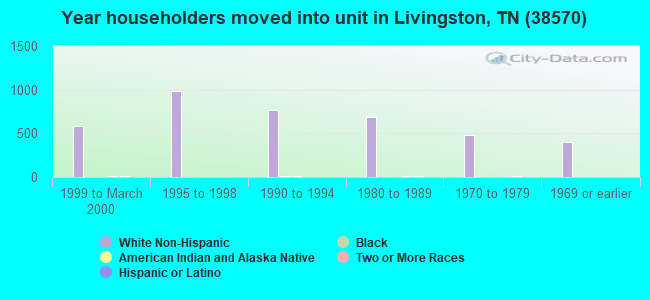
66% of the 38570 zip code residents lived in the same house 5 years ago. Out of people who lived in different houses, 60% lived in this county. Out of people who lived in different counties, 50% lived in Tennessee.
92% of the 38570 zip code residents lived in the same house 1 year ago. Out of people who lived in different houses, 65% moved from this county. Out of people who lived in different houses, 22% moved from different county within same state. Out of people who lived in different houses, 11% moved from different state.
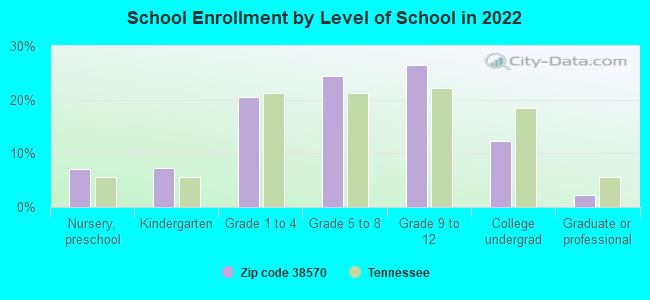
Private vs. public school enrollment:
Students in private schools in grades 1 to 8 (elementary and middle school): 64
Here:
7.2%
Tennessee:
15.0%
Students in private schools in grades 9 to 12 (high school): 79
Here:
14.9%
Tennessee:
16.2%
Students in private undergraduate colleges: 24
Here:
9.8%
Tennessee:
23.5%
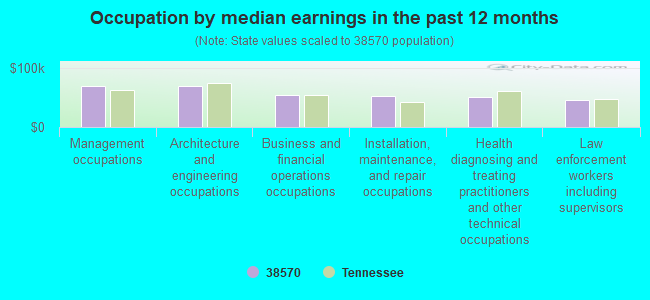
Occupation by median earnings in the past 12 months ($)
69,450Management occupations
69,126Architecture and engineering occupations
53,249Business and financial operations occupations
51,682Installation, maintenance, and repair occupations
50,603Health diagnosing and treating practitioners and other technical occupations
46,010Law enforcement workers including supervisors
Companies with federal contracts located in this zip code (LIVINGSTON, TN):
S & N PROPERTIES (2191 COOKEVILLE HWY; small business) : $305,068 in 25 contractsfrom 2004 to 2006
Contracts for Lease or Rental of Facilities -- Office Buildings by Public Buildings Service Signed by year:2000: $0; 2001: $0; 2002: $0; 2003: $0; 2004: $66,012; 2005: $165,960; 2006: $73,096.
Biggest contracts:
$22,004 with Public Buildings Service for Lease or Rental of Facilities -- Office Buildings. Signed on 2006-04-01. Completion date: 2006-09-30.
$22,004, same as above.Signed on 2006-04-01. Completion date: 2006-09-30.
$22,004, same as above.Signed on 2005-01-01. Completion date: 2005-09-30.
$22,004, same as above.Signed on 2005-04-01. Completion date: 2005-09-30.
LIVINGSTON LIMESTONE CO, INC (215 SCHOOL MOUNTAIN RD; small business) : $83,600 in 7 contractsfrom 2004 to 2005
Contracts for Mining, Rock Drilling, Earth Boring and Related Equipment by Army, U.S. Army Corps of Engineers - civil program financing only Signed by year:2000: $0; 2001: $0; 2002: $0; 2003: $0; 2004: $5,850; 2005: $77,750; 2006: $0.
Biggest contracts:
$24,929 with Army for Mining, Rock Drilling, Earth Boring and Related Equipment. Signed on 2005-08-16. Completion date: 2005-08-26.
$24,929 with U.S. Army Corps of Engineers - civil program financing only for Mining, Rock Drilling, Earth Boring and Related Equipment. Signed on 2005-08-16. Completion date: 2005-08-26.
$7,750 with Army for Mining, Rock Drilling, Earth Boring and Related Equipment. Signed on 2005-08-12. Completion date: 2005-08-26.
$7,750 with U.S. Army Corps of Engineers - civil program financing only for Mining, Rock Drilling, Earth Boring and Related Equipment. Signed on 2005-08-12. Completion date: 2005-08-26.
L & T SERVICE COMPANY (967 GARRETT MILL ROAD; small business)
$17,868 with Army for Power and Hand Pumps. Signed on 2005-08-10. Completion date: 2005-09-23.
UPTON, JOE T DDS (415 E UNIVERSITY ST; small business) : $9,759 in 3 contractsfrom 2004 to 2005
$6,514 with Army for Dentistry Services. Signed on 2004-05-13. Completion date: 2004-05-28.
$3,575, same as above.Signed on 2004-03-31. Completion date: 2004-04-02.
-$330, same as above.Signed on 2005-04-18. Completion date: 2004-04-02.
Top industries in this zip code by the number of employees in 2005:
Health Care and Social Assistance: General Medical and Surgical Hospitals (250-499 employees: 1 establishment)
Health Care and Social Assistance: Offices of Physicians (except Mental Health Specialists) (20-49: 2, 10-19: 1, 5-9: 1, 1-4: 4)
Construction: Commercial and Institutional Building Construction (50-99: 1, 1-4: 2)
People in group quarters in 2010:
142 people in local jails and other municipal confinement facilities
126 people in nursing facilities/skilled-nursing facilities
18 people in group homes intended for adults
People in group quarters in 2000:
143 people in nursing homes
22 people in local jails and other confinement facilities (including police lockups)
10 people in other noninstitutional group quarters
Fatal accident statistics in 2014:
Fatal accident count: 2
Vehicles involved in fatal accidents: 3
Fatal accidents caused by drunken drivers: 0
Fatalities: 2
Persons involved in fatal accidents: 3
Pedestrians involved in fatal accidents: 1
Fatal accident statistics in 2013:
Fatal accident count: 3
Vehicles involved in fatal accidents: 6
Fatal accidents caused by drunken drivers: 1
Fatalities: 3
Persons involved in fatal accidents: 7
Pedestrians involved in fatal accidents: 0
2002 - 2018 National Fire Incident Reporting System (NFIRS) incidents
According to the data from the years 2002 - 2018 the average number of fire incidents per year is 46. The highest number of fires - 72 took place in 2010, and the least - 8 in 2003. The data has a growing trend.
When looking into fire subcategories, the most reports belonged to: Structure Fires (48.4%), and Outside Fires (30.9%).
Fire incident types reported to NFIRS in Zip Code 38570


 Nearest zip codes: 38580, 38542, 38573, 38568, 38541, 38543.
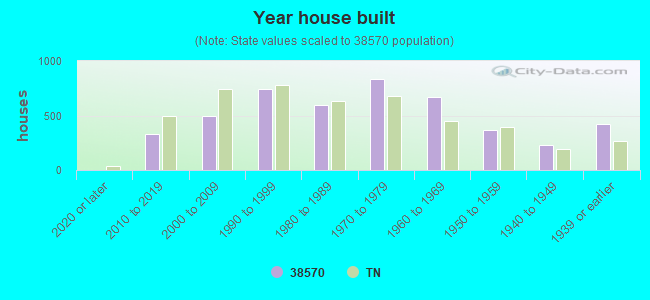


 According to the data from the years 2002 - 2018 the average number of fire incidents per year is 46. The highest number of fires - 72 took place in 2010, and the least - 8 in 2003. The data has a growing trend.
 When looking into fire subcategories, the most reports belonged to: Structure Fires (48.4%), and Outside Fires (30.9%).