Estimated zip code population in 2022: 25,734 Zip code population in 2010: 23,825 Zip code population in 2000: 21,328
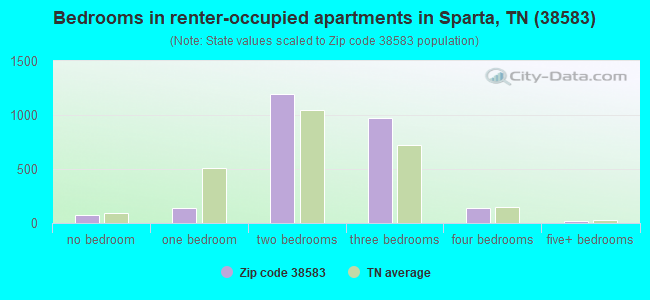
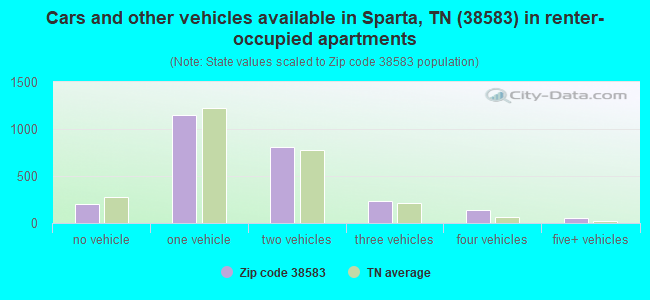
Houses and condos: 11,639 Renter-occupied apartments: 2,558
% of renters here:
25%
State:
33%
March 2022 cost of living index in zip code 38583: 80.2 (low, U.S. average is 100)
Land area: 358.2 sq. mi. Water area: 4.2 sq. mi.
Population density: 72 people per square mile
(very low).
OSM Map
General Map
Google Map
MSN Map
OSM Map
General Map
Google Map
MSN Map
OSM Map
General Map
Google Map
MSN Map
OSM Map
General Map
Google Map
MSN Map
Please wait while loading the map...
Real estate property taxes paid for housing units in 2022:
This zip code:
0.4% ($757)
Tennessee:
0.5% ($1,376)
Median real estate property taxes paid for housing units with mortgages in 2022: $825 (0.4%) Median real estate property taxes paid for housing units with no mortgage in 2022: $704 (0.4%)
Averages for the 2020 tax year for zip code 38583, filed in 2021:
Average Adjusted Gross Income (AGI) in 2020: $47,428 (Individual Income Tax Returns)
Here:
$47,428
State:
$69,014
Salary/wage: $40,405 (reported on 78.7% of returns)
Here:
$40,405
State:
$55,872
(% of AGI for various income ranges: 1063.1% for AGIs below $25k, 3279.4% for AGIs $25k-50k, 6243.3% for AGIs $50k-75k, 8525.5% for AGIs $75k-100k, 14386.2% for AGIs $100k-200k, 49044.0% for AGIs over 200k)
Taxable interest for individuals: $1,394 (reported on 23.7% of returns)
This zip code:
$1,394
Tennessee:
$1,945
(% of AGI for various income ranges: 15.2% for AGIs below $25k, 20.0% for AGIs $25k-50k, 55.8% for AGIs $50k-75k, 51.7% for AGIs $75k-100k, 175.3% for AGIs $100k-200k, 1402.0% for AGIs over 200k)
Ordinary dividends: $3,613 (reported on 9.9% of returns)
Here:
$3,613
State:
$8,105
(% of AGI for various income ranges: 11.9% for AGIs below $25k, 20.1% for AGIs $25k-50k, 34.7% for AGIs $50k-75k, 80.0% for AGIs $75k-100k, 219.6% for AGIs $100k-200k, 1858.0% for AGIs over 200k)
Net capital gain/loss in AGI: +$17,244 (reported on 10.1% of returns)
Here:
+$17,244
State:
+$33,664
(% of AGI for various income ranges: 13.7% for AGIs below $25k, 30.2% for AGIs $25k-50k, 93.1% for AGIs $50k-75k, 174.2% for AGIs $75k-100k, 814.7% for AGIs $100k-200k, 23308.0% for AGIs over 200k)
Profit/loss from business: +$16,031 (reported on 17.3% of returns)
Here:
+$16,031
State:
+$18,991
(% of AGI for various income ranges: 152.5% for AGIs below $25k, 157.4% for AGIs $25k-50k, 269.7% for AGIs $50k-75k, 405.8% for AGIs $75k-100k, 1115.7% for AGIs $100k-200k, 19450.0% for AGIs over 200k)
Taxable individual retirement arrangement distribution: $15,845 (reported on 8.2% of returns)
38583:
$15,845
Tennessee:
$20,036
(% of AGI for various income ranges: 55.7% for AGIs below $25k, 82.8% for AGIs $25k-50k, 188.6% for AGIs $50k-75k, 397.7% for AGIs $75k-100k, 1029.8% for AGIs $100k-200k)
Self-employed (Keogh) retirement plans: $17,500 (reported on 0.3% of returns)
38583:
$17,500
Tennessee:
$28,955
(% of AGI for various income ranges: 99.1% for AGIs $100k-200k)
Total itemized deductions: $41,562 (reported on 2.2% of returns)
Here:
$41,562
State:
$40,136
(% of AGI for various income ranges: 47.7% for AGIs $25k-50k, 123.4% for AGIs $50k-75k, 142.3% for AGIs $75k-100k, 415.3% for AGIs $100k-200k, 8242.0% for AGIs over 200k)
Charity contributions: $17,525 (reported on 1.8% of returns)
Here:
$17,525
State:
$19,852
(% of AGI for various income ranges: 8.7% for AGIs $25k-50k, 51.6% for AGIs $50k-75k, 170.0% for AGIs $100k-200k, 3546.0% for AGIs over 200k)
Taxes paid: $4,878 (reported on 2.1% of returns)
38583:
$4,878
State:
$6,038
(% of AGI for various income ranges: 4.5% for AGIs $25k-50k, 8.9% for AGIs $50k-75k, 19.5% for AGIs $75k-100k, 69.4% for AGIs $100k-200k, 800.0% for AGIs over 200k)
Earned income credit: $2,305 (reported on 23.0% of returns)
Here:
$2,305
State:
$2,391
(% of AGI for various income ranges: 103.3% for AGIs below $25k, 85.9% for AGIs $25k-50k, 2.1% for AGIs $50k-75k)
Percentage of individuals using paid preparers for their 2020 taxes: 95.3%
Here:
95%
State:
93%
(% for various income ranges: 94.6% for AGIs below $25k, 96.6% for AGIs $25k-50k, 94.9% for AGIs $50k-75k, 95.6% for AGIs $75k-100k, 94.4% for AGIs $100k-200k, 100.0% for AGIs over 200k)
Averages for the 2012 tax year for zip code 38583, filed in 2013:
Average Adjusted Gross Income (AGI) in 2012: $37,780 (Individual Income Tax Returns)
Here:
$37,780
State:
$53,767
Salary/wage: $32,707 (reported on 82.0% of returns)
Here:
$32,707
State:
$45,421
(% of AGI for various income ranges: 72.1% for AGIs below $25k, 79.9% for AGIs $25k-50k, 75.9% for AGIs $50k-75k, 75.0% for AGIs $75k-100k, 64.2% for AGIs $100k-200k, 37.2% for AGIs over 200k)
Taxable interest for individuals: $1,514 (reported on 25.7% of returns)
This zip code:
$1,514
Tennessee:
$1,732
(% of AGI for various income ranges: 1.0% for AGIs below $25k, 0.6% for AGIs $25k-50k, 1.0% for AGIs $50k-75k, 0.9% for AGIs $75k-100k, 1.6% for AGIs $100k-200k, 1.5% for AGIs over 200k)
Ordinary dividends: $3,207 (reported on 10.5% of returns)
Here:
$3,207
State:
$6,739
(% of AGI for various income ranges: 0.6% for AGIs below $25k, 0.4% for AGIs $25k-50k, 0.7% for AGIs $50k-75k, 0.8% for AGIs $75k-100k, 1.6% for AGIs $100k-200k, 2.0% for AGIs over 200k)
Net capital gain/loss in AGI: +$8,423 (reported on 10.5% of returns)
Here:
+$8,423
State:
+$19,082
(% of AGI for various income ranges: 0.3% for AGIs below $25k, 0.6% for AGIs $25k-50k, 1.0% for AGIs $50k-75k, 1.5% for AGIs $75k-100k, 4.5% for AGIs $100k-200k, 12.3% for AGIs over 200k)
Profit/loss from business: +$12,721 (reported on 19.3% of returns)
Here:
+$12,721
State:
+$15,240
(% of AGI for various income ranges: 11.6% for AGIs below $25k, 3.7% for AGIs $25k-50k, 3.3% for AGIs $50k-75k, 3.5% for AGIs $75k-100k, 8.0% for AGIs $100k-200k, 14.6% for AGIs over 200k)
Taxable individual retirement arrangement distribution: $11,829 (reported on 8.4% of returns)
38583:
$11,829
Tennessee:
$15,505
(% of AGI for various income ranges: 2.6% for AGIs below $25k, 2.0% for AGIs $25k-50k, 2.5% for AGIs $50k-75k, 3.4% for AGIs $75k-100k, 4.8% for AGIs $100k-200k)
Self-employment retirement plans: $12,500 (reported on 0.3% of returns)
38583:
$12,500
Tennessee:
$22,567
Total itemized deductions: $19,036 (23% of AGI, reported on 12.8% of returns)
Here:
$19,036
State:
$21,976
Here:
23.4% of AGI
State:
17.8% of AGI
(% of AGI for various income ranges: 4.0% for AGIs below $25k, 5.9% for AGIs $25k-50k, 7.1% for AGIs $50k-75k, 6.7% for AGIs $75k-100k, 8.9% for AGIs $100k-200k, 6.6% for AGIs over 200k)
Charity contributions: $5,995 (reported on 9.0% of returns)
Here:
$5,995
State:
$6,709
(% of AGI for various income ranges: 0.4% for AGIs below $25k, 0.9% for AGIs $25k-50k, 1.3% for AGIs $50k-75k, 1.6% for AGIs $75k-100k, 2.4% for AGIs $100k-200k, 3.3% for AGIs over 200k)
Taxes paid: $3,231 (reported on 12.4% of returns)
38583:
$3,231
State:
$4,829
(% of AGI for various income ranges: 0.4% for AGIs below $25k, 0.9% for AGIs $25k-50k, 1.1% for AGIs $50k-75k, 1.3% for AGIs $75k-100k, 1.7% for AGIs $100k-200k, 1.3% for AGIs over 200k)
Earned income credit: $2,442 (reported on 29.0% of returns)
Here:
$2,442
State:
$2,404
(% of AGI for various income ranges: 8.6% for AGIs below $25k, 1.6% for AGIs $25k-50k)
Percentage of individuals using paid preparers for their 2012 taxes: 63.0%
Here:
63%
State:
52%
(% for various income ranges: 59.5% for AGIs below $25k, 64.2% for AGIs $25k-50k, 67.2% for AGIs $50k-75k, 66.7% for AGIs $75k-100k, 74.4% for AGIs $100k-200k, 85.7% for AGIs over 200k)
Averages for the 2004 tax year for zip code 38583, filed in 2005:
Average Adjusted Gross Income (AGI) in 2004: $31,587 (Individual Income Tax Returns)
Here:
$31,587
State:
$44,088
Salary/wage: $29,254 (reported on 83.9% of returns)
Here:
$29,254
State:
$38,825
(% of AGI for various income ranges: 107.1% for AGIs below $10k, 80.0% for AGIs $10k-25k, 84.8% for AGIs $25k-50k, 84.4% for AGIs $50k-75k, 77.1% for AGIs $75k-100k, 47.8% for AGIs over 100k)
Taxable interest for individuals: $1,711 (reported on 31.6% of returns)
This zip code:
$1,711
Tennessee:
$1,802
(% of AGI for various income ranges: 6.1% for AGIs below $10k, 1.9% for AGIs $10k-25k, 1.3% for AGIs $25k-50k, 1.3% for AGIs $50k-75k, 1.2% for AGIs $75k-100k, 2.7% for AGIs over 100k)
Taxable dividends: $3,066 (reported on 12.4% of returns)
Here:
$3,066
State:
$3,727
(% of AGI for various income ranges: 2.2% for AGIs below $10k, 0.5% for AGIs $10k-25k, 0.4% for AGIs $25k-50k, 0.7% for AGIs $50k-75k, 0.8% for AGIs $75k-100k, 4.4% for AGIs over 100k)
Net capital gain/loss: +$9,900 (reported on 11.7% of returns)
Here:
+$9,900
State:
+$15,776
(% of AGI for various income ranges: 1.0% for AGIs below $10k, 0.9% for AGIs $10k-25k, 0.8% for AGIs $25k-50k, 1.5% for AGIs $50k-75k, 2.7% for AGIs $75k-100k, 16.2% for AGIs over 100k)
Profit/loss from business: +$9,658 (reported on 19.6% of returns)
Here:
+$9,658
State:
+$12,882
(% of AGI for various income ranges: 17.8% for AGIs below $10k, 7.2% for AGIs $10k-25k, 3.5% for AGIs $25k-50k, 3.6% for AGIs $50k-75k, 6.5% for AGIs $75k-100k, 10.7% for AGIs over 100k)
IRA payment deduction: $2,969 (reported on 2.2% of returns)
38583:
$2,969
Tennessee:
$2,934
(% of AGI for various income ranges: 0.2% for AGIs $10k-25k, 0.3% for AGIs $25k-50k, 0.2% for AGIs $50k-75k, 0.2% for AGIs $75k-100k, 0.2% for AGIs over 100k)
Self-employed pension: $15,542 (reported on 0.3% of returns)
Here:
$15,542
Tennessee:
$16,857
Total itemized deductions: $16,051 (25% of AGI, reported on 12.7% of returns)
Here:
$16,051
State:
$18,035
Here:
24.7% of AGI
State:
19.9% of AGI
(% of AGI for various income ranges: 4.2% for AGIs below $10k, 3.5% for AGIs $10k-25k, 6.0% for AGIs $25k-50k, 6.9% for AGIs $50k-75k, 8.5% for AGIs $75k-100k, 8.9% for AGIs over 100k)
Charity contributions deductions: $4,163 (6% of AGI, reported on 10.3% of returns)
Here:
$4,163
State:
$5,167
Here:
6.2% of AGI
State:
5.3% of AGI
(% of AGI for various income ranges: 0.3% for AGIs below $10k, 0.5% for AGIs $10k-25k, 1.0% for AGIs $25k-50k, 1.4% for AGIs $50k-75k, 1.9% for AGIs $75k-100k, 2.8% for AGIs over 100k)
Total tax: $3,994 (reported on 70.0% of returns)
38583:
$3,994
State:
$7,482
(% of AGI for various income ranges: 5.0% for AGIs below $10k, 4.0% for AGIs $10k-25k, 6.1% for AGIs $25k-50k, 8.6% for AGIs $50k-75k, 11.2% for AGIs $75k-100k, 19.1% for AGIs over 100k)
Earned income credit: $1,751 (reported on 25.2% of returns)
Here:
$1,751
State:
$1,826
Percentage of individuals using paid preparers for their 2004 taxes: 71.5%
Here:
71%
State:
60%
(% for various income ranges: 64.9% for AGIs below $10k, 74.3% for AGIs $10k-25k, 72.7% for AGIs $25k-50k, 71.9% for AGIs $50k-75k, 74.2% for AGIs $75k-100k, 76.0% for AGIs over 100k)
Likely homosexual households (counted as self-reported same-sex unmarried-partner households)
Lesbian couples: 0.1% of all households
Gay men: 0.0% of all households
Household received Food Stamps/SNAP in the past 12 months: 1,332 Household did not receive Food Stamps/SNAP in the past 12 months: 9,056
Women who had a birth in the past 12 months: 209 (142 now married, 66 unmarried) Women who did not have a birth in the past 12 months: 5,299 (2,563 now married, 2,736 unmarried)
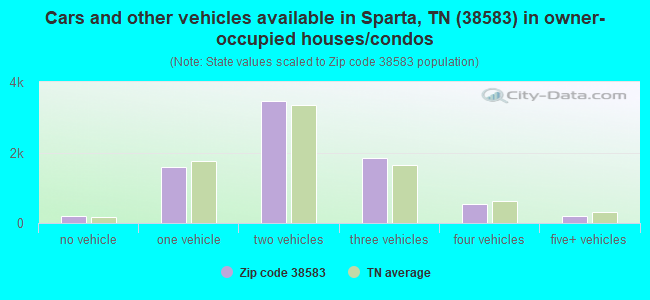
Housing units in zip code 38583 with a mortgage: 3,581 (237 second mortgage, 24 home equity loan, 137 both second mortgage and home equity loan) Houses without a mortgage: 119
Median monthly owner costs for units with a mortgage: $1,128 Median monthly owner costs for units without a mortgage: $360
Residents with income below the poverty level in 2022:
This zip code:
15.5%
Whole state:
13.3%
Residents with income below 50% of the poverty level in 2022:
This zip code:
9.3%
Whole state:
7.1%
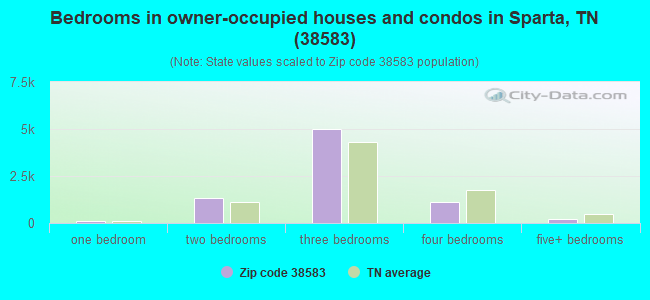
Median number of rooms in houses and condos:
Here:
6.0
State:
6.5
Median number of rooms in apartments:
Here:
4.9
State:
4.4
Notable locations in this zip code not listed on our city pages
Notable locations in zip code 38583: Hutchins College (A), Hensley Chapel (B), White County Fairgrounds (C), Sparta Industrial Park (D), Sparta Golf and Country Club (E), Key (F), DeKalb County Landfill (G), Rockhouse (H), Goulden Mountain (I), Camp Shuerman (J), Camp Belle Aire (K), Indian Mound (L), Mount Gilead Volunteer Fire and Rescue (M), Eastland Fire and Rescue (N), Dekalb County Fire Department Station 68 (O), District 9 Eastland Fire and Rescue (P), Hickory Valley Fire and Rescue (Q), District 7 North End Fire and Rescue (R), District 2 Fire and Rescue Bon de Croft (S), Sparta Fire and Rescue Station 2 (T). Display/hide their locations on the map
Churches in zip code 38583 include: Smith Chapel (A), Bethel Church (B), Camp Church (C), Plainview Church (D), Saint Charles Church (E), Hickory Valley Church (F), Pleasant Hill Church (G), Shiloh Church (H), Frazer Chapel (I). Display/hide their locations on the map
Cemeteries: Howell Cemetery (1), Hurd Cemetery (2), Hutchings Cemetery (3), Union Cemetery (4), Fraziers Chapel Cemetery (5), Southern Cemetery (6), Anderson Cemetery (7). Display/hide their locations on the map
Lakes and reservoirs: Duck Pond (A), Doe Creek Lake (B), Spain Lake (C), Boiling Pond (D), Lake Alice (E), Buck Creek Lake (F), Davis Lake Number Two (G), Billy Branch Lake (H). Display/hide their locations on the map
Streams, rivers, and creeks: Long Branch (A), Lake Creek (B), Wildcat Creek (C), Irvin Branch (D), Gastens Branch (E), England Cove (F), Simms Branch (G), Dry Creek (H), Deer Hollow Branch (I). Display/hide their locations on the map
Parks in zip code 38583 include: Johnson Chapel Recreation Area (1), Ragland Bottom Recreation Area (2), Rockhouse State Memorial (3), Virgin Falls State Natural Area (4). Display/hide their locations on the map
3,214 married couples with children.
1,267 single-parent households (436 men, 831 women).
98.4% of residents of 38583 zip code speak English at home.
0.8% of residents speak Spanish at home (89% very well, 11% well).
0.3% of residents speak other Indo-European language at home (100% very well).
0.3% of residents speak Asian or Pacific Island language at home (74% very well, 26% well).
0.2% of residents speak other language at home (100% very well).
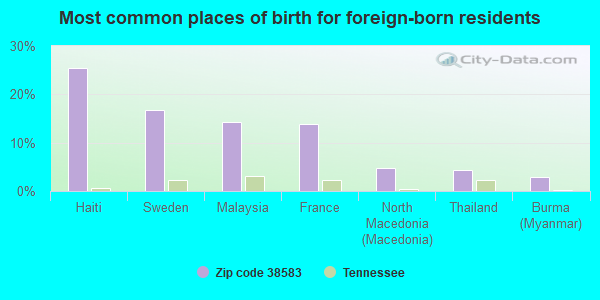
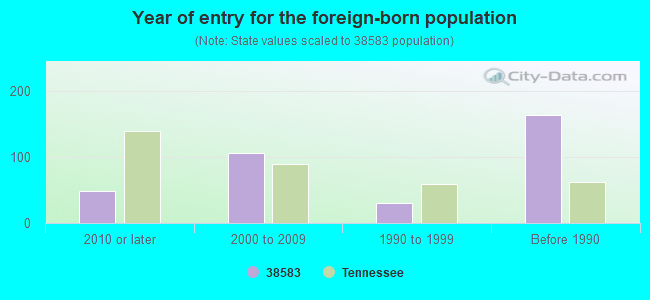
Foreign born population: 274 (1.1%) (49.8% of them are naturalized citizens)
This zip code:
1.1%
Whole state:
5.6%
26%Haiti
17%Sweden
14%Malaysia
14%France
5%North Macedonia (Macedonia)
4%Thailand
3%Burma (Myanmar)
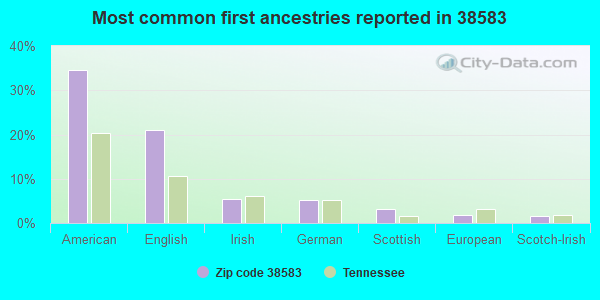
34%American
21%English
5%Irish
5%German
3%Scottish
2%European
2%Scotch-Irish
Year of entry for the foreign-born population
492010 or later
1062000 to 2009
311990 to 1999
164Before 1990
Facilities with environmental interests located in this zip code:
CASSVILLE ELEMENTARY SCHOOL (261 WILL THOMPSON RD in SPARTA, TN)
(Geographic Names Information System) (National Center for Education Statistics) - STATE ID-0015 Organizations: WHITE COUNTY SCHOOL DISTRICT (SCHOOL DISTRICT)
CUSTOM CARE CLEANERS (11 SPRING STREET in SPARTA, TN)
AIR MINOR (AIRS/AFS) Conditionally Exempt Small Quantity Generators, less than 100 kg/month of hazardous waste (Resource Conservation and Recovery Act (tracking hazardous waste)) - notification Business SIC classification: COIN-OPERATED LAUNDRIES AND DRYCLEANING Organizations: IMAGE PLNS ENTERPRISES LLC (CONTACT/OWNER)
BRADY PRINTING & OFFICE SUPPLIES (555 WEST BOCKMAN WAY in SPARTA, TN)
(Resource Conservation and Recovery Act (tracking hazardous waste)) Alternative names: BRADY PRINTING & OFFICE SUPS
CAN-TEX IND PLASTIC DIV SPARTA PLANT (PO BOX 246 in SPARTA, TN)
(Resource Conservation and Recovery Act (tracking hazardous waste))
CUMBERLAND AERO INC (RT 8 BOX 485 in SPARTA, TN)
(Resource Conservation and Recovery Act (tracking hazardous waste))
DELWOOD FURNITURE CO INC (PO BOX 239 in SPARTA, TN)
(Resource Conservation and Recovery Act (tracking hazardous waste)) Business NAICS classification: NONUPHOLSTERED WOOD HOUSEHOLD FURNITURE MANUFACTURING.
Housing units lacking complete plumbing facilities: 4.0% Housing units lacking complete kitchen facilities: 3.2%
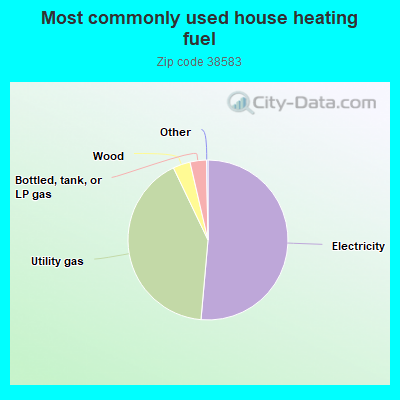
51.4%Electricity
41.5%Utility gas
3.5%Wood
3.3%Bottled, tank, or LP gas
Population in 1990: 16,814. Population change in the 1990s: +4,514 (+26.8%).
Place of birth for U.S.-born residents:
This state: 17,403
Northeast: 1,033
Midwest: 3,128
South: 2,948
West: 671
60% of the 38583 zip code residents lived in the same house 5 years ago. Out of people who lived in different houses, 59% lived in this county. Out of people who lived in different counties, 50% lived in Tennessee.
91% of the 38583 zip code residents lived in the same house 1 year ago. Out of people who lived in different houses, 40% moved from this county. Out of people who lived in different houses, 41% moved from different county within same state. Out of people who lived in different houses, 18% moved from different state. Out of people who lived in different houses, 2% moved from abroad.
Private vs. public school enrollment:
Students in private schools in grades 1 to 8 (elementary and middle school): 260
Here:
10.0%
Tennessee:
15.0%
Students in private schools in grades 9 to 12 (high school): 49
Here:
4.8%
Tennessee:
16.2%
Students in private undergraduate colleges: 73
Here:
14.6%
Tennessee:
23.5%
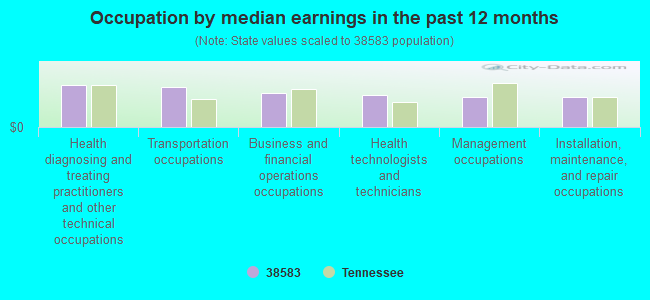
Occupation by median earnings in the past 12 months ($)
63,517Health diagnosing and treating practitioners and other technical occupations
59,781Transportation occupations
50,205Business and financial operations occupations
47,448Health technologists and technicians
45,199Management occupations
44,441Installation, maintenance, and repair occupations
Companies with federal contracts located in this zip code (SPARTA, TN):
AVERITT AVIATION, INC (750 AIRPORT ROAD)
$108,540 with Defense Logistics Agency for Liquid Propellants and Fuels, Petroleum Base. Signed on 2001-08-21. Completion date: 2004-03-31.
TRUE-TECH SYSTEMS (RR 3 BOX 934; small business) : $92,000 in 2 contractsfrom 2000 to 2004
$100,000 with Army for ADP Systems Analysis Services. Taking place in VA. Signed on 2000-08-24. Completion date: 2001-08-24.
-$8,000, same as above.Signed on 2004-03-22. Completion date: 2001-08-24.
UPPER CUMBERLAND REGIONAL AIRP (750 AIRPORT RD)
$72,059 with Defense Logistics Agency for Liquid Propellants and Fuels, Petroleum Base. Signed on 2004-02-17. Completion date: 2007-03-31.
BORUFF, BILL CHRYSLER, DODGE, (120 AUTO LANE; small business) : $32,526 in 5 contractsfrom 2002 to 2005
Contracts for Trailers by Army, U.S. Army Corps of Engineers - civil program financing only Signed by year:2000: $0; 2001: $0; 2002: $12,938; 2003: $8,588; 2004: $0; 2005: $11,000; 2006: $0.
Biggest contracts:
$12,938 with Army for Trailers. Signed on 2002-09-30. Completion date: 2002-10-30.
$7,200, same as above.Signed on 2003-02-18. Completion date: 2003-02-18.
$5,500, same as above.Signed on 2005-09-12. Completion date: 2005-09-23.
$5,500 with U.S. Army Corps of Engineers - civil program financing only for Trailers. Signed on 2005-09-12. Completion date: 2005-09-23.
HASTON, WAYMON T DDS (521A BEN LOMAND DR; small business) : $20,164 in 2 contractsin 2004
$15,034 with Army for Dentistry Services. Signed on 2004-06-15. Completion date: 2004-06-25.
$5,130, same as above.Signed on 2004-04-30. Completion date: 2004-04-30.
WATEC INC (1 E WALL ST) : $18,281 in 2 contractsfrom 2004 to 2005
$12,081 with Army for Water Purification Equipment. Taking place in TX. Signed on 2005-09-03. Completion date: 2005-09-07.
$6,200 with Army for Chemical Analysis Instruments. Taking place in FL. Signed on 2004-04-02. Completion date: 2004-04-14.
SECOND ACT DELI, THE (22 MAYBERRY ST; small business) : $6,810 in 2 contractsfrom 2004 to 2005
$7,015 with Army for Food Items For Resale. Signed on 2004-06-30. Completion date: 2004-06-29.
-$205, same as above.Signed on 2005-07-26. Completion date: 2004-06-29.
WATSON WINDOWS (288 BEECH RD; small business)
$6,390 with Army for Millwork. Signed on 2005-08-09. Completion date: 2005-09-02.
ROYAL INN MOTEL (803 VALLEY VIEW DR; small business)
$5,812 with Army for Lodging - Hotel/Motel. Signed on 2004-08-05. Completion date: 2004-06-22.
Top industries in this zip code by the number of employees in 2005:
Health Care and Social Assistance: Nursing Care Facilities (100-249 employees: 2 establishments, 1-4 employees: 1 establishment)
Health Care and Social Assistance: General Medical and Surgical Hospitals (100-249: 1)
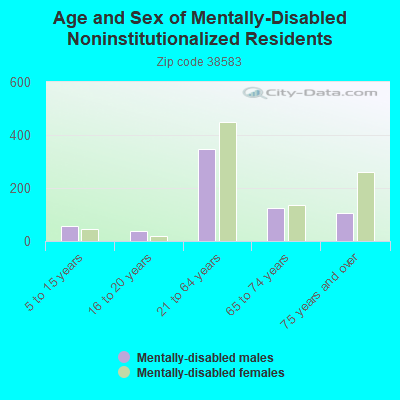
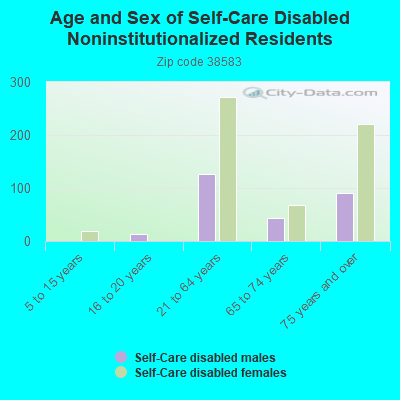
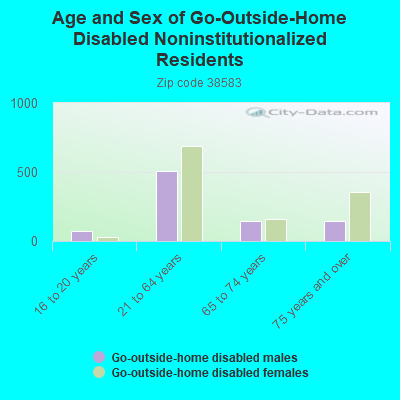
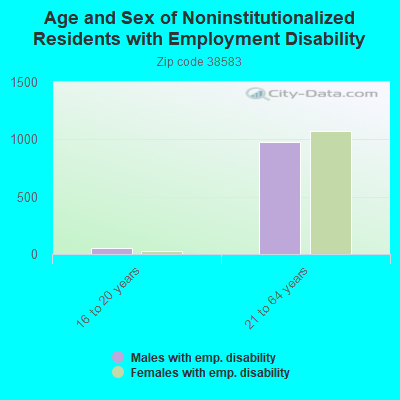
People in group quarters in 2010:
193 people in nursing facilities/skilled-nursing facilities
178 people in local jails and other municipal confinement facilities
16 people in correctional facilities intended for juveniles
11 people in residential treatment centers for adults
People in group quarters in 2000:
208 people in nursing homes
73 people in local jails and other confinement facilities (including police lockups)
18 people in other noninstitutional group quarters
16 people in residential treatment centers for emotionally disturbed children
10 people in halfway houses
8 people in homes for the mentally ill
8 people in other nonhousehold living situations
Fatal accident statistics in 2014:
Fatal accident count: 5
Vehicles involved in fatal accidents: 7
Fatal accidents caused by drunken drivers: 2
Fatalities: 5
Persons involved in fatal accidents: 11
Pedestrians involved in fatal accidents: 0
Fatal accident statistics in 2013:
Fatal accident count: 7
Vehicles involved in fatal accidents: 9
Fatal accidents caused by drunken drivers: 3
Fatalities: 7
Persons involved in fatal accidents: 12
Pedestrians involved in fatal accidents: 0
2002 - 2018 National Fire Incident Reporting System (NFIRS) incidents
Based on the data from the years 2002 - 2018 the average number of fires per year is 198. The highest number of fire incidents - 361 took place in 2014, and the least - 93 in 2018. The data has a decreasing trend.
When looking into fire subcategories, the most incidents belonged to: Structure Fires (44.4%), and Outside Fires (34.4%).
Fire incident types reported to NFIRS in Zip Code 38583

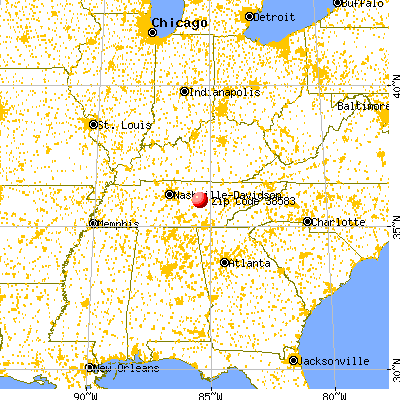


 Nearest zip codes: 38559, 38579, 38587, 38505, 38506, 38578.


 Based on the data from the years 2002 - 2018 the average number of fires per year is 198. The highest number of fire incidents - 361 took place in 2014, and the least - 93 in 2018. The data has a decreasing trend.
 When looking into fire subcategories, the most incidents belonged to: Structure Fires (44.4%), and Outside Fires (34.4%).