Estimated zip code population in 2022: 38,135 Zip code population in 2010: 34,198 Zip code population in 2000: 29,568
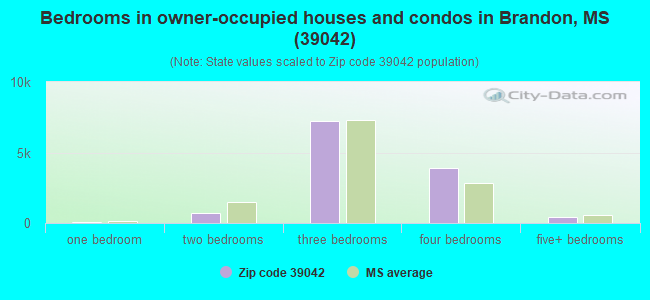
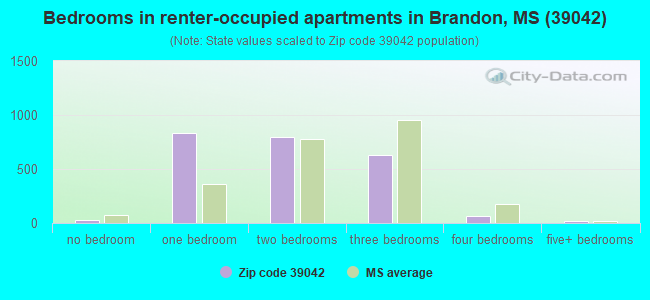
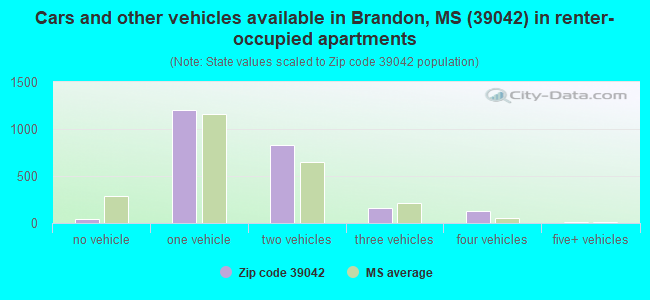
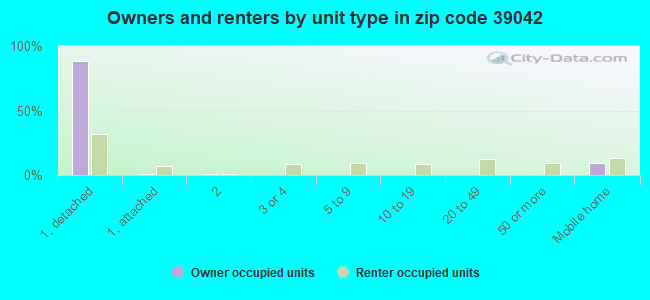
Houses and condos: 14,999 Renter-occupied apartments: 2,365
% of renters here:
16%
State:
30%
March 2022 cost of living index in zip code 39042: 84.2 (less than average, U.S. average is 100)
Land area: 223.1 sq. mi. Water area: 0.6 sq. mi.
Population density: 171 people per square mile
(very low).
OSM Map
General Map
Google Map
MSN Map
OSM Map
General Map
Google Map
MSN Map
OSM Map
General Map
Google Map
MSN Map
OSM Map
General Map
Google Map
MSN Map
Please wait while loading the map...
Real estate property taxes paid for housing units in 2022:
This zip code:
0.6% ($1,420)
Mississippi:
0.7% ($1,161)
Median real estate property taxes paid for housing units with mortgages in 2022: $1,558 (0.6%) Median real estate property taxes paid for housing units with no mortgage in 2022: $1,132 (0.5%)
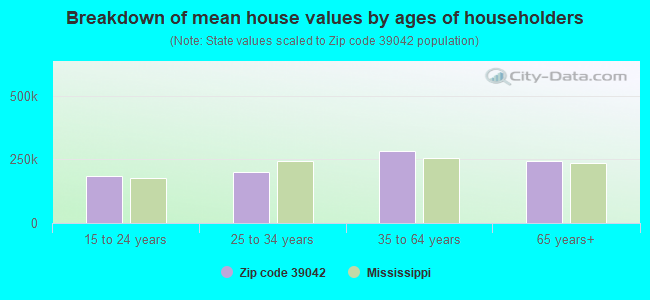
Estimated median house/condo value in 2022: $247,624
39042:
$247,624
Mississippi:
$162,500
According to our research of Mississippi and other state lists, there were 23 registered sex offenders living in 39042 zip code as of April 27, 2024. The ratio of all residents to sex offenders in zip code 39042 is 1,609 to 1. The ratio of registered sex offenders to all residents in this zip code is much lower than the state average.
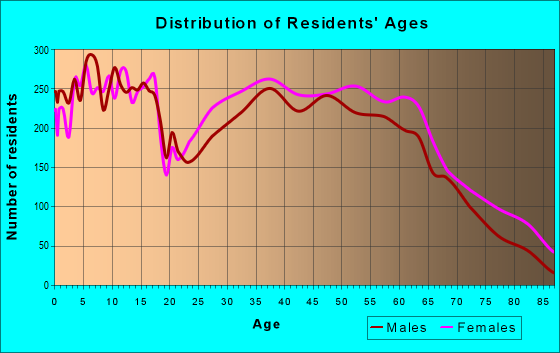
Median resident age:
This zip code:
42.6 years
Mississippi median age:
38.9 years
Average household size:
This zip code:
2.6 people
Mississippi:
2.5 people
Averages for the 2020 tax year for zip code 39042, filed in 2021:
Average Adjusted Gross Income (AGI) in 2020: $69,254 (Individual Income Tax Returns)
Here:
$69,254
State:
$54,084
Salary/wage: $61,205 (reported on 82.6% of returns)
Here:
$61,205
State:
$45,187
(% of AGI for various income ranges: 1214.3% for AGIs below $25k, 3766.3% for AGIs $25k-50k, 6766.2% for AGIs $50k-75k, 9618.5% for AGIs $75k-100k, 18885.0% for AGIs $100k-200k, 69447.2% for AGIs over 200k)
Taxable interest for individuals: $1,258 (reported on 28.5% of returns)
This zip code:
$1,258
Mississippi:
$1,434
(% of AGI for various income ranges: 14.7% for AGIs below $25k, 18.9% for AGIs $25k-50k, 43.9% for AGIs $50k-75k, 59.2% for AGIs $75k-100k, 111.9% for AGIs $100k-200k, 821.1% for AGIs over 200k)
Ordinary dividends: $4,255 (reported on 14.9% of returns)
Here:
$4,255
State:
$6,661
(% of AGI for various income ranges: 16.0% for AGIs below $25k, 24.5% for AGIs $25k-50k, 52.6% for AGIs $50k-75k, 115.4% for AGIs $75k-100k, 203.8% for AGIs $100k-200k, 1900.6% for AGIs over 200k)
Net capital gain/loss in AGI: +$11,136 (reported on 13.5% of returns)
Here:
+$11,136
State:
+$16,833
(% of AGI for various income ranges: 9.3% for AGIs below $25k, 16.3% for AGIs $25k-50k, 53.1% for AGIs $50k-75k, 126.0% for AGIs $75k-100k, 344.0% for AGIs $100k-200k, 8870.0% for AGIs over 200k)
Profit/loss from business: +$10,304 (reported on 17.8% of returns)
Here:
+$10,304
State:
+$7,724
(% of AGI for various income ranges: 102.9% for AGIs below $25k, 98.8% for AGIs $25k-50k, 196.6% for AGIs $50k-75k, 306.0% for AGIs $75k-100k, 379.0% for AGIs $100k-200k, 5793.9% for AGIs over 200k)
Taxable individual retirement arrangement distribution: $18,026 (reported on 9.0% of returns)
39042:
$18,026
Mississippi:
$17,717
(% of AGI for various income ranges: 56.9% for AGIs below $25k, 86.0% for AGIs $25k-50k, 213.7% for AGIs $50k-75k, 320.8% for AGIs $75k-100k, 541.0% for AGIs $100k-200k, 3079.4% for AGIs over 200k)
Self-employed (Keogh) retirement plans: $19,620 (reported on 0.3% of returns)
39042:
$19,620
Mississippi:
$27,458
(% of AGI for various income ranges: 20.9% for AGIs $100k-200k, 338.3% for AGIs over 200k)
Total itemized deductions: $31,470 (reported on 9.4% of returns)
Here:
$31,470
State:
$34,027
(% of AGI for various income ranges: 31.8% for AGIs below $25k, 109.3% for AGIs $25k-50k, 342.5% for AGIs $50k-75k, 483.5% for AGIs $75k-100k, 1157.4% for AGIs $100k-200k, 7300.6% for AGIs over 200k)
Charity contributions: $13,703 (reported on 8.4% of returns)
Here:
$13,703
State:
$14,997
(% of AGI for various income ranges: 4.4% for AGIs below $25k, 24.1% for AGIs $25k-50k, 97.1% for AGIs $50k-75k, 153.0% for AGIs $75k-100k, 436.0% for AGIs $100k-200k, 4020.6% for AGIs over 200k)
Taxes paid: $6,608 (reported on 9.4% of returns)
39042:
$6,608
State:
$6,353
(% of AGI for various income ranges: 3.4% for AGIs below $25k, 15.6% for AGIs $25k-50k, 60.5% for AGIs $50k-75k, 95.8% for AGIs $75k-100k, 285.2% for AGIs $100k-200k, 1447.8% for AGIs over 200k)
Earned income credit: $2,357 (reported on 15.2% of returns)
Here:
$2,357
State:
$2,689
(% of AGI for various income ranges: 108.4% for AGIs below $25k, 76.3% for AGIs $25k-50k, 1.0% for AGIs $50k-75k)
Percentage of individuals using paid preparers for their 2020 taxes: 92.4%
Here:
92%
State:
94%
(% for various income ranges: 91.6% for AGIs below $25k, 92.5% for AGIs $25k-50k, 91.8% for AGIs $50k-75k, 92.1% for AGIs $75k-100k, 93.5% for AGIs $100k-200k, 95.2% for AGIs over 200k)
Averages for the 2012 tax year for zip code 39042, filed in 2013:
Average Adjusted Gross Income (AGI) in 2012: $58,664 (Individual Income Tax Returns)
Here:
$58,664
State:
$46,197
Salary/wage: $50,971 (reported on 85.1% of returns)
Here:
$50,971
State:
$38,549
(% of AGI for various income ranges: 77.3% for AGIs below $25k, 79.1% for AGIs $25k-50k, 77.3% for AGIs $50k-75k, 78.3% for AGIs $75k-100k, 77.1% for AGIs $100k-200k, 51.9% for AGIs over 200k)
Taxable interest for individuals: $1,240 (reported on 32.1% of returns)
This zip code:
$1,240
Mississippi:
$1,482
(% of AGI for various income ranges: 1.1% for AGIs below $25k, 0.7% for AGIs $25k-50k, 0.6% for AGIs $50k-75k, 0.6% for AGIs $75k-100k, 0.5% for AGIs $100k-200k, 0.9% for AGIs over 200k)
Ordinary dividends: $3,028 (reported on 15.4% of returns)
Here:
$3,028
State:
$5,401
(% of AGI for various income ranges: 0.8% for AGIs below $25k, 0.7% for AGIs $25k-50k, 0.7% for AGIs $50k-75k, 0.6% for AGIs $75k-100k, 0.7% for AGIs $100k-200k, 1.3% for AGIs over 200k)
Net capital gain/loss in AGI: +$6,799 (reported on 12.1% of returns)
Here:
+$6,799
State:
+$12,121
(% of AGI for various income ranges: 0.3% for AGIs below $25k, 0.3% for AGIs $50k-75k, 0.5% for AGIs $75k-100k, 1.2% for AGIs $100k-200k, 6.0% for AGIs over 200k)
Profit/loss from business: +$10,253 (reported on 16.9% of returns)
Here:
+$10,253
State:
+$10,220
(% of AGI for various income ranges: 7.5% for AGIs below $25k, 2.2% for AGIs $25k-50k, 1.9% for AGIs $50k-75k, 1.9% for AGIs $75k-100k, 2.7% for AGIs $100k-200k, 4.5% for AGIs over 200k)
Taxable individual retirement arrangement distribution: $12,610 (reported on 9.7% of returns)
39042:
$12,610
Mississippi:
$13,665
(% of AGI for various income ranges: 2.9% for AGIs below $25k, 2.4% for AGIs $25k-50k, 2.2% for AGIs $50k-75k, 2.1% for AGIs $75k-100k, 2.0% for AGIs $100k-200k, 1.3% for AGIs over 200k)
Self-employment retirement plans: $13,583 (reported on 0.4% of returns)
39042:
$13,583
Mississippi:
$17,701
Total itemized deductions: $21,001 (21% of AGI, reported on 37.8% of returns)
Here:
$21,001
State:
$22,078
Here:
21.3% of AGI
State:
21.8% of AGI
(% of AGI for various income ranges: 9.7% for AGIs below $25k, 13.2% for AGIs $25k-50k, 13.7% for AGIs $50k-75k, 14.7% for AGIs $75k-100k, 14.5% for AGIs $100k-200k, 12.3% for AGIs over 200k)
Charity contributions: $6,106 (reported on 31.7% of returns)
Here:
$6,106
State:
$6,081
(% of AGI for various income ranges: 1.3% for AGIs below $25k, 2.3% for AGIs $25k-50k, 2.8% for AGIs $50k-75k, 3.3% for AGIs $75k-100k, 3.9% for AGIs $100k-200k, 4.5% for AGIs over 200k)
Taxes paid: $5,564 (reported on 37.7% of returns)
39042:
$5,564
State:
$5,794
(% of AGI for various income ranges: 1.4% for AGIs below $25k, 2.3% for AGIs $25k-50k, 3.0% for AGIs $50k-75k, 3.7% for AGIs $75k-100k, 4.5% for AGIs $100k-200k, 4.4% for AGIs over 200k)
Earned income credit: $2,458 (reported on 18.2% of returns)
Here:
$2,458
State:
$2,710
(% of AGI for various income ranges: 8.2% for AGIs below $25k, 1.2% for AGIs $25k-50k)
Percentage of individuals using paid preparers for their 2012 taxes: 53.3%
Here:
53%
State:
60%
(% for various income ranges: 50.1% for AGIs below $25k, 52.1% for AGIs $25k-50k, 53.6% for AGIs $50k-75k, 56.6% for AGIs $75k-100k, 56.3% for AGIs $100k-200k, 76.5% for AGIs over 200k)
Averages for the 2004 tax year for zip code 39042, filed in 2005:
Average Adjusted Gross Income (AGI) in 2004: $47,756 (Individual Income Tax Returns)
Here:
$47,756
State:
$36,110
Salary/wage: $43,514 (reported on 86.6% of returns)
Here:
$43,514
State:
$31,757
(% of AGI for various income ranges: 118.0% for AGIs below $10k, 79.9% for AGIs $10k-25k, 81.8% for AGIs $25k-50k, 82.0% for AGIs $50k-75k, 84.0% for AGIs $75k-100k, 70.1% for AGIs over 100k)
Taxable interest for individuals: $1,464 (reported on 39.2% of returns)
This zip code:
$1,464
Mississippi:
$1,649
(% of AGI for various income ranges: 4.4% for AGIs below $10k, 2.0% for AGIs $10k-25k, 1.3% for AGIs $25k-50k, 0.9% for AGIs $50k-75k, 0.8% for AGIs $75k-100k, 1.3% for AGIs over 100k)
Taxable dividends: $1,770 (reported on 20.3% of returns)
Here:
$1,770
State:
$3,089
(% of AGI for various income ranges: 2.6% for AGIs below $10k, 0.7% for AGIs $10k-25k, 0.6% for AGIs $25k-50k, 0.6% for AGIs $50k-75k, 0.6% for AGIs $75k-100k, 1.0% for AGIs over 100k)
Net capital gain/loss: +$5,719 (reported on 16.3% of returns)
Here:
+$5,719
State:
+$8,427
(% of AGI for various income ranges: -1.0% for AGIs below $10k, 0.1% for AGIs $10k-25k, 0.2% for AGIs $25k-50k, 0.4% for AGIs $50k-75k, 0.8% for AGIs $75k-100k, 5.3% for AGIs over 100k)
Profit/loss from business: +$9,707 (reported on 15.8% of returns)
Here:
+$9,707
State:
+$8,818
(% of AGI for various income ranges: 3.2% for AGIs below $10k, 4.6% for AGIs $10k-25k, 2.8% for AGIs $25k-50k, 3.1% for AGIs $50k-75k, 2.6% for AGIs $75k-100k, 3.5% for AGIs over 100k)
IRA payment deduction: $3,316 (reported on 2.3% of returns)
39042:
$3,316
Mississippi:
$3,024
(% of AGI for various income ranges: 0.1% for AGIs $10k-25k, 0.2% for AGIs $25k-50k, 0.2% for AGIs $50k-75k, 0.1% for AGIs $75k-100k, 0.1% for AGIs over 100k)
Self-employed pension: $13,295 (reported on 0.6% of returns)
Here:
$13,295
Mississippi:
$16,983
(% of AGI for various income ranges: 0.1% for AGIs $25k-50k, 0.1% for AGIs $50k-75k, 0.1% for AGIs $75k-100k, 0.4% for AGIs over 100k)
Total itemized deductions: $17,460 (22% of AGI, reported on 38.6% of returns)
Here:
$17,460
State:
$17,896
Here:
21.6% of AGI
State:
22.5% of AGI
(% of AGI for various income ranges: 10.2% for AGIs below $10k, 8.2% for AGIs $10k-25k, 12.7% for AGIs $25k-50k, 14.9% for AGIs $50k-75k, 15.6% for AGIs $75k-100k, 15.1% for AGIs over 100k)
Charity contributions deductions: $4,975 (6% of AGI, reported on 34.6% of returns)
Here:
$4,975
State:
$4,735
Here:
6.0% of AGI
State:
5.7% of AGI
(% of AGI for various income ranges: 1.0% for AGIs below $10k, 1.4% for AGIs $10k-25k, 2.6% for AGIs $25k-50k, 3.4% for AGIs $50k-75k, 3.7% for AGIs $75k-100k, 4.9% for AGIs over 100k)
Total tax: $6,575 (reported on 76.8% of returns)
39042:
$6,575
State:
$5,562
(% of AGI for various income ranges: 3.3% for AGIs below $10k, 3.6% for AGIs $10k-25k, 6.6% for AGIs $25k-50k, 8.5% for AGIs $50k-75k, 10.2% for AGIs $75k-100k, 16.5% for AGIs over 100k)
Earned income credit: $1,939 (reported on 16.8% of returns)
Here:
$1,939
State:
$2,107
Percentage of individuals using paid preparers for their 2004 taxes: 56.0%
Here:
56%
State:
65%
(% for various income ranges: 49.3% for AGIs below $10k, 56.9% for AGIs $10k-25k, 57.6% for AGIs $25k-50k, 57.3% for AGIs $50k-75k, 51.6% for AGIs $75k-100k, 64.7% for AGIs over 100k)
Likely homosexual households (counted as self-reported same-sex unmarried-partner households)
Lesbian couples: 0.4% of all households
Gay men: 0.0% of all households
Household received Food Stamps/SNAP in the past 12 months: 683 Household did not receive Food Stamps/SNAP in the past 12 months: 13,872
Women who had a birth in the past 12 months: 565 (273 now married, 289 unmarried) Women who did not have a birth in the past 12 months: 8,229 (4,748 now married, 3,463 unmarried)
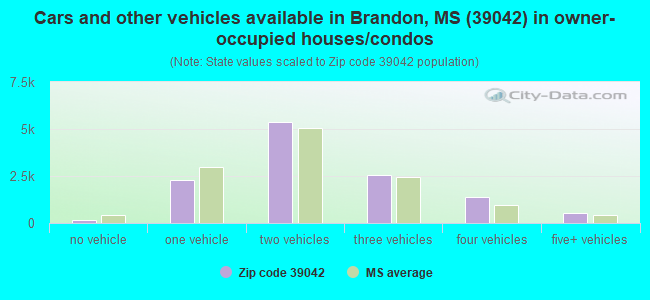
Housing units in zip code 39042 with a mortgage: 7,956 (712 second mortgage, 8 home equity loan, 616 both second mortgage and home equity loan) Houses without a mortgage: 190
Median monthly owner costs for units with a mortgage: $1,507 Median monthly owner costs for units without a mortgage: $471
Residents with income below the poverty level in 2022:
This zip code:
6.8%
Whole state:
19.1%
Residents with income below 50% of the poverty level in 2022:
This zip code:
3.3%
Whole state:
10.3%
Median number of rooms in houses and condos:
Here:
6.5
State:
6.3
Median number of rooms in apartments:
Here:
4.3
State:
4.8
Notable locations in this zip code not listed on our city pages
Notable locations in zip code 39042: Rice Switch (A), Brandon Depot (B), Robinhood Volunteer Fire Department Station 2 (C), Puckett Volunteer Fire Department (D), Robinhood Volunteer Fire Department Station 1 Headquarters (E), Rankin County Courthouse (F), Brandon Public Library (G), Rankin County Museum (H), Brandon Fire Department Station 1 Headquarters (I), Brandon Fire Department Station 2 (J), Brandon Fire Department Station 3 (K), Evergreen Fire Protection District (L). Display/hide their locations on the map
Shopping Centers: Crossgates Village Shopping Center (1), Harrell Shopping Center (2), Town West Shopping Center (3). Display/hide their locations on the map
Churches in zip code 39042 include: New Mount Zion Church (A), Pearlie Grove Church (B), Pilgrims Rest Church (C), Robinhood Church (D), Rock Hill Church (E), Andrew Chapel (F), Shiloh Church (G), Bethel Church (H), Sylvarena Church (I). Display/hide their locations on the map
Cemeteries: Williams Cemetery (1), Mays Cemetery (2), Pilgrim Rest Cemetery (3), Gulde Cemetery (4), Brandon Memory Gardens (5), Andrew Chapel Cemetery (6), Johns Cemetery (7). Display/hide their locations on the map
Streams, rivers, and creeks: Snake Creek (A), Brushy Creek (B), Walters Creek (C), Rocky Creek (D), College Branch (E). Display/hide their locations on the map
6,204 married couples with children.
1,310 single-parent households (112 men, 1,198 women).
97.0% of residents of 39042 zip code speak English at home.
2.1% of residents speak Spanish at home (80% very well, 12% well, 7% not well, 1% not at all).
0.6% of residents speak other Indo-European language at home (50% very well, 50% well).
0.1% of residents speak Asian or Pacific Island language at home (100% very well).
0.3% of residents speak other language at home (100% very well).
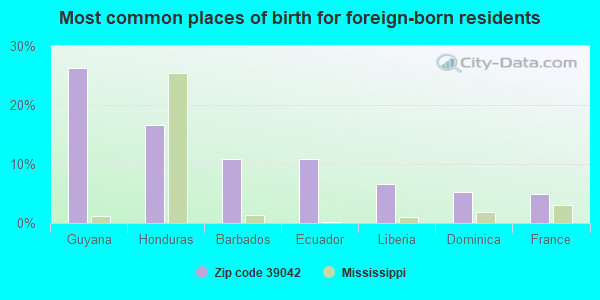
Foreign born population: 570 (1.5%) (49.5% of them are naturalized citizens)
This zip code:
1.5%
Whole state:
2.2%
26%Guyana
17%Honduras
11%Barbados
11%Ecuador
7%Liberia
5%Dominica
5%France
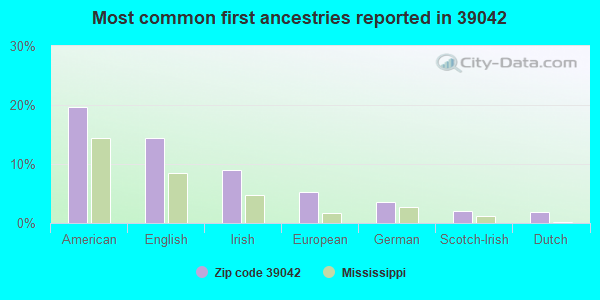
20%American
14%English
9%Irish
5%European
4%German
2%Scotch-Irish
2%Dutch
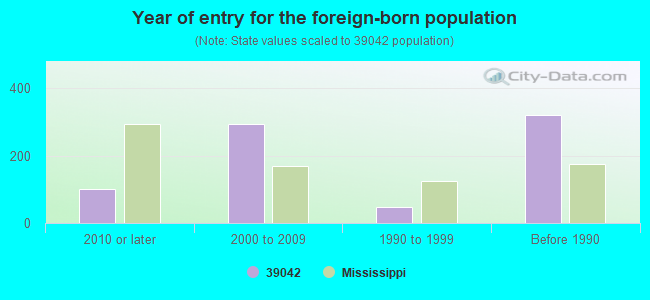
Year of entry for the foreign-born population
1022010 or later
2922000 to 2009
481990 to 1999
320Before 1990
Major facilities with environmental interests located in this zip code:
AMERICAN TIRE SERVICE CORPORATION (311 CROSSGATES BLVD in BRANDON, MS)
(Integrated Compliance Information System) - ICIS-04-1999-0043, FORMAL ENFORCEMENT ACTION STATE MASTER (Mississippi compliance, permits, activity tracking ) - ENSITE-MSD985977792, SQG Conditionally Exempt Small Quantity Generators, less than 100 kg/month of hazardous waste (Resource Conservation and Recovery Act (tracking hazardous waste)) - notification Business SIC classification: GENERAL AUTOMOTIVE REPAIR SHOPS Organizations: CHARLES PARKER (CONTACT/OWNER)
Alternative names: AMERICAN TIRE & SERVICE
BP OIL SITE NUMBER 24774 (691 GRANTS FERRY RD in BRANDON, MS)
STATE MASTER (Mississippi compliance, permits, activity tracking ) - ENSITE-MS0055352, National Pollutant Discharge Elimination System Permit, ENSITE-MSD985973155, CESQG National Pollutant Discharge Elimination System NON-MAJOR (Tracking pollutant discharge elimination systems) - permit Conditionally Exempt Small Quantity Generators, less than 100 kg/month of hazardous waste (Resource Conservation and Recovery Act (tracking hazardous waste)) - notification Business SIC classification: GASOLINE SERVICE STATIONS; CARWASHES Organizations: BP OIL COMPANY (CONTACT/OWNER)
Alternative names: B P SITE #24774, BP OIL COMPANY #24774, BP OIL COMPANY SITE NUMBER 24774, BP SITE #24774
GRAY DANIELS FORD (365 WEST GOVERNMENT STREET in BRANDON, MS)
STATE MASTER (Mississippi compliance, permits, activity tracking ) - ENSITE-MSD985968072, HAZARDOUS WASTE PROGRAM (Resource Conservation and Recovery Act (tracking hazardous waste)) Organizations: ROBERT GRAY (CONTACT/OWNER)
HILLARD SEPTIC TANK SERVICE (1050 GREENFIELD ROAD in BRANDON, MS)
AMERICAN METAL WORKS (816 N COLLEGE ST in BRANDON, MS)
STATE MASTER (Mississippi compliance, permits, activity tracking ) - ENSITE-MS0000145185, LQG (Resource Conservation and Recovery Act (tracking hazardous waste)) Organizations: LAWRENCE A COX (CONTACT/OWNER)
BRANDON BODY SHOP (762 WEST GOVERNMENT ST in BRANDON, MS)
STATE MASTER (Mississippi compliance, permits, activity tracking ) - ENSITE-MSR000001941, CESQG Conditionally Exempt Small Quantity Generators, less than 100 kg/month of hazardous waste (Resource Conservation and Recovery Act (tracking hazardous waste)) - notification Conditionally Exempt Small Quantity Generators, less than 100 kg/month of hazardous waste (Resource Conservation and Recovery Act (tracking hazardous waste)) - notification Organizations: JERRY PENINGER (CONTACT/OWNER)
, JOHN JORDON JR (CONTACT/OWNER)
Alternative names: PENINGER BODY SHOP
ACL REALTY CORP, PREMIER PLAZA (HIGHWAY 80 WEST in BRANDON, MS)
STATE MASTER (Mississippi compliance, permits, activity tracking ) - ENSITE-MSR101097, NPDES STORMWATER PERMIT National Pollutant Discharge Elimination System NON-MAJOR (Tracking pollutant discharge elimination systems) - permit Business SIC classification: GENERAL CONTRACTORS-NONRESIDENTIAL BUILDINGS, OTHER THAN INDUSTRIAL BUILDINGS AND WAREHOUSES Alternative names: ACL REALTY CORPORATION, RANKIN COUNTY
ENMARK ENERGY, INC, CO2 DEHYDRATION FACILITY (HIGHWAY 80/ANDREW CHAPEL in BRANDON, MS)
STATE MASTER (Mississippi compliance, permits, activity tracking ) - ENSITE-MSG130015, NPDES NON-MAJOR National Pollutant Discharge Elimination System NON-MAJOR (Tracking pollutant discharge elimination systems) - permit Business SIC classification: INDUSTRIAL GASES Alternative names: ENMARK ENERGY INC, RANKIN COUNTY
DORIS ROMERO TRAILER PARK (BURNHAM ROAD in BRANDON, MS)
STATE MASTER (Mississippi compliance, permits, activity tracking ) - ENSITE-MSU097111, WASTEWATER FACILITY National Pollutant Discharge Elimination System NON-MAJOR (Tracking pollutant discharge elimination systems) - permit Business SIC classification: OPERATORS OF RESIDENTIAL MOBILE HOME SITES
BILLY BROWN, POULTRY (GOVERNMENT STREET in BRANDON, MS)
STATE MASTER (Mississippi compliance, permits, activity tracking ) - ENSITE-MSU002193, WASTEWATER FACILITY National Pollutant Discharge Elimination System NON-MAJOR (Tracking pollutant discharge elimination systems) - permit Business SIC classification: BROILER, FRYER, AND ROASTER CHICKENS; POULTRY AND EGGS Alternative names: BROWN, BILLY POULTRY, BROWN POULTRY
DWYN BURNHAM, POULTRY (HIGHWAY 18 in BRANDON, MS)
STATE MASTER (Mississippi compliance, permits, activity tracking ) - ENSITE-MSU003632, WASTEWATER FACILITY National Pollutant Discharge Elimination System NON-MAJOR (Tracking pollutant discharge elimination systems) - permit Business SIC classification: BROILER, FRYER, AND ROASTER CHICKENS; POULTRY AND EGGS Alternative names: BURNHAM, DWYN POULTRY
ENMARK ENERGY INC, BARKSDALE ROAD PIPELINE (BARKSDALE ROAD in GOSHEN SPRINGS, MS)
STATE MASTER (Mississippi compliance, permits, activity tracking ) - ENSITE-MSG130096, NPDES NON-MAJOR National Pollutant Discharge Elimination System NON-MAJOR (Tracking pollutant discharge elimination systems) - permit Business SIC classification: NATURAL GAS TRANSMISSION AND DISTRIBUTION Alternative names: RANKIN
GLEN WALDENS RESTAURANT (1902 HIGHWAY 471 in BRANDON, MS)
STATE MASTER (Mississippi compliance, permits, activity tracking ) - ENSITE-MSU097136, WASTEWATER FACILITY National Pollutant Discharge Elimination System NON-MAJOR (Tracking pollutant discharge elimination systems) - permit Business SIC classification: EATING PLACES Alternative names: RANKIN
Housing units lacking complete plumbing facilities: 1.8% Housing units lacking complete kitchen facilities: 1.4%
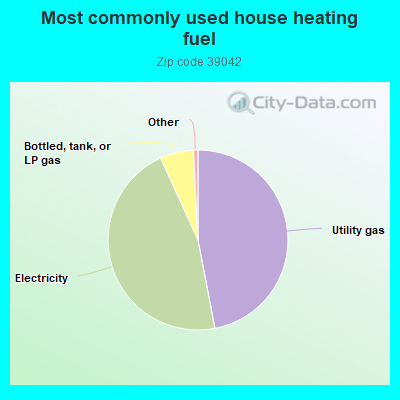
47.0%Utility gas
46.2%Electricity
6.0%Bottled, tank, or LP gas
Population in 1990: 41,141.
Place of birth for U.S.-born residents:
This state: 28,443
Northeast: 702
Midwest: 1,353
South: 6,076
West: 679
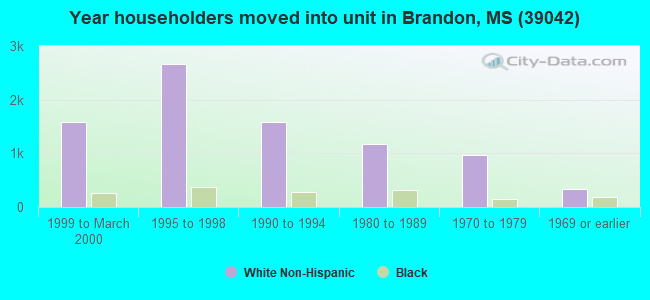
52% of the 39042 zip code residents lived in the same house 5 years ago. Out of people who lived in different houses, 41% lived in this county. Out of people who lived in different counties, 50% lived in Mississippi.
91% of the 39042 zip code residents lived in the same house 1 year ago. Out of people who lived in different houses, 44% moved from this county. Out of people who lived in different houses, 40% moved from different county within same state. Out of people who lived in different houses, 13% moved from different state. Out of people who lived in different houses, 0% moved from abroad.
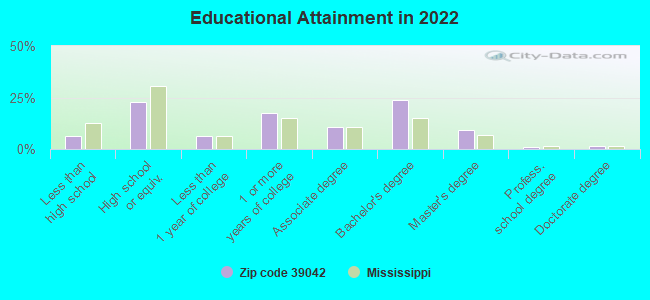
Private vs. public school enrollment:
Students in private schools in grades 1 to 8 (elementary and middle school): 498
Here:
11.9%
Mississippi:
16.1%
Students in private schools in grades 9 to 12 (high school): 269
Here:
14.0%
Mississippi:
14.6%
Students in private undergraduate colleges: 291
Here:
18.1%
Mississippi:
12.8%
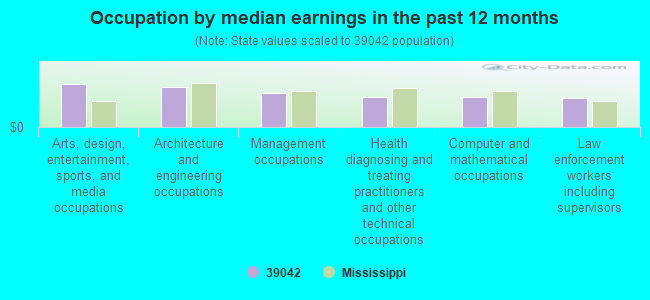
Occupation by median earnings in the past 12 months ($)
103,814Arts, design, entertainment, sports, and media occupations
96,428Architecture and engineering occupations
83,586Management occupations
73,246Health diagnosing and treating practitioners and other technical occupations
72,629Computer and mathematical occupations
70,701Law enforcement workers including supervisors
Companies with biggest federal contracts located in this zip code (BRANDON, MS):
PROCON, INC (3155 LOUIS WILSON DR; small business) : $15,436,953 in 85 contractsfrom 1999 to 2006
Contracts for Construction of Structures and Facilities -- Other Non-Building Facilities, Maintenance, Repair or Alteration of Real Property -- Other Conservation and Development Facilities, Mineral Construction Materials, Bulk, Other Natural Resources and Conservation Services by U.S. Army Corps of Engineers - civil program financing only, Army, Soil Conservation Service (disused code), Natural Resources Conservation Service, and others Signed by year:2000: $363,000; 2001: $1,803,180; 2002: $1,248,872; 2003: $4,237,624; 2004: $2,651,658; 2005: $3,857,638; 2006: $891,522.
Biggest contracts:
$818,707 with U.S. Army Corps of Engineers - civil program financing only for Construction of Structures and Facilities -- Other Non-Building Facilities. Signed on 2001-02-13. Completion date: 2001-02-14.
$758,522 with Army for Construction of Structures and Facilities -- Other Non-Building Facilities. Signed on 2006-04-20. Completion date: 2007-04-25.
$755,725 with U.S. Army Corps of Engineers - civil program financing only for Construction of Structures and Facilities -- Other Non-Building Facilities. Signed on 2001-04-23. Completion date: 2001-09-28.
$580,000, same as above.Signed on 2003-03-11. Completion date: 2003-06-02.
ENTERPRISE RENT A CAR COMPANY (5446) (39042) 5 employees, $300000 revenue. : $1,820,824 in 45 contractsfrom 2002 to 2006
Contracts for Lease or Rental of Equipment -- Ground Effect Vehicles, Motor Vehicles, Trailers, and Cycles, Passenger Motor Charter Service, Passenger Motor Vehicles, Lease or Rental of Equipment -- Vehicular Equipment Components by Army, Public Buildings Service, Air Force, Federal Emergency Management Agency, and others Signed by year:2000: $0; 2001: $0; 2002: $645; 2003: $43,993; 2004: $40,276; 2005: $560,768; 2006: $1,175,142.
Biggest contracts:
$500,000 with Army for Lease or Rental of Equipment -- Ground Effect Vehicles, Motor Vehicles, Trailers, and Cycles. Signed on 2006-03-16. Completion date: 2006-04-01.
$440,000, same as above.Signed on 2006-01-20. Completion date: 2006-04-01.
$179,712 with Public Buildings Service for Lease or Rental of Equipment -- Ground Effect Vehicles, Motor Vehicles, Trailers, and Cycles. Signed on 2005-11-11. Completion date: 2006-11-10.
$96,000 with Army for Lease or Rental of Equipment -- Ground Effect Vehicles, Motor Vehicles, Trailers, and Cycles. Signed on 2006-01-31. Completion date: 2006-04-01.
BRYAN CONSTRUCTION CO (168 LAKEBEND CIR; small business) : $381,628 in 10 contractsfrom 2001 to 2006
Contracts for Maintenance, Repair or Alteration of Real Property -- Highways, Roads, Streets, Bridges, and Railways (includes resurfacing), Prefabricated and Portable Buildings, Miscellaneous Prefabricated Structures, Construction of Structures and Facilities -- Other Non-Building Facilities, and moreby National Park Service, NASA, Department of Defense, U.S. Army Corps of Engineers - civil program financing only, and others Signed by year:2000: $0; 2001: $170,988; 2002: $0; 2003: $93,340; 2004: $0; 2005: $73,300; 2006: $44,000.
Biggest contracts:
$111,000 with National Park Service for Maintenance, Repair or Alteration of Real Property -- Highways, Roads, Streets, Bridges, and Railways (includes resurfacing). Taking place in NV. Signed on 2001-06-15. Completion date: 2001-12-15.
$44,800 with NASA for Prefabricated and Portable Buildings. Signed on 2005-04-04. Completion date: 2005-06-22.
$35,600 with Department of Defense for Miscellaneous Prefabricated Structures. Taking place in MO. Signed on 2003-08-04. Completion date: 2003-11-04.
$33,200 with U.S. Army Corps of Engineers - civil program financing only for Construction of Structures and Facilities -- Other Non-Building Facilities. Taking place in LA. Signed on 2001-02-21. Completion date: 2001-03-30.
ASBURY MS WIMBER LLC (201 OCTAVIA DR) : $175,275 in 6 contractsfrom 2001 to 2005
Contracts for Trucks and Truck Tractors, Wheeled, Modification of Equipment -- Vehicular Equipment Components by Federal Supply Service, Army Signed by year:2000: $0; 2001: $49,000; 2002: $98,105; 2003: $0; 2004: $0; 2005: $28,170; 2006: $0.
Biggest contracts:
$49,000 with Federal Supply Service for Trucks and Truck Tractors, Wheeled. Signed on 2001-09-15. Completion date: 2001-10-15.
$29,290, same as above.Signed on 2002-11-15. Completion date: 2002-11-15.
$28,170 with Army for Modification of Equipment -- Vehicular Equipment Components. Signed on 2005-04-13. Completion date: 2005-04-29.
$23,133 with Federal Supply Service for Trucks and Truck Tractors, Wheeled. Signed on 2002-11-15. Completion date: 2002-11-15.
LANE TEDDER & ASSOCIATES INC (5578 HIGHWAY 18; small business) : $65,149 in 8 contractsfrom 2002 to 2006
Contracts for Installation of Equipment -- Communication, Detection, and Coherent Radiation Equipment, Maintenance, Repair or Alteration of Real Property -- Office Buildings, Miscellaneous Communication Equipment, Electric Services, and moreby Army, Public Buildings Service Signed by year:2000: $0; 2001: $0; 2002: $14,543; 2003: $0; 2004: $19,273; 2005: $18,223; 2006: $13,110.
Biggest contracts:
$18,223 with Army for Installation of Equipment -- Communication, Detection, and Coherent Radiation Equipment. Signed on 2005-08-24. Completion date: 2005-08-31.
$11,673 with Public Buildings Service for Maintenance, Repair or Alteration of Real Property -- Office Buildings. Signed on 2004-08-03. Completion date: 2004-08-31.
$10,140 with Army for Miscellaneous Communication Equipment. Signed on 2002-01-17. Completion date: 2002-03-01.
$8,110 with Army for Electric Services. Signed on 2006-05-03. Completion date: 2006-05-16.
M & R PROTECTIVE SYSTEMS INC (1414 WADE PATRICK RD; small business) : $63,694 in 8 contractsfrom 2003 to 2005
Contracts for ADPE System Configuration, Badges and Insignia, Miscellaneous Alarm, Signal and Security Detection Systems, Communications Security Equipment and Components, and moreby U.S. Army Corps of Engineers - civil program financing only, Army Signed by year:2000: $0; 2001: $0; 2002: $0; 2003: $11,772; 2004: $34,950; 2005: $16,972; 2006: $0.
Biggest contracts:
$17,475 with U.S. Army Corps of Engineers - civil program financing only for ADPE System Configuration. Signed on 2004-09-27. Completion date: 2004-10-25.
$17,475 with Army for ADPE System Configuration. Signed on 2004-09-27. Completion date: 2004-10-25.
$7,125 with U.S. Army Corps of Engineers - civil program financing only for Badges and Insignia. Signed on 2003-09-30. Completion date: 2003-10-22.
$4,656 with Army for Miscellaneous Alarm, Signal and Security Detection Systems. Signed on 2005-07-08. Completion date: 2005-07-27.
HONEA PATRICIA L (631 SPENCER DRIVE; small business) : $23,442 in 5 contractsfrom 2004 to 2005
Contracts for Technical Assistance by Army Signed by year:2000: $0; 2001: $0; 2002: $0; 2003: $0; 2004: $20,922; 2005: $2,520; 2006: $0.
Biggest contracts:
$9,510 with Army for Technical Assistance. Signed on 2004-12-30. Completion date: 2004-09-30.
$8,242, same as above.Signed on 2004-06-16. Completion date: 2004-09-30.
$3,677, same as above.Signed on 2005-06-02. Completion date: 2004-09-30.
$3,170, same as above.Signed on 2004-09-11. Completion date: 2004-09-30.
MICROTEL INNS & SUITES (1130 OAK ST; small business) : $22,642 in 8 contractsfrom 2003 to 2004
Contracts for Lodging - Hotel/Motel, Lease or Rental of Facilities -- Troop Housing Facilities, Lease or Rental of Facilities -- Other Residential Buildings by Army Signed by year:2000: $0; 2001: $0; 2002: $0; 2003: $24,272; 2004: -$1,630; 2005: $0; 2006: $0.
Biggest contracts:
$10,984 with Army for Lodging - Hotel/Motel. Signed on 2003-01-09. Completion date: 2003-01-25.
$4,939 with Army for Lease or Rental of Facilities -- Troop Housing Facilities. Signed on 2003-10-30. Completion date: 2004-02-11.
$3,866 with Army for Lodging - Hotel/Motel. Signed on 2003-08-21. Completion date: 2003-08-27.
$3,506 with Army for Lease or Rental of Facilities -- Other Residential Buildings. Signed on 2003-02-10. Completion date: 2003-03-11.
PITTMAN ENTERPRISES INC (1382 HWY 80 W; small business) : $12,070 in 3 contractsin 2003
$9,462 with Army for Food Services. Signed on 2003-01-10. Completion date: 2003-01-25.
$4,185 with Army for Condiments and Related Products. Signed on 2003-08-21. Completion date: 2003-08-27.
-$1,577 with Army for Food Services. Signed on 2003-01-30. Completion date: 2003-01-25.
TRUE SERVICE ELECTRONICS, LLC (80 WOODBRIDGE COVE; small business)
$9,883 with Army for Radio and Television Communication Equipment, Except Airborne. Signed on 2005-08-18. Completion date: 2005-10-02.
Top industries in this zip code by the number of employees in 2005:
2003 - 2018 National Fire Incident Reporting System (NFIRS) incidents
Based on the data from the years 2003 - 2018 the average number of fire incidents per year is 181. The highest number of fires - 285 took place in 2011, and the least - 76 in 2003. The data has a rising trend.
When looking into fire subcategories, the most reports belonged to: Outside Fires (53.0%), and Structure Fires (28.9%).
Fire incident types reported to NFIRS in Zip Code 39042


 Nearest zip codes: 39145, 39167, 39044, 39193, 39208, 39062.


 Based on the data from the years 2003 - 2018 the average number of fire incidents per year is 181. The highest number of fires - 285 took place in 2011, and the least - 76 in 2003. The data has a rising trend.
 When looking into fire subcategories, the most reports belonged to: Outside Fires (53.0%), and Structure Fires (28.9%).