Estimated zip code population in 2022: 1,210 Zip code population in 2010: 1,314 Zip code population in 2000: 1,285
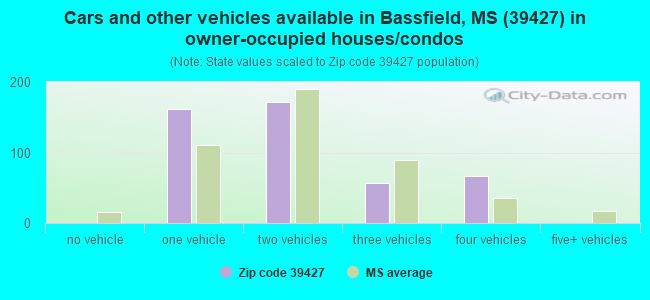
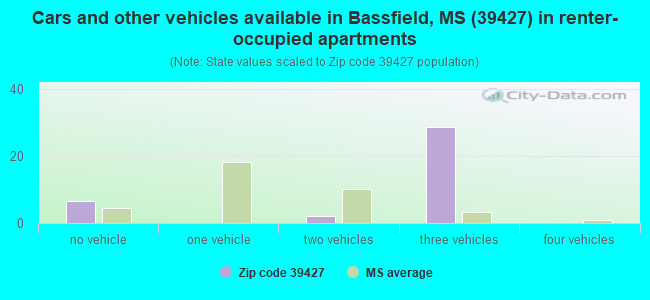
Houses and condos: 605 Renter-occupied apartments: 33
% of renters here:
7%
State:
30%
March 2022 cost of living index in zip code 39427: 76.8 (low, U.S. average is 100)
Land area: 58.4 sq. mi. Water area: 0.2 sq. mi.
Population density: 21 people per square mile
(very low).
OSM Map
General Map
Google Map
MSN Map
OSM Map
General Map
Google Map
MSN Map
OSM Map
General Map
Google Map
MSN Map
OSM Map
General Map
Google Map
MSN Map
Please wait while loading the map...
Real estate property taxes paid for housing units in 2022:
This zip code:
1.0% ($954)
Mississippi:
0.7% ($1,161)
Median real estate property taxes paid for housing units with mortgages in 2022: $1,701 (1.6%) Median real estate property taxes paid for housing units with no mortgage in 2022: $570 (0.6%)
Business Search- 14 Million verified businesses
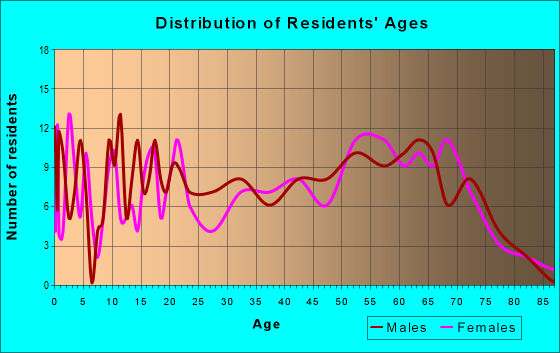
Males: 597
(49.4%)
Females: 612
(50.6%)
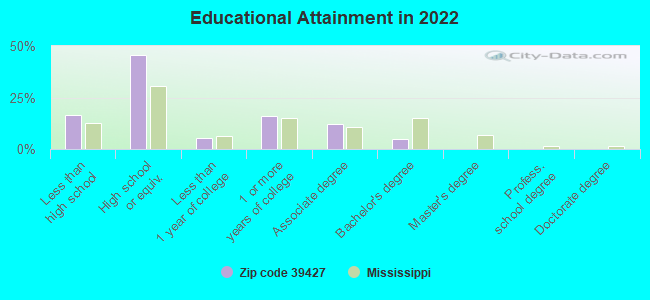
For population 25 years and over in 39427:
High school or higher: 82.5%
Bachelor's degree or higher: 4.9%
Graduate or professional degree: 0.0%
Unemployed: 3.9%
Mean travel time to work (commute): 31.7 minutes
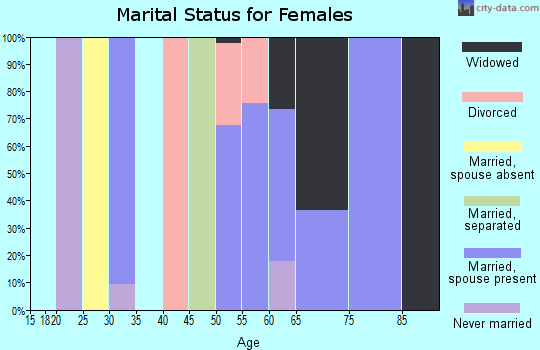
For population 15 years and over in 39427:
Never married: 20.1%
Now married: 53.1%
Separated: 3.7%
Widowed: 9.7%
Divorced: 13.4%
Zip code 39427 compared to state average:
Median house value below state average.
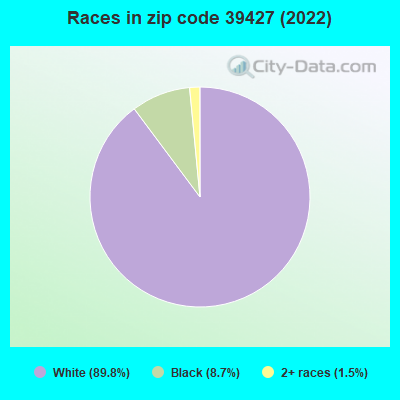
Black race population percentage significantly below state average.
Hispanic race population percentage significantly below state average.
Foreign-born population percentage significantly below state average.
Renting percentage significantly below state average.
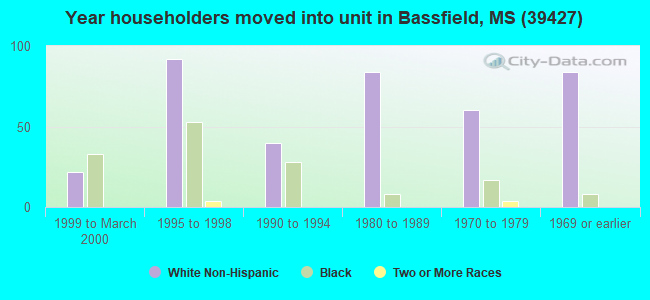
Length of stay since moving in significantly above state average.
Number of college students significantly below state average.
Percentage of population with a bachelor's degree or higher significantly below state average.
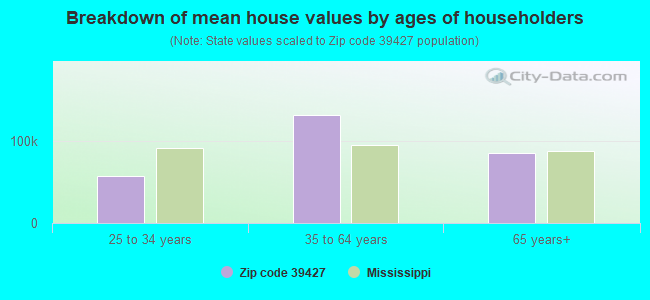
Estimated median house/condo value in 2022: $97,392
39427:
$97,392
Mississippi:
$162,500
According to our research of Mississippi and other state lists, there were 2 registered sex offenders living in 39427 zip code as of April 26, 2024. The ratio of all residents to sex offenders in zip code 39427 is 797 to 1. The ratio of registered sex offenders to all residents in this zip code is lower than the state average.
Median resident age:
This zip code:
41.0 years
Mississippi median age:
38.9 years
Average household size:
This zip code:
2.5 people
Mississippi:
2.5 people
Averages for the 2020 tax year for zip code 39427, filed in 2021:
Average Adjusted Gross Income (AGI) in 2020: $39,447 (Individual Income Tax Returns)
Here:
$39,447
State:
$54,084
Salary/wage: $36,628 (reported on 79.6% of returns)
Here:
$36,628
State:
$45,187
(% of AGI for various income ranges: 1299.3% for AGIs below $25k, 3827.3% for AGIs $25k-50k, 6642.5% for AGIs $50k-75k, 9795.0% for AGIs $75k-100k, 17550.0% for AGIs $100k-200k)
Taxable interest for individuals: $250 (reported on 12.2% of returns)
This zip code:
$250
Mississippi:
$1,434
(% of AGI for various income ranges: 4.7% for AGIs below $25k, 40.0% for AGIs $75k-100k)
Profit/loss from business: +$2,533 (reported on 18.4% of returns)
Here:
+$2,533
State:
+$7,724
(% of AGI for various income ranges: 110.0% for AGIs below $25k, 57.3% for AGIs $25k-50k)
Taxable individual retirement arrangement distribution: $15,967 (reported on 6.1% of returns)
39427:
$15,967
Mississippi:
$17,717
(% of AGI for various income ranges: 319.3% for AGIs below $25k)
Earned income credit: $2,460 (reported on 30.6% of returns)
Here:
$2,460
State:
$2,689
(% of AGI for various income ranges: 174.0% for AGIs below $25k, 98.2% for AGIs $25k-50k)
Percentage of individuals using paid preparers for their 2020 taxes: 95.9%
Here:
96%
State:
94%
(% for various income ranges: 95.2% for AGIs below $25k, 100.0% for AGIs $25k-50k, 100.0% for AGIs $50k-75k, 100.0% for AGIs $75k-100k, 75.0% for AGIs $100k-200k)
Averages for the 2012 tax year for zip code 39427, filed in 2013:
Average Adjusted Gross Income (AGI) in 2012: $33,802 (Individual Income Tax Returns)
Here:
$33,802
State:
$46,197
Salary/wage: $33,811 (reported on 76.6% of returns)
Here:
$33,811
State:
$38,549
(% of AGI for various income ranges: 75.8% for AGIs below $25k, 80.3% for AGIs $25k-50k, 77.0% for AGIs $50k-75k, 167.6% for AGIs $75k-100k)
Taxable interest for individuals: $311 (reported on 19.1% of returns)
This zip code:
$311
Mississippi:
$1,482
Ordinary dividends: $733 (reported on 6.4% of returns)
Here:
$733
State:
$5,401
Profit/loss from business: +$6,167 (reported on 19.1% of returns)
Here:
+$6,167
State:
+$10,220
Taxable individual retirement arrangement distribution: $9,850 (reported on 4.3% of returns)
39427:
$9,850
Mississippi:
$13,665
Total itemized deductions: $20,825 (31% of AGI, reported on 17.0% of returns)
Here:
$20,825
State:
$22,078
Here:
30.9% of AGI
State:
21.8% of AGI
Charity contributions: $6,260 (reported on 10.6% of returns)
Here:
$6,260
State:
$6,081
Taxes paid: $3,362 (reported on 17.0% of returns)
39427:
$3,362
State:
$5,794
Earned income credit: $2,618 (reported on 36.2% of returns)
Here:
$2,618
State:
$2,710
(% of AGI for various income ranges: 11.3% for AGIs below $25k, 2.1% for AGIs $25k-50k)
Percentage of individuals using paid preparers for their 2012 taxes: 70.2%
Here:
70%
State:
60%
(% for various income ranges: 72.0% for AGIs below $25k, 63.6% for AGIs $25k-50k, 66.7% for AGIs $50k-75k, 66.7% for AGIs $75k-100k, 100.0% for AGIs $100k-200k)
Averages for the 2004 tax year for zip code 39427, filed in 2005:
Average Adjusted Gross Income (AGI) in 2004: $27,802 (Individual Income Tax Returns)
Here:
$27,802
State:
$36,110
Salary/wage: $27,342 (reported on 82.5% of returns)
Here:
$27,342
State:
$31,757
(% of AGI for various income ranges: 109.6% for AGIs below $10k, 78.4% for AGIs $10k-25k, 87.2% for AGIs $25k-50k, 74.5% for AGIs $50k-75k, 88.5% for AGIs $75k-100k, 66.6% for AGIs over 100k)
Taxable interest for individuals: $731 (reported on 22.7% of returns)
This zip code:
$731
Mississippi:
$1,649
(% of AGI for various income ranges: 2.8% for AGIs below $10k, 0.5% for AGIs $10k-25k, 0.3% for AGIs $25k-50k, 0.5% for AGIs $50k-75k, 1.4% for AGIs $75k-100k)
Taxable dividends: $297 (reported on 7.0% of returns)
Here:
$297
State:
$3,089
(% of AGI for various income ranges: 0.7% for AGIs below $10k, 0.0% for AGIs $10k-25k, 0.2% for AGIs $50k-75k)
Net capital gain/loss: +$2,088 (reported on 6.5% of returns)
Here:
+$2,088
State:
+$8,427
Profit/loss from business: +$5,176 (reported on 16.2% of returns)
Here:
+$5,176
State:
+$8,818
(% of AGI for various income ranges: 15.9% for AGIs below $10k, 9.2% for AGIs $10k-25k, 1.5% for AGIs $25k-50k, 0.6% for AGIs $50k-75k)
Total itemized deductions: $15,123 (24% of AGI, reported on 12.4% of returns)
Here:
$15,123
State:
$17,896
Here:
23.9% of AGI
State:
22.5% of AGI
(% of AGI for various income ranges: 7.3% for AGIs $25k-50k, 8.7% for AGIs $50k-75k, 9.6% for AGIs $75k-100k, 12.5% for AGIs over 100k)
Charity contributions deductions: $3,745 (6% of AGI, reported on 9.7% of returns)
Here:
$3,745
State:
$4,735
Here:
5.6% of AGI
State:
5.7% of AGI
Total tax: $3,078 (reported on 65.7% of returns)
39427:
$3,078
State:
$5,562
(% of AGI for various income ranges: 3.7% for AGIs below $10k, 3.7% for AGIs $10k-25k, 5.8% for AGIs $25k-50k, 8.2% for AGIs $50k-75k, 10.5% for AGIs $75k-100k, 13.5% for AGIs over 100k)
Earned income credit: $1,941 (reported on 35.2% of returns)
Here:
$1,941
State:
$2,107
Percentage of individuals using paid preparers for their 2004 taxes: 75.0%
Here:
75%
State:
65%
(% for various income ranges: 66.9% for AGIs below $10k, 78.7% for AGIs $10k-25k, 73.9% for AGIs $25k-50k, 79.4% for AGIs $50k-75k, 81.0% for AGIs $75k-100k, 91.7% for AGIs over 100k)
Household received Food Stamps/SNAP in the past 12 months: 118 Household did not receive Food Stamps/SNAP in the past 12 months: 372
Women who had a birth in the past 12 months: 29 (30 now married, 0 unmarried) Women who did not have a birth in the past 12 months: 198 (80 now married, 117 unmarried)
Housing units in zip code 39427 with a mortgage: 138 (6 second mortgage, 6 both second mortgage and home equity loan) Median monthly owner costs for units with a mortgage: $855 Median monthly owner costs for units without a mortgage: $404
Residents with income below the poverty level in 2022:
This zip code:
22.3%
Whole state:
19.1%
Residents with income below 50% of the poverty level in 2022:
This zip code:
15.8%
Whole state:
10.3%
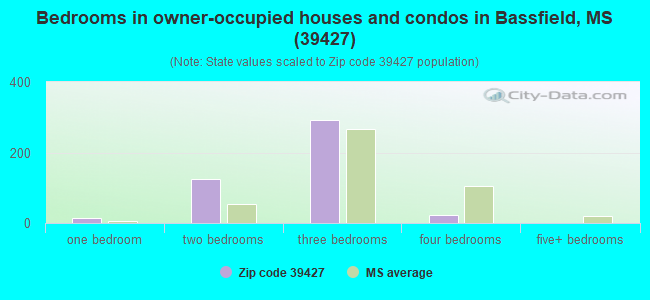
Median number of rooms in houses and condos:
Here:
5.7
State:
6.3
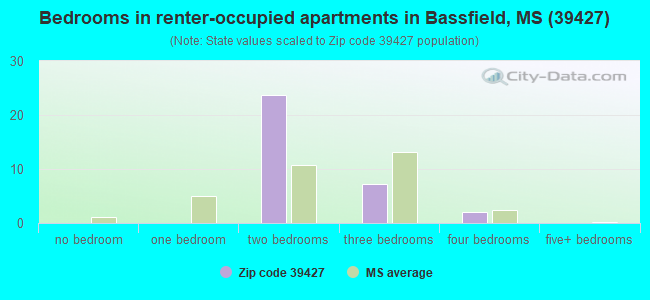
Median number of rooms in apartments:
Here:
5.3
State:
4.8
Notable locations in this zip code not listed on our city pages
Churches in zip code 39427 include: Crossroads Church (A), Friendship Church (B), Greens Creek Baptist Church (C), Society Hill Baptist Church (D), Jordan Hill Church (E). Display/hide their locations on the map
Cemeteries: Taylor Cemetery (1), Society Hill Cemetery (2), Hathorn Cemetery (3), Jordan Hill Cemetery (4), Clear Springs Cemetery (5), Ward Cemetery (6), Robbins Cemetery (7). Display/hide their locations on the map
Facilities with environmental interests located in this zip code:
JEFFERSON DAVIS COUNTY SCHOOLS, JEFFERSON DAVIS VO TECH CENTER (HWY 42 EAST in CARSON, MS)
STATE MASTER (Mississippi compliance, permits, activity tracking ) - ENSITE-MS0035009, National Pollutant Discharge Elimination System Permit National Pollutant Discharge Elimination System NON-MAJOR (Tracking pollutant discharge elimination systems) - permit Business SIC classification: VOCATIONAL SCHOOLS Alternative names: JEFF DAVIS CO VOC TECH CENTER, JEFFERSON DAVIS VO-TECH CENTER, JEFFERSON DAVIS VOCATIONAL TECHNICAL CENTER
JEFF DAVIS COUNTY (RT 1 BOX 99A1 in CARSON, MS)
National Pollutant Discharge Elimination System NON-MAJOR (Tracking pollutant discharge elimination systems) - permit Business SIC classification: BROILER, FRYER, AND ROASTER CHICKENS Alternative names: MCNEASE POULTRY, SPEEDY SMITH FARMS
JEFFERSON DAVIS COUNTY (EAST FORK GREENS CREEK in CARSON, MS)
National Pollutant Discharge Elimination System NON-MAJOR (Tracking pollutant discharge elimination systems) - permit Business SIC classification: POULTRY AND EGGS Alternative names: BILLY JOEY BASS POULTRY
Housing units lacking complete plumbing facilities: 4.8%
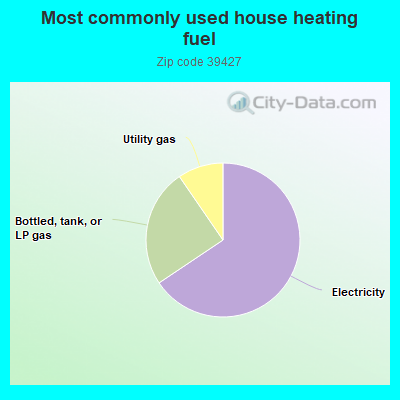
65.8%Electricity
24.9%Bottled, tank, or LP gas
9.6%Utility gas
Population in 1990: 1,381.
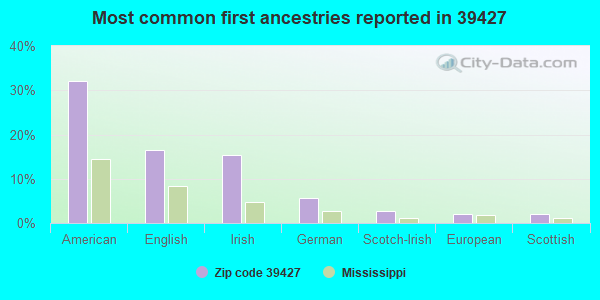
Place of birth for U.S.-born residents:
This state: 994
Northeast: 40
Midwest: 49
South: 121
61% of the 39427 zip code residents lived in the same house 5 years ago. Out of people who lived in different houses, 55% lived in this county. Out of people who lived in different counties, 50% lived in Mississippi.
93% of the 39427 zip code residents lived in the same house 1 year ago. Out of people who lived in different houses, 93% moved from this county.
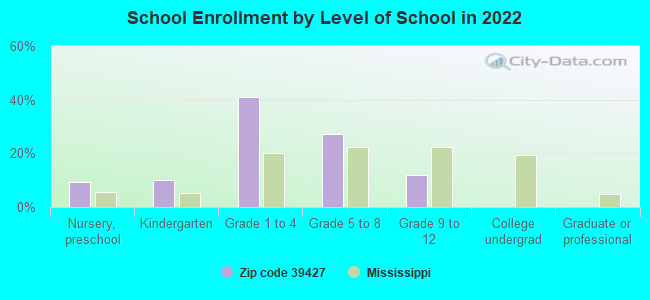
Private vs. public school enrollment:
Students in private schools in grades 1 to 8 (elementary and middle school): 103
Here:
68.8%
Mississippi:
16.1%
Students in private schools in grades 9 to 12 (high school):
Here:
0.0%
Mississippi:
14.6%
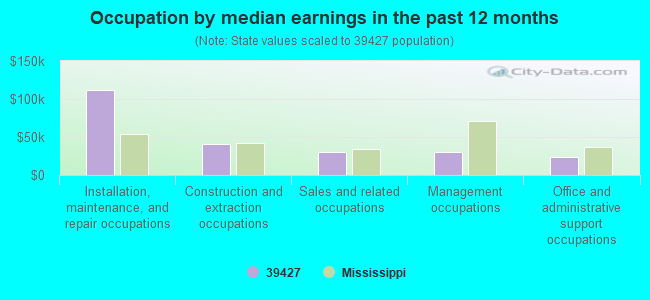
Occupation by median earnings in the past 12 months ($)
111,908Installation, maintenance, and repair occupations
40,566Construction and extraction occupations
30,716Sales and related occupations
30,156Management occupations
23,165Office and administrative support occupations
Companies with federal contracts located in this zip code:
DEVEL. DRLL, MONITOR, INC. (HWY 13 S in CARSON, MS; small business) : $326,401 in 46 contractsfrom 2002 to 2006
Contracts for Lease or Rental of Facilities -- Office Buildings by Public Buildings Service Signed by year:2000: $0; 2001: $0; 2002: $20,488; 2003: $121,625; 2004: $21,264; 2005: $92,144; 2006: $70,880.
Biggest contracts:
$21,161 with Public Buildings Service for Lease or Rental of Facilities -- Office Buildings. Signed on 2003-06-15. Completion date: 2003-06-15.
$20,487, same as above.Signed on 2002-12-15. Completion date: 2002-12-15.
$14,185, same as above.Signed on 2003-06-15. Completion date: 2003-06-15.
$7,088, same as above.Signed on 2006-04-01. Completion date: 2006-09-30.
Top industries in this zip code by the number of employees in 2005:
Construction: New Single-Family Housing Construction (except Operative Builders) (10-19 employees: 1 establishment)
Other Services (except Public Administration): Religious Organizations (1-4: 2)
Utilities: Water Supply and Irrigation Systems (1-4: 1)
Professional, Scientific, and Technical Services: All Other Professional, Scientific, and Technical Services (1-4: 1)
Construction: Masonry Contractors (1-4: 1)
Administrative and Support and Waste Management and Remediation Services: Landscaping Services (1-4: 1)
Fatal accident statistics in 2013:
Fatal accident count: 1
Vehicles involved in fatal accidents: 1
Fatal accidents caused by drunken drivers: 0
Fatalities: 1
Persons involved in fatal accidents: 1
Pedestrians involved in fatal accidents: 0
Fatal accident statistics in 2010:
Fatal accident count: 1
Vehicles involved in fatal accidents: 2
Fatal accidents caused by drunken drivers: 0
Fatalities: 1
Persons involved in fatal accidents: 2
Pedestrians involved in fatal accidents: 0
2003 - 2018 National Fire Incident Reporting System (NFIRS) incidents
Based on the data from the years 2003 - 2018 the average number of fires per year is 12. The highest number of fire incidents - 31 took place in 2017, and the least - 1 in 2003. The data has a growing trend.
When looking into fire subcategories, the most incidents belonged to: Outside Fires (51.8%), and Structure Fires (35.8%).
Fire incident types reported to NFIRS in Zip Code 39427
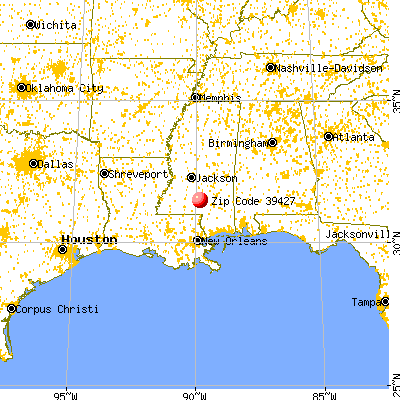


 Nearest zip codes: 39421, 39656, 39474, 39429, 39663, 39482.
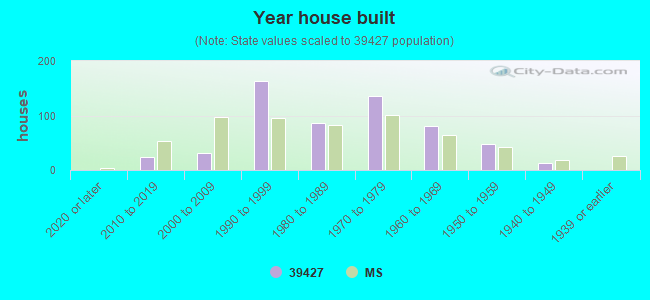


 (Location: HWY 42, Grades: 9-12)
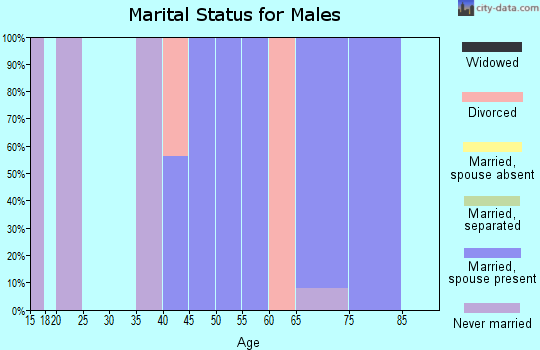
 Based on the data from the years 2003 - 2018 the average number of fires per year is 12. The highest number of fire incidents - 31 took place in 2017, and the least - 1 in 2003. The data has a growing trend.
 When looking into fire subcategories, the most incidents belonged to: Outside Fires (51.8%), and Structure Fires (35.8%).