Estimated zip code population in 2022: 2,008 Zip code population in 2010: 2,256 Zip code population in 2000: 2,034
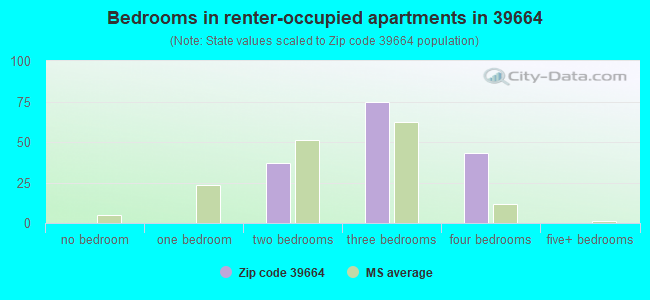
Houses and condos: 901 Renter-occupied apartments: 154
% of renters here:
18%
State:
30%
March 2022 cost of living index in zip code 39664: 78.2 (low, U.S. average is 100)
Land area: 116.5 sq. mi. Water area: 0.2 sq. mi.
Population density: 17 people per square mile
(very low).
OSM Map
General Map
Google Map
MSN Map
OSM Map
General Map
Google Map
MSN Map
OSM Map
General Map
Google Map
MSN Map
OSM Map
General Map
Google Map
MSN Map
Please wait while loading the map...
Real estate property taxes paid for housing units in 2022:
This zip code:
1.0% ($1,109)
Mississippi:
0.7% ($1,161)
Median real estate property taxes paid for housing units with mortgages in 2022: $1,289 (1.2%) Median real estate property taxes paid for housing units with no mortgage in 2022: $937 (0.8%)
Business Search- 14 Million verified businesses
Males: 864
(43.0%)
Females: 1,144
(57.0%)
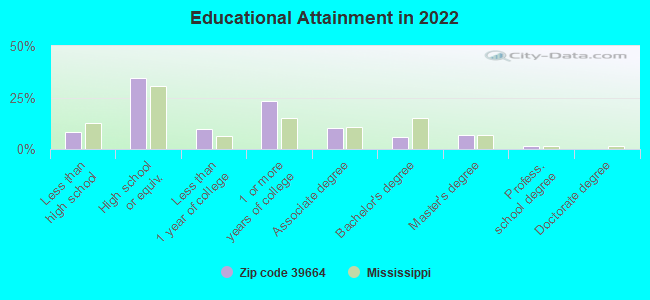
For population 25 years and over in 39664:
High school or higher: 91.7%
Bachelor's degree or higher: 13.9%
Graduate or professional degree: 8.2%
Unemployed: 1.6%
Mean travel time to work (commute): 58.0 minutes
For population 15 years and over in 39664:
Never married: 10.8%
Now married: 61.3%
Separated: 1.0%
Widowed: 15.1%
Divorced: 11.7%
Zip code 39664 compared to state average:
Unemployed percentage significantly below state average.
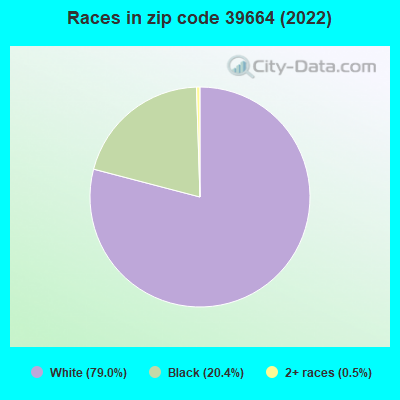
Black race population percentage below state average.
Hispanic race population percentage significantly below state average.
Median age above state average.
Foreign-born population percentage significantly below state average.
Renting percentage below state average.
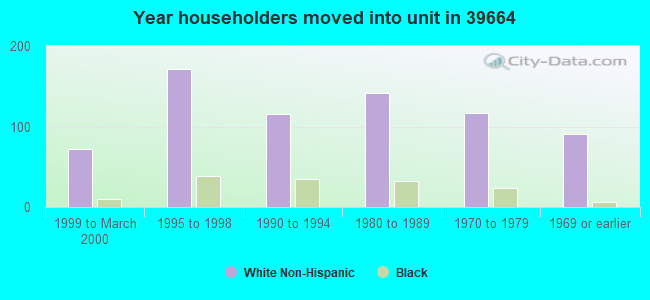
Length of stay since moving in significantly above state average.
Percentage of population with a bachelor's degree or higher below state average.
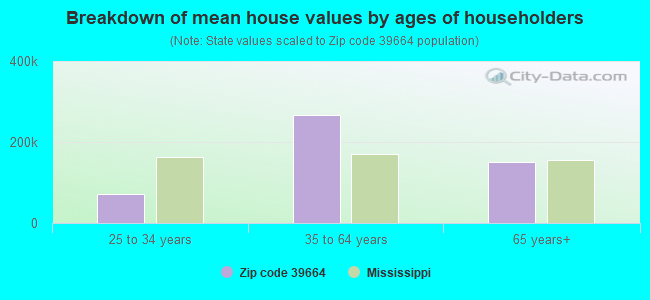
Estimated median house/condo value in 2022: $109,015
39664:
$109,015
Mississippi:
$162,500
According to our research of Mississippi and other state lists, there were 2 registered sex offenders living in 39664 zip code as of April 27, 2024. The ratio of all residents to sex offenders in zip code 39664 is 1,062 to 1. The ratio of registered sex offenders to all residents in this zip code is much lower than the state average.
Median resident age:
This zip code:
46.5 years
Mississippi median age:
38.9 years
Average household size:
This zip code:
2.4 people
Mississippi:
2.5 people
Averages for the 2020 tax year for zip code 39664, filed in 2021:
Average Adjusted Gross Income (AGI) in 2020: $54,355 (Individual Income Tax Returns)
Here:
$54,355
State:
$54,084
Salary/wage: $51,165 (reported on 76.5% of returns)
Here:
$51,165
State:
$45,187
(% of AGI for various income ranges: 1096.7% for AGIs below $25k, 3708.2% for AGIs $25k-50k, 6730.0% for AGIs $50k-75k, 8332.5% for AGIs $75k-100k, 18000.0% for AGIs $100k-200k)
Taxable interest for individuals: $538 (reported on 24.7% of returns)
This zip code:
$538
Mississippi:
$1,434
(% of AGI for various income ranges: 7.1% for AGIs below $25k, 7.1% for AGIs $25k-50k, 37.5% for AGIs $50k-75k, 37.5% for AGIs $75k-100k, 37.1% for AGIs $100k-200k)
Ordinary dividends: $2,133 (reported on 10.6% of returns)
Here:
$2,133
State:
$6,661
(% of AGI for various income ranges: 24.7% for AGIs $25k-50k, 51.2% for AGIs $50k-75k, 155.7% for AGIs $100k-200k)
Net capital gain/loss in AGI: +$4,156 (reported on 10.6% of returns)
Here:
+$4,156
State:
+$16,833
(% of AGI for various income ranges: 47.1% for AGIs $25k-50k, 191.2% for AGIs $75k-100k, 201.4% for AGIs $100k-200k)
Profit/loss from business: +$7,087 (reported on 17.6% of returns)
Here:
+$7,087
State:
+$7,724
(% of AGI for various income ranges: 220.0% for AGIs below $25k, 47.1% for AGIs $25k-50k, 235.0% for AGIs $50k-75k, 475.7% for AGIs $100k-200k)
Taxable individual retirement arrangement distribution: $18,444 (reported on 10.6% of returns)
39664:
$18,444
Mississippi:
$17,717
(% of AGI for various income ranges: 94.3% for AGIs below $25k, 197.6% for AGIs $25k-50k, 605.0% for AGIs $50k-75k, 917.1% for AGIs $100k-200k)
Total itemized deductions: $24,300 (reported on 3.5% of returns)
Here:
$24,300
State:
$34,027
(% of AGI for various income ranges: 428.8% for AGIs $25k-50k)
Taxes paid: $5,600 (reported on 3.5% of returns)
39664:
$5,600
State:
$6,353
(% of AGI for various income ranges: 240.0% for AGIs $100k-200k)
Earned income credit: $2,694 (reported on 20.0% of returns)
Here:
$2,694
State:
$2,689
(% of AGI for various income ranges: 151.4% for AGIs below $25k, 82.4% for AGIs $25k-50k)
Percentage of individuals using paid preparers for their 2020 taxes: 92.9%
Here:
93%
State:
94%
(% for various income ranges: 89.7% for AGIs below $25k, 95.5% for AGIs $25k-50k, 91.7% for AGIs $50k-75k, 100.0% for AGIs $75k-100k, 91.7% for AGIs $100k-200k)
Averages for the 2012 tax year for zip code 39664, filed in 2013:
Average Adjusted Gross Income (AGI) in 2012: $48,167 (Individual Income Tax Returns)
Here:
$48,167
State:
$46,197
Salary/wage: $43,068 (reported on 84.0% of returns)
Here:
$43,068
State:
$38,549
(% of AGI for various income ranges: 72.2% for AGIs below $25k, 76.6% for AGIs $25k-50k, 79.1% for AGIs $50k-75k, 83.0% for AGIs $75k-100k, 68.6% for AGIs $100k-200k)
Taxable interest for individuals: $485 (reported on 24.7% of returns)
This zip code:
$485
Mississippi:
$1,482
(% of AGI for various income ranges: 0.7% for AGIs below $25k, 0.3% for AGIs $25k-50k, 0.2% for AGIs $50k-75k, 0.2% for AGIs $75k-100k)
Ordinary dividends: $755 (reported on 13.6% of returns)
Here:
$755
State:
$5,401
(% of AGI for various income ranges: 0.5% for AGIs below $25k, 0.3% for AGIs $25k-50k, 0.2% for AGIs $50k-75k, 0.2% for AGIs $100k-200k)
Net capital gain/loss in AGI: +$10,020 (reported on 12.3% of returns)
Here:
+$10,020
State:
+$12,121
(% of AGI for various income ranges: 3.1% for AGIs below $25k, 1.6% for AGIs $25k-50k, 1.5% for AGIs $50k-75k, 4.8% for AGIs $100k-200k)
Profit/loss from business: +$5,075 (reported on 19.8% of returns)
Here:
+$5,075
State:
+$10,220
(% of AGI for various income ranges: 5.4% for AGIs below $25k, 1.4% for AGIs $25k-50k, 1.1% for AGIs $50k-75k, 3.0% for AGIs $100k-200k)
Taxable individual retirement arrangement distribution: $12,657 (reported on 8.6% of returns)
39664:
$12,657
Mississippi:
$13,665
Total itemized deductions: $20,548 (25% of AGI, reported on 25.9% of returns)
Here:
$20,548
State:
$22,078
Here:
24.9% of AGI
State:
21.8% of AGI
(% of AGI for various income ranges: 7.9% for AGIs below $25k, 10.6% for AGIs $25k-50k, 9.3% for AGIs $50k-75k, 13.2% for AGIs $75k-100k, 12.8% for AGIs $100k-200k)
Charity contributions: $4,812 (reported on 21.0% of returns)
Here:
$4,812
State:
$6,081
(% of AGI for various income ranges: 2.7% for AGIs $25k-50k, 2.2% for AGIs $50k-75k, 2.1% for AGIs $75k-100k, 2.4% for AGIs $100k-200k)
Taxes paid: $3,929 (reported on 25.9% of returns)
39664:
$3,929
State:
$5,794
(% of AGI for various income ranges: 0.6% for AGIs below $25k, 1.4% for AGIs $25k-50k, 1.5% for AGIs $50k-75k, 2.5% for AGIs $75k-100k, 3.3% for AGIs $100k-200k)
Earned income credit: $2,374 (reported on 23.5% of returns)
Here:
$2,374
State:
$2,710
(% of AGI for various income ranges: 7.8% for AGIs below $25k, 1.5% for AGIs $25k-50k)
Percentage of individuals using paid preparers for their 2012 taxes: 70.4%
Here:
70%
State:
60%
(% for various income ranges: 65.6% for AGIs below $25k, 68.4% for AGIs $25k-50k, 73.3% for AGIs $50k-75k, 83.3% for AGIs $75k-100k, 77.8% for AGIs $100k-200k)
Averages for the 2004 tax year for zip code 39664, filed in 2005:
Average Adjusted Gross Income (AGI) in 2004: $32,343 (Individual Income Tax Returns)
Here:
$32,343
State:
$36,110
Salary/wage: $31,977 (reported on 84.2% of returns)
Here:
$31,977
State:
$31,757
(% of AGI for various income ranges: 165.4% for AGIs below $10k, 75.8% for AGIs $10k-25k, 83.9% for AGIs $25k-50k, 84.3% for AGIs $50k-75k, 84.3% for AGIs $75k-100k, 77.0% for AGIs over 100k)
Taxable interest for individuals: $1,054 (reported on 32.8% of returns)
This zip code:
$1,054
Mississippi:
$1,649
(% of AGI for various income ranges: 8.0% for AGIs below $10k, 2.2% for AGIs $10k-25k, 1.3% for AGIs $25k-50k, 0.4% for AGIs $50k-75k, 0.3% for AGIs $75k-100k, 0.1% for AGIs over 100k)
Taxable dividends: $861 (reported on 13.7% of returns)
Here:
$861
State:
$3,089
(% of AGI for various income ranges: 2.3% for AGIs below $10k, 0.5% for AGIs $10k-25k, 0.4% for AGIs $25k-50k, 0.2% for AGIs $50k-75k, 0.5% for AGIs $75k-100k, 0.2% for AGIs over 100k)
Net capital gain/loss: +$2,412 (reported on 13.0% of returns)
Here:
+$2,412
State:
+$8,427
(% of AGI for various income ranges: -2.7% for AGIs below $10k, -0.1% for AGIs $10k-25k, 1.5% for AGIs $25k-50k, 1.2% for AGIs $50k-75k, 1.8% for AGIs $75k-100k)
Profit/loss from business: +$6,091 (reported on 16.8% of returns)
Here:
+$6,091
State:
+$8,818
(% of AGI for various income ranges: 10.3% for AGIs below $10k, 6.5% for AGIs $10k-25k, 4.8% for AGIs $25k-50k, 1.0% for AGIs $50k-75k, 0.1% for AGIs $75k-100k)
Total itemized deductions: $15,374 (27% of AGI, reported on 18.7% of returns)
Here:
$15,374
State:
$17,896
Here:
26.8% of AGI
State:
22.5% of AGI
(% of AGI for various income ranges: 7.3% for AGIs $10k-25k, 9.4% for AGIs $25k-50k, 8.7% for AGIs $50k-75k, 10.0% for AGIs $75k-100k, 9.9% for AGIs over 100k)
Charity contributions deductions: $4,186 (7% of AGI, reported on 15.0% of returns)
Here:
$4,186
State:
$4,735
Here:
7.1% of AGI
State:
5.7% of AGI
(% of AGI for various income ranges: 1.4% for AGIs $10k-25k, 1.6% for AGIs $25k-50k, 1.8% for AGIs $50k-75k, 3.3% for AGIs $75k-100k, 2.7% for AGIs over 100k)
Total tax: $3,534 (reported on 70.9% of returns)
39664:
$3,534
State:
$5,562
(% of AGI for various income ranges: 5.7% for AGIs below $10k, 3.4% for AGIs $10k-25k, 6.2% for AGIs $25k-50k, 8.1% for AGIs $50k-75k, 10.2% for AGIs $75k-100k, 15.1% for AGIs over 100k)
Earned income credit: $2,098 (reported on 22.1% of returns)
Here:
$2,098
State:
$2,107
Percentage of individuals using paid preparers for their 2004 taxes: 69.1%
Here:
69%
State:
65%
(% for various income ranges: 59.6% for AGIs below $10k, 67.1% for AGIs $10k-25k, 72.8% for AGIs $25k-50k, 71.1% for AGIs $50k-75k, 77.8% for AGIs $75k-100k, 88.0% for AGIs over 100k)
Household received Food Stamps/SNAP in the past 12 months: 222 Household did not receive Food Stamps/SNAP in the past 12 months: 618
Women who did not have a birth in the past 12 months: 291 (178 now married, 111 unmarried)
Housing units in zip code 39664 with a mortgage: 199 (13 second mortgage, 13 both second mortgage and home equity loan) Median monthly owner costs for units with a mortgage: $954 Median monthly owner costs for units without a mortgage: $343
Residents with income below the poverty level in 2022:
This zip code:
25.5%
Whole state:
19.1%
Residents with income below 50% of the poverty level in 2022:
This zip code:
17.2%
Whole state:
10.3%
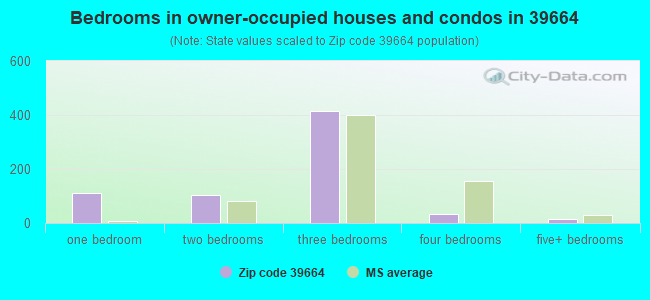
Median number of rooms in houses and condos:
Here:
6.0
State:
6.3
Median number of rooms in apartments:
Here:
6.2
State:
4.8
Notable locations in this zip code not listed on our city pages
Churches in zip code 39664 include: Oak Grove Baptist Church (A), Oak Grove Primitive Baptist Church (B), Thompson Baptist Church (C), Mount Olive Baptist Church (D), Pleasant Grove Church (E), Mars Hill Baptist Church (F), East Fork Baptist Church (G), Temble Hill Church (H), Calvary Church (I). Display/hide their locations on the map
Cemeteries: Flowers Cemetery (1), Fenn Cemetery (2), Mount Olive Cemetery (3), Marsalis Cemetery (4), Mars Hill Cemetery (5), Cupit Cemetery (6), Cruise Cemetery (7). Display/hide their locations on the map
Streams, rivers, and creeks: Shackaloa Creek (A), Pumpkin Patch Creek (B), Candy Creek (C), Cotton Creek (D), Ferd Creek (E), Meadville Branch (F), Robinson Creek (G), Scott Creek (H), Wactor Mill Creek (I). Display/hide their locations on the map
Size of family households: 344 2-persons, 138 3-persons, 22 4-persons, 45 5-persons, 12 6-persons
Size of nonfamily households: 284 1-person
381 married couples with children.
192 single-parent households (46 men, 146 women).
100.7% of residents of 39664 zip code speak English at home.
Foreign born population: 0 (0.0%)
:
0.0%
Whole state:
2.2%
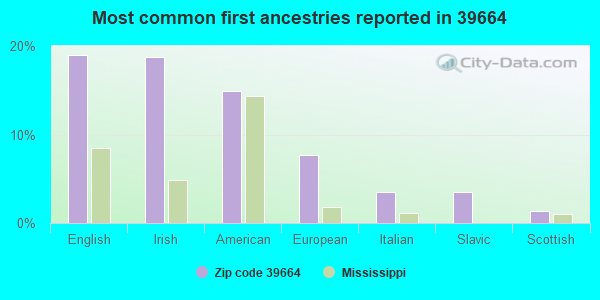
19%English
19%Irish
15%American
8%European
3%Italian
3%Slavic
1%Scottish
Facilities with environmental interests located in this zip code:
ABBASS PAUL BALOUCH, POULTRY (6370 ADAMS ROAD in SMITHDALE, MS)
STATE MASTER (Mississippi compliance, permits, activity tracking ) - ENSITE-MSR101090, NPDES STORMWATER PERMIT National Pollutant Discharge Elimination System NON-MAJOR (Tracking pollutant discharge elimination systems) - permit Business SIC classification: POULTRY AND EGGS
COLEY FARMS INC (REEVES ROAD in SMITHDALE, MS)
STATE MASTER (Mississippi compliance, permits, activity tracking ) - ENSITE-MSG150237, LIVE STOCK WASTE CONTROL National Pollutant Discharge Elimination System NON-MAJOR (Tracking pollutant discharge elimination systems) - permit Business SIC classification: BROILER, FRYER, AND ROASTER CHICKENS Alternative names: AMITE
WILLIAM H MARTIN JR, POULTRY (HIGHWAY 98 EAST in SMITHDALE, MS)
STATE MASTER (Mississippi compliance, permits, activity tracking ) - ENSITE-MSG150209, LIVE STOCK WASTE CONTROL National Pollutant Discharge Elimination System NON-MAJOR (Tracking pollutant discharge elimination systems) - permit Business SIC classification: BROILER, FRYER, AND ROASTER CHICKENS Alternative names: FRANKLIN
AMITE (7220 BROWN ROAD in SMITHDALE, MS)
National Pollutant Discharge Elimination System NON-MAJOR (Tracking pollutant discharge elimination systems) - permit Business SIC classification: BROILER, FRYER, AND ROASTER CHICKENS
Housing units lacking complete plumbing facilities: 5.4% Housing units lacking complete kitchen facilities: 3.1%
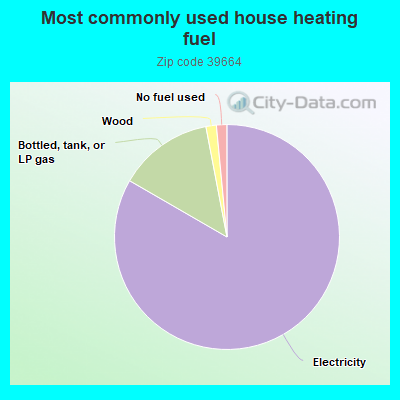
83.6%Electricity
13.7%Bottled, tank, or LP gas
1.5%Wood
1.5%No fuel used
Population in 1990: 1,247. Population change in the 1990s: +787 (+63.1%).
Place of birth for U.S.-born residents:
This state: 1,538
Northeast: 27
Midwest: 79
South: 334
West: 23
74% of the 39664 zip code residents lived in the same house 5 years ago. Out of people who lived in different houses, 46% lived in this county. Out of people who lived in different counties, 50% lived in Mississippi.
96% of the 39664 zip code residents lived in the same house 1 year ago. Out of people who lived in different houses, 71% moved from different county within same state. Out of people who lived in different houses, 33% moved from different state.
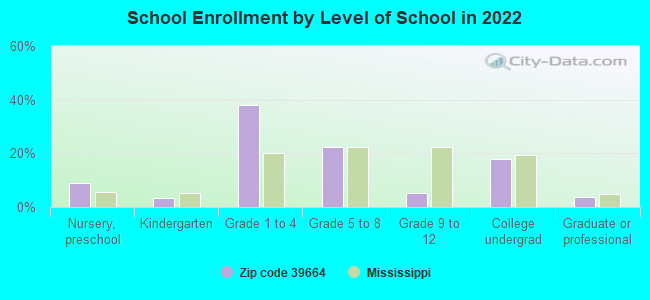
Private vs. public school enrollment:
Students in private schools in grades 1 to 8 (elementary and middle school):
Here:
0.0%
Mississippi:
16.1%
Students in private schools in grades 9 to 12 (high school):
Here:
0.0%
Mississippi:
14.6%
Students in private undergraduate colleges:
Here:
0.0%
Mississippi:
12.8%
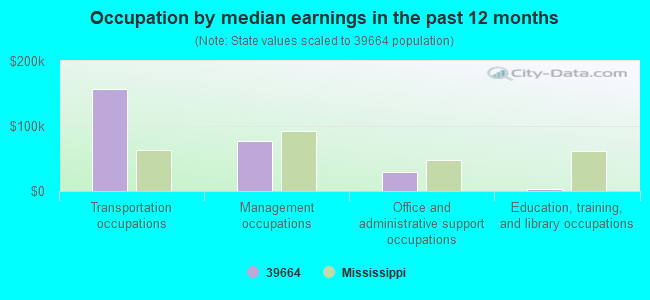
Occupation by median earnings in the past 12 months ($)
156,421Transportation occupations
76,891Management occupations
29,338Office and administrative support occupations
3,650Education, training, and library occupations
Top industries in this zip code by the number of employees in 2005:
Other Services (except Public Administration): Religious Organizations (5-9 employees: 1 establishment, 1-4 employees: 2 establishments)
Construction: Site Preparation Contractors (5-9: 1, 1-4: 1)
Administrative and Support and Waste Management and Remediation Services: Exterminating and Pest Control Services (1-4: 1)
Construction: Roofing Contractors (1-4: 1)
Construction: Painting and Wall Covering Contractors (1-4: 1)
Construction: New Single-Family Housing Construction (except Operative Builders) (1-4: 1)
Other Services (except Public Administration): Labor Unions and Similar Labor Organizations (1-4: 1)
Professional, Scientific, and Technical Services: Surveying and Mapping (except Geophysical) Services (1-4: 1)
Fatal accident statistics in 2014:
Fatal accident count: 1
Vehicles involved in fatal accidents: 1
Fatal accidents caused by drunken drivers: 1
Fatalities: 1
Persons involved in fatal accidents: 1
Pedestrians involved in fatal accidents: 0
Fatal accident statistics in 2013:
Fatal accident count: 1
Vehicles involved in fatal accidents: 1
Fatal accidents caused by drunken drivers: 1
Fatalities: 1
Persons involved in fatal accidents: 2
Pedestrians involved in fatal accidents: 0
2003 - 2018 National Fire Incident Reporting System (NFIRS) incidents
According to the data from the years 2003 - 2018 the average number of fire incidents per year is 22. The highest number of reported fires - 43 took place in 2004, and the least - 7 in 2017. The data has a declining trend.
When looking into fire subcategories, the most incidents belonged to: Outside Fires (57.3%), and Structure Fires (33.1%).
Fire incident types reported to NFIRS in Zip Code 39664

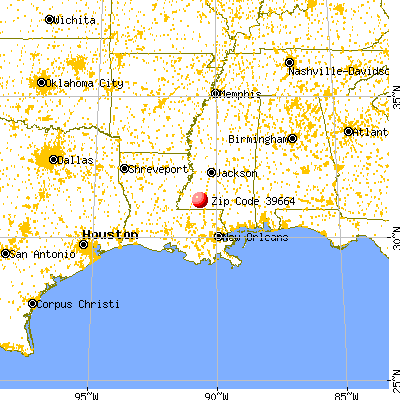


 Nearest zip codes: 39666, 39647, 39645, 39630, 39629, 39653.


 According to the data from the years 2003 - 2018 the average number of fire incidents per year is 22. The highest number of reported fires - 43 took place in 2004, and the least - 7 in 2017. The data has a declining trend.
 When looking into fire subcategories, the most incidents belonged to: Outside Fires (57.3%), and Structure Fires (33.1%).