Estimated zip code population in 2022: 7,699 Zip code population in 2010: 7,153 Zip code population in 2000: 6,827
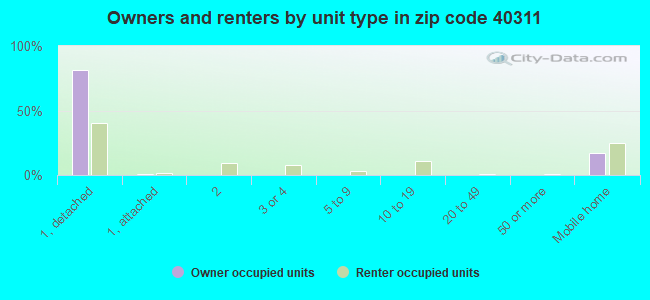
Houses and condos: 3,354 Renter-occupied apartments: 777
% of renters here:
29%
State:
31%
March 2022 cost of living index in zip code 40311: 80.6 (low, U.S. average is 100)
Land area: 175.5 sq. mi. Water area: 1.3 sq. mi.
Population density: 44 people per square mile
(very low).
OSM Map
General Map
Google Map
MSN Map
OSM Map
General Map
Google Map
MSN Map
OSM Map
General Map
Google Map
MSN Map
OSM Map
General Map
Google Map
MSN Map
Please wait while loading the map...
Real estate property taxes paid for housing units in 2022:
This zip code:
0.6% ($759)
Kentucky:
0.7% ($1,456)
Median real estate property taxes paid for housing units with mortgages in 2022: $892 (0.6%) Median real estate property taxes paid for housing units with no mortgage in 2022: $573 (0.5%)
Estimated median house/condo value in 2022: $131,421
40311:
$131,421
Kentucky:
$196,300
According to our research of Kentucky and other state lists, there were 11 registered sex offenders living in 40311 zip code as of April 27, 2024. The ratio of all residents to sex offenders in zip code 40311 is 680 to 1. The ratio of registered sex offenders to all residents in this zip code is lower than the state average.
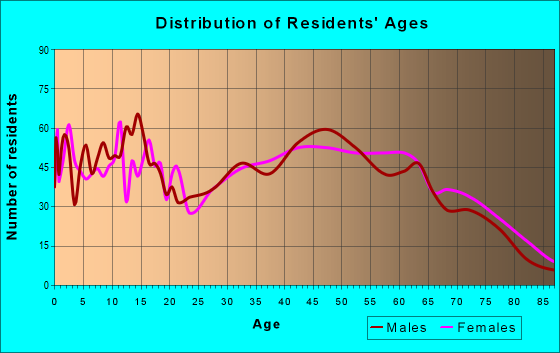
Median resident age:
This zip code:
39.3 years
Kentucky median age:
39.4 years
Average household size:
This zip code:
2.8 people
Kentucky:
2.4 people
Averages for the 2020 tax year for zip code 40311, filed in 2021:
Average Adjusted Gross Income (AGI) in 2020: $44,655 (Individual Income Tax Returns)
Here:
$44,655
State:
$61,342
Salary/wage: $41,865 (reported on 80.5% of returns)
Here:
$41,865
State:
$50,827
(% of AGI for various income ranges: 1159.9% for AGIs below $25k, 3776.2% for AGIs $25k-50k, 6569.1% for AGIs $50k-75k, 8992.9% for AGIs $75k-100k, 15065.6% for AGIs $100k-200k)
Taxable interest for individuals: $1,243 (reported on 19.2% of returns)
This zip code:
$1,243
Kentucky:
$1,441
(% of AGI for various income ranges: 20.1% for AGIs below $25k, 11.5% for AGIs $25k-50k, 15.0% for AGIs $50k-75k, 108.8% for AGIs $75k-100k, 139.4% for AGIs $100k-200k)
Ordinary dividends: $2,074 (reported on 7.9% of returns)
Here:
$2,074
State:
$7,388
(% of AGI for various income ranges: 10.0% for AGIs below $25k, 6.8% for AGIs $25k-50k, 38.4% for AGIs $50k-75k, 31.8% for AGIs $75k-100k, 108.7% for AGIs $100k-200k)
Net capital gain/loss in AGI: +$19,936 (reported on 7.5% of returns)
Here:
+$19,936
State:
+$19,475
(% of AGI for various income ranges: 16.2% for AGIs below $25k, 54.5% for AGIs $25k-50k, 63.1% for AGIs $50k-75k, 365.3% for AGIs $75k-100k, 1922.5% for AGIs $100k-200k)
Profit/loss from business: +$9,717 (reported on 16.1% of returns)
Here:
+$9,717
State:
+$11,386
(% of AGI for various income ranges: 243.7% for AGIs below $25k, 119.5% for AGIs $25k-50k, 154.7% for AGIs $50k-75k, 158.8% for AGIs $75k-100k, 641.9% for AGIs $100k-200k)
Taxable individual retirement arrangement distribution: $13,225 (reported on 6.8% of returns)
40311:
$13,225
Kentucky:
$18,941
(% of AGI for various income ranges: 48.2% for AGIs below $25k, 71.7% for AGIs $25k-50k, 154.1% for AGIs $50k-75k, 168.2% for AGIs $75k-100k, 628.1% for AGIs $100k-200k)
Total itemized deductions: $24,300 (reported on 2.1% of returns)
Here:
$24,300
State:
$32,473
(% of AGI for various income ranges: 76.0% for AGIs $25k-50k, 602.5% for AGIs $100k-200k)
Charity contributions: $10,125 (reported on 1.4% of returns)
Here:
$10,125
State:
$13,472
(% of AGI for various income ranges: 253.1% for AGIs $100k-200k)
Taxes paid: $8,240 (reported on 1.7% of returns)
40311:
$8,240
State:
$7,830
(% of AGI for various income ranges: 20.0% for AGIs $25k-50k, 176.2% for AGIs $100k-200k)
Earned income credit: $2,339 (reported on 23.6% of returns)
Here:
$2,339
State:
$2,336
(% of AGI for various income ranges: 129.1% for AGIs below $25k, 85.4% for AGIs $25k-50k)
Percentage of individuals using paid preparers for their 2020 taxes: 91.4%
Here:
91%
State:
94%
(% for various income ranges: 90.4% for AGIs below $25k, 91.6% for AGIs $25k-50k, 93.0% for AGIs $50k-75k, 91.3% for AGIs $75k-100k, 92.0% for AGIs $100k-200k, 100.0% for AGIs over 200k)
Averages for the 2012 tax year for zip code 40311, filed in 2013:
Average Adjusted Gross Income (AGI) in 2012: $37,993 (Individual Income Tax Returns)
Here:
$37,993
State:
$50,814
Salary/wage: $35,397 (reported on 81.9% of returns)
Here:
$35,397
State:
$42,723
(% of AGI for various income ranges: 71.1% for AGIs below $25k, 84.5% for AGIs $25k-50k, 80.4% for AGIs $50k-75k, 83.5% for AGIs $75k-100k, 61.1% for AGIs $100k-200k)
Taxable interest for individuals: $1,077 (reported on 27.0% of returns)
This zip code:
$1,077
Kentucky:
$1,381
(% of AGI for various income ranges: 1.1% for AGIs below $25k, 0.7% for AGIs $25k-50k, 0.9% for AGIs $50k-75k, 0.7% for AGIs $75k-100k, 0.6% for AGIs $100k-200k)
Ordinary dividends: $1,727 (reported on 8.1% of returns)
Here:
$1,727
State:
$6,239
(% of AGI for various income ranges: 0.4% for AGIs below $25k, 0.5% for AGIs $25k-50k, 0.7% for AGIs $50k-75k, 0.1% for AGIs $75k-100k, 0.2% for AGIs $100k-200k)
Net capital gain/loss in AGI: +$4,506 (reported on 12.6% of returns)
Here:
+$4,506
State:
+$11,336
(% of AGI for various income ranges: 1.1% for AGIs below $25k, 0.7% for AGIs $25k-50k, 0.8% for AGIs $50k-75k, 1.1% for AGIs $75k-100k, 3.7% for AGIs $100k-200k)
Profit/loss from business: +$7,398 (reported on 17.8% of returns)
Here:
+$7,398
State:
+$10,862
(% of AGI for various income ranges: 12.7% for AGIs below $25k, 2.5% for AGIs $25k-50k, 0.8% for AGIs $50k-75k, 1.2% for AGIs $75k-100k, 2.2% for AGIs $100k-200k)
Taxable individual retirement arrangement distribution: $9,339 (reported on 8.5% of returns)
40311:
$9,339
Kentucky:
$14,296
(% of AGI for various income ranges: 2.6% for AGIs below $25k, 1.8% for AGIs $25k-50k, 2.5% for AGIs $50k-75k, 4.3% for AGIs $75k-100k)
Total itemized deductions: $17,694 (23% of AGI, reported on 18.5% of returns)
Here:
$17,694
State:
$21,160
Here:
22.5% of AGI
State:
20.0% of AGI
(% of AGI for various income ranges: 4.6% for AGIs below $25k, 7.3% for AGIs $25k-50k, 6.3% for AGIs $50k-75k, 11.5% for AGIs $75k-100k, 13.5% for AGIs $100k-200k)
Charity contributions: $3,003 (reported on 13.7% of returns)
Here:
$3,003
State:
$4,303
(% of AGI for various income ranges: 0.5% for AGIs below $25k, 0.6% for AGIs $25k-50k, 1.1% for AGIs $50k-75k, 1.2% for AGIs $75k-100k, 2.0% for AGIs $100k-200k)
Taxes paid: $6,848 (reported on 18.5% of returns)
40311:
$6,848
State:
$8,496
(% of AGI for various income ranges: 0.7% for AGIs below $25k, 1.7% for AGIs $25k-50k, 2.1% for AGIs $50k-75k, 4.7% for AGIs $75k-100k, 7.4% for AGIs $100k-200k)
Earned income credit: $2,239 (reported on 28.1% of returns)
Here:
$2,239
State:
$2,273
(% of AGI for various income ranges: 8.6% for AGIs below $25k, 1.3% for AGIs $25k-50k)
Percentage of individuals using paid preparers for their 2012 taxes: 74.1%
Here:
74%
State:
60%
(% for various income ranges: 72.3% for AGIs below $25k, 74.3% for AGIs $25k-50k, 78.9% for AGIs $50k-75k, 72.2% for AGIs $75k-100k, 78.6% for AGIs $100k-200k)
Averages for the 2004 tax year for zip code 40311, filed in 2005:
Average Adjusted Gross Income (AGI) in 2004: $31,422 (Individual Income Tax Returns)
Here:
$31,422
State:
$41,540
Salary/wage: $30,448 (reported on 83.9% of returns)
Here:
$30,448
State:
$36,432
(% of AGI for various income ranges: 132.9% for AGIs below $10k, 79.9% for AGIs $10k-25k, 86.6% for AGIs $25k-50k, 88.2% for AGIs $50k-75k, 87.0% for AGIs $75k-100k, 42.5% for AGIs over 100k)
Taxable interest for individuals: $1,194 (reported on 35.2% of returns)
This zip code:
$1,194
Kentucky:
$1,571
(% of AGI for various income ranges: 10.0% for AGIs below $10k, 2.4% for AGIs $10k-25k, 0.9% for AGIs $25k-50k, 0.5% for AGIs $50k-75k, 1.0% for AGIs $75k-100k, 1.7% for AGIs over 100k)
Taxable dividends: $1,917 (reported on 8.8% of returns)
Here:
$1,917
State:
$3,453
(% of AGI for various income ranges: 1.0% for AGIs below $10k, 0.4% for AGIs $10k-25k, 0.4% for AGIs $25k-50k, 0.2% for AGIs $50k-75k, 0.2% for AGIs $75k-100k, 1.9% for AGIs over 100k)
Net capital gain/loss: +$5,741 (reported on 9.4% of returns)
Here:
+$5,741
State:
+$9,663
(% of AGI for various income ranges: 4.1% for AGIs below $10k, 0.5% for AGIs $10k-25k, 1.0% for AGIs $25k-50k, 0.9% for AGIs $50k-75k, 2.4% for AGIs $75k-100k, 5.4% for AGIs over 100k)
Profit/loss from business: +$3,927 (reported on 15.8% of returns)
Here:
+$3,927
State:
+$9,233
(% of AGI for various income ranges: 12.9% for AGIs below $10k, 2.9% for AGIs $10k-25k, 2.2% for AGIs $25k-50k, 0.6% for AGIs $50k-75k, 0.6% for AGIs $75k-100k, 2.5% for AGIs over 100k)
IRA payment deduction: $2,258 (reported on 1.1% of returns)
40311:
$2,258
Kentucky:
$2,955
Total itemized deductions: $13,681 (23% of AGI, reported on 20.4% of returns)
Here:
$13,681
State:
$17,474
Here:
23.4% of AGI
State:
21.0% of AGI
(% of AGI for various income ranges: 14.7% for AGIs below $10k, 5.7% for AGIs $10k-25k, 6.8% for AGIs $25k-50k, 10.2% for AGIs $50k-75k, 14.1% for AGIs $75k-100k, 9.4% for AGIs over 100k)
Charity contributions deductions: $2,223 (4% of AGI, reported on 15.0% of returns)
Here:
$2,223
State:
$3,494
Here:
3.5% of AGI
State:
4.0% of AGI
(% of AGI for various income ranges: 0.8% for AGIs below $10k, 0.9% for AGIs $10k-25k, 0.7% for AGIs $25k-50k, 1.2% for AGIs $50k-75k, 1.5% for AGIs $75k-100k, 1.5% for AGIs over 100k)
Total tax: $3,378 (reported on 72.2% of returns)
40311:
$3,378
State:
$6,162
(% of AGI for various income ranges: 5.6% for AGIs below $10k, 3.8% for AGIs $10k-25k, 6.0% for AGIs $25k-50k, 8.0% for AGIs $50k-75k, 9.7% for AGIs $75k-100k, 15.1% for AGIs over 100k)
Earned income credit: $1,642 (reported on 21.0% of returns)
Here:
$1,642
State:
$1,723
Percentage of individuals using paid preparers for their 2004 taxes: 78.7%
Here:
79%
State:
66%
(% for various income ranges: 75.7% for AGIs below $10k, 78.1% for AGIs $10k-25k, 80.8% for AGIs $25k-50k, 82.1% for AGIs $50k-75k, 69.4% for AGIs $75k-100k, 87.9% for AGIs over 100k)
Likely homosexual households (counted as self-reported same-sex unmarried-partner households)
Lesbian couples: 0.6% of all households
Gay men: 0.0% of all households
Household received Food Stamps/SNAP in the past 12 months: 355 Household did not receive Food Stamps/SNAP in the past 12 months: 2,367
Women who had a birth in the past 12 months: 97 (84 now married, 11 unmarried) Women who did not have a birth in the past 12 months: 1,527 (784 now married, 745 unmarried)
Housing units in zip code 40311 with a mortgage: 890 (85 second mortgage, 44 both second mortgage and home equity loan) Houses without a mortgage: 24
Median monthly owner costs for units with a mortgage: $1,077 Median monthly owner costs for units without a mortgage: $439
Residents with income below the poverty level in 2022:
This zip code:
14.1%
Whole state:
16.5%
Residents with income below 50% of the poverty level in 2022:
This zip code:
8.0%
Whole state:
9.0%
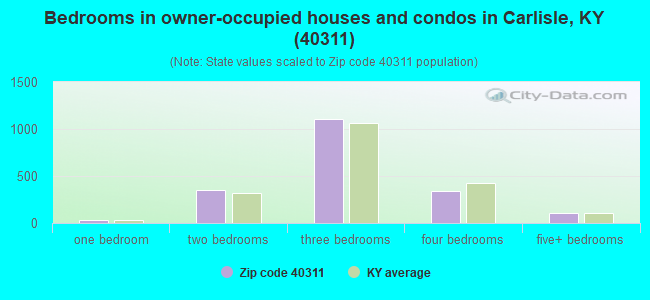
Median number of rooms in houses and condos:
Here:
6.9
State:
6.4
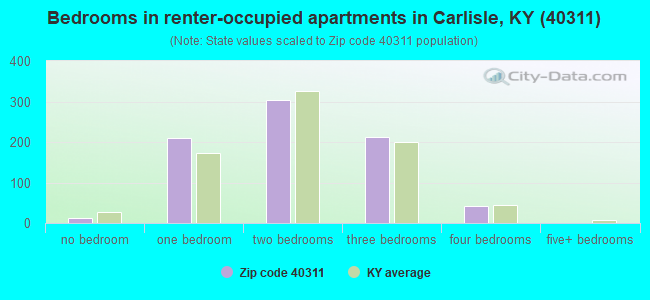
Median number of rooms in apartments:
Here:
4.5
State:
4.4
Notable locations in this zip code not listed on our city pages
Notable locations in zip code 40311: Blue Licks Spring (A), Salt Well (B), North Central District 4-H Camp (C), Walnut Grove (D), Lower Blue Licks (E), Hogjaws (F), Masonic Lodge Hall (G), Nicholas County Volunteer Fire Department (H), Little Rock Volunteer Fire Department (I), Carlisle City Fire Department (J). Display/hide their locations on the map
Churches in zip code 40311 include: Ishmael Church (A), Locust Grove Church (B), Needmore Church (C), Oakland Mills Church (D), Parrish Chapel (E), Stony Creek Church (F), Ball Hill Church (G), Rose Hill Church (H). Display/hide their locations on the map
Cemeteries: Thomason Cemetery (1), Collins Cemetery (2), Crouch Cemetery (3), Needmore Church Cemetery (4), Rose Hill Church Cemetery (5), Edward Boone Grave (6), Letton Cemetery (7). Display/hide their locations on the map
Streams, rivers, and creeks: Boone Creek (A), Brush Creek (B), Brushy Creek (C), West Branch Sugar Creek (D), Clear Creek (E), Taylors Creek (F), Cassidy Creek (G), Cane Run (H), South Goose Creek (I). Display/hide their locations on the map
In group quarters: 108 (-1 institutionalized population)
Size of family households: 791 2-persons, 500 3-persons, 378 4-persons, 117 5-persons, 47 6-persons, 17 7-or-more-persons
Size of nonfamily households: 696 1-person, 161 2-persons, 13 4-persons
1,216 married couples with children.
357 single-parent households (61 men, 296 women).
98.4% of residents of 40311 zip code speak English at home.
1.6% of residents speak other Indo-European language at home (13% very well, 87% well).
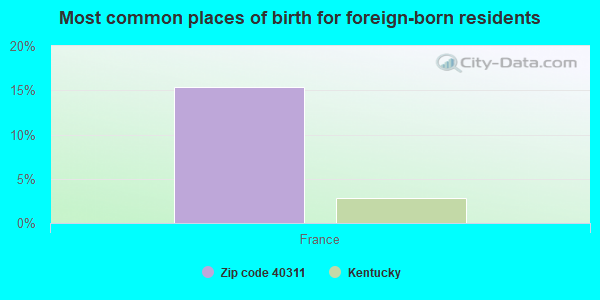
Foreign born population: 13 (0.2%) (78.4% of them are naturalized citizens)
This zip code:
0.2%
Whole state:
4.0%
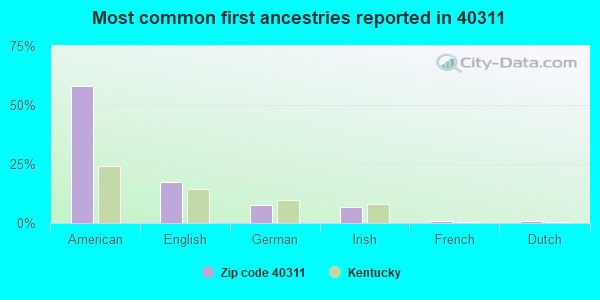
15%France
58%American
17%English
8%German
7%Irish
1%French
1%Dutch
0%Welsh
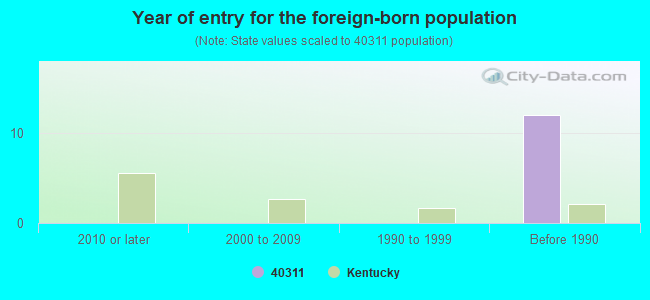
Year of entry for the foreign-born population
02010 or later
02000 to 2009
01990 to 1999
12Before 1990
Major facilities with environmental interests located in this zip code:
NICHOLAS COUNTY ELEMENTARY SCHOOL (316 SCHOOL DR in CARLISLE, KY)
(National Center for Education Statistics) - STATE ID-091455020 (Resource Conservation and Recovery Act (tracking hazardous waste)) Organizations: NICHOLAS COUNTY BOARD OF EDUCATION (CONTACT/OWNER)
NICHOLAS COUNTY HIGH SCHOOL (103 SCHOOL DRIVE in CARLISLE, KY)
(National Center for Education Statistics) - STATE ID-091455030
CARLISLE (CITY HALL BLDG 107 CHESTNUT ST in CARLISLE, KY)
(Integrated Compliance Information System) - ICIS-04-1988-0011, FORMAL ENFORCEMENT ACTION Business SIC classification: EXECUTIVE OFFICES
ALBERT VICE PROPERTY (148 LOCUST GROVE RD in CARLISLE, KY)
(Resource Conservation and Recovery Act (tracking hazardous waste))
ASHLAND PETROLEUM CO 475-065 (S MAIN & SYCAMORE ST in CARLISLE, KY)
(Resource Conservation and Recovery Act (tracking hazardous waste))
CARLISLE STP (HWY 36 W in CARLISLE, KY)
National Pollutant Discharge Elimination System NON-MAJOR (Tracking pollutant discharge elimination systems) - permit Business SIC classification: SEWERAGE SYSTEMS
CARLISLE WTP (107 EAST CHESTNUT ST in CARLISLE, KY)
National Pollutant Discharge Elimination System NON-MAJOR (Tracking pollutant discharge elimination systems) - permit Business SIC classification: WATER SUPPLY
COLUMBIA GAS OF KENTUCKY (HICKORY RDG RD RT 978 in CARLISLE, KY) . Federal Facility. UNDETERMINED OR UNKNOWN AGENCY AFFILIATION
(Resource Conservation and Recovery Act (tracking hazardous waste)) Organizations: COLUMBUS GAS OF KENTUCKY (CONTACT/OWNER)
NICHOLAS CO FISCAL COURT (NICHOLAS CO ROCK QUARRY in CARLISLE, KY)
National Pollutant Discharge Elimination System NON-MAJOR (Tracking pollutant discharge elimination systems) - permit Business SIC classification: CRUSHED AND BROKEN LIMESTONE
NORTH CENTRAL 4H CAMP (260 CAMP RD in CARLISLE, KY)
National Pollutant Discharge Elimination System NON-MAJOR (Tracking pollutant discharge elimination systems) - permit Business SIC classification: SPORTING AND RECREATIONAL CAMPS
OLD US 68 BRIDGE / LICKING RV (OLD MAYSVILLE RD in CARLISLE, KY)
National Pollutant Discharge Elimination System NON-MAJOR (Tracking pollutant discharge elimination systems) - permit Business SIC classification: BRIDGE, TUNNEL, AND ELEVATED HIGHWAY CONSTRUCTION
FRANKIES PLACE (240 MOOREFIELD RD in CARLISLE, KY)
(Resource Conservation and Recovery Act (tracking hazardous waste)) Organizations: JAMES FRANKLIN DAVIS (CONTACT/OWNER)
FRYMAN PROPERTY (HIGHWAY 68 in CARLISLE, KY)
(Resource Conservation and Recovery Act (tracking hazardous waste))
Housing units lacking complete plumbing facilities: 4.1% Housing units lacking complete kitchen facilities: 5.0%
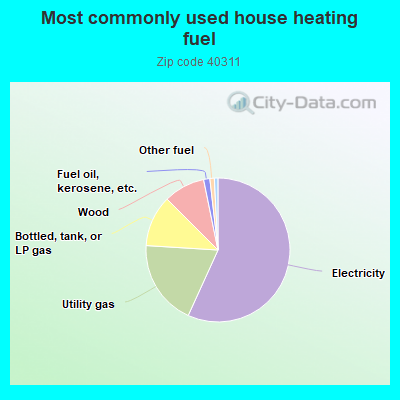
56.8%Electricity
19.2%Utility gas
11.5%Bottled, tank, or LP gas
9.3%Wood
1.4%Fuel oil, kerosene, etc.
1.0%Other fuel
0.8%No fuel used
Population in 1990: 6,825. Population change in the 1990s: +2 (+0.0%).
Place of birth for U.S.-born residents:
This state: 6,453
Northeast: 126
Midwest: 770
South: 257
West: 19
58% of the 40311 zip code residents lived in the same house 5 years ago. Out of people who lived in different houses, 56% lived in this county. Out of people who lived in different counties, 50% lived in Kentucky.
91% of the 40311 zip code residents lived in the same house 1 year ago. Out of people who lived in different houses, 71% moved from this county. Out of people who lived in different houses, 25% moved from different county within same state.
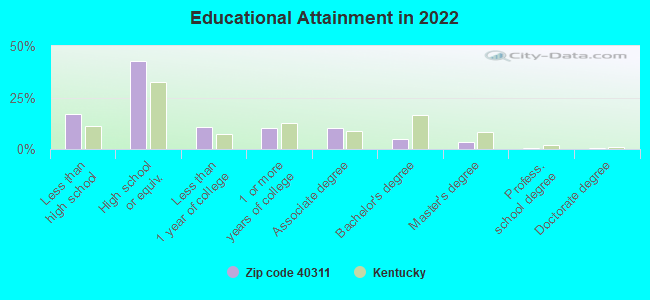
Private vs. public school enrollment:
Students in private schools in grades 1 to 8 (elementary and middle school): 231
Here:
22.3%
Kentucky:
17.2%
Students in private schools in grades 9 to 12 (high school): 14
Here:
3.6%
Kentucky:
15.2%
Students in private undergraduate colleges:
Here:
0.0%
Kentucky:
19.6%
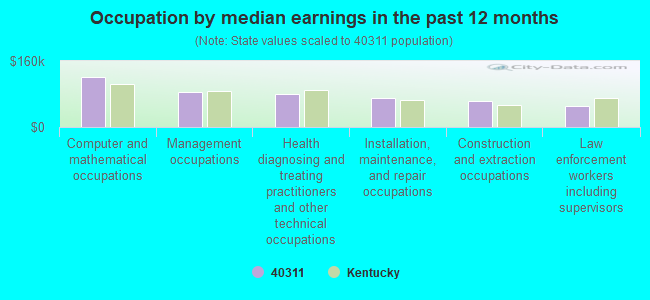
Occupation by median earnings in the past 12 months ($)
121,332Computer and mathematical occupations
84,605Management occupations
79,410Health diagnosing and treating practitioners and other technical occupations
71,013Installation, maintenance, and repair occupations
62,277Construction and extraction occupations
51,414Law enforcement workers including supervisors
Top industries in this zip code by the number of employees in 2005:
Health Care and Social Assistance: General Medical and Surgical Hospitals (100-249 employees: 1 establishment)
Health Care and Social Assistance: Other Individual and Family Services (20-49: 1)
Real Estate and Rental and Leasing: Offices of Real Estate Agents and Brokers (20-49: 1)
Finance and Insurance: Commercial Banking (10-19: 1, 5-9: 2)
Other Services (except Public Administration): Religious Organizations (5-9: 2, 1-4: 5)
Health Care and Social Assistance: Child Day Care Services (10-19: 1, 5-9: 1)
People in group quarters in 2010:
92 people in nursing facilities/skilled-nursing facilities
3 people in other noninstitutional facilities
People in group quarters in 2000:
103 people in nursing homes
Fatal accident statistics in 2014:
Fatal accident count: 2
Vehicles involved in fatal accidents: 2
Fatal accidents caused by drunken drivers: 1
Fatalities: 4
Persons involved in fatal accidents: 4
Pedestrians involved in fatal accidents: 0
Fatal accident statistics in 2013:
Fatal accident count: 1
Vehicles involved in fatal accidents: 1
Fatal accidents caused by drunken drivers: 0
Fatalities: 1
Persons involved in fatal accidents: 1
Pedestrians involved in fatal accidents: 1
2005 - 2018 National Fire Incident Reporting System (NFIRS) incidents
Based on the data from the years 2005 - 2018 the average number of fire incidents per year is 28. The highest number of fires - 69 took place in 2012, and the least - 0 in 2007. The data has a rising trend.
When looking into fire subcategories, the most reports belonged to: Structure Fires (43.4%), and Outside Fires (28.8%).
Fire incident types reported to NFIRS in Zip Code 40311


 Nearest zip codes: 40350, 40348, 41039, 40374, 41064, 41055.


 Based on the data from the years 2005 - 2018 the average number of fire incidents per year is 28. The highest number of fires - 69 took place in 2012, and the least - 0 in 2007. The data has a rising trend.
 When looking into fire subcategories, the most reports belonged to: Structure Fires (43.4%), and Outside Fires (28.8%).