Estimated zip code population in 2022: 24,308 Zip code population in 2010: 22,408 Zip code population in 2000: 20,454
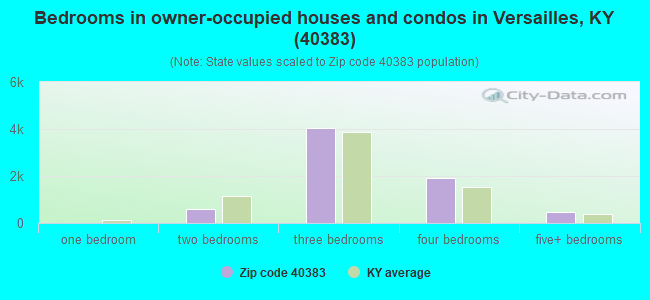
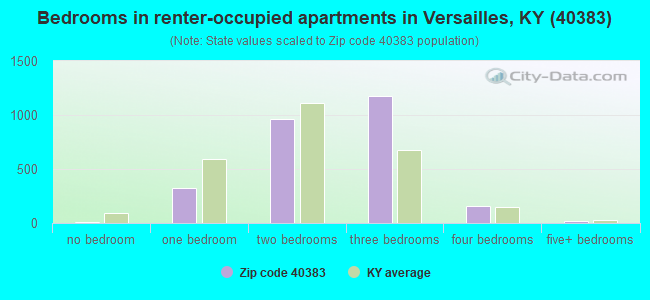
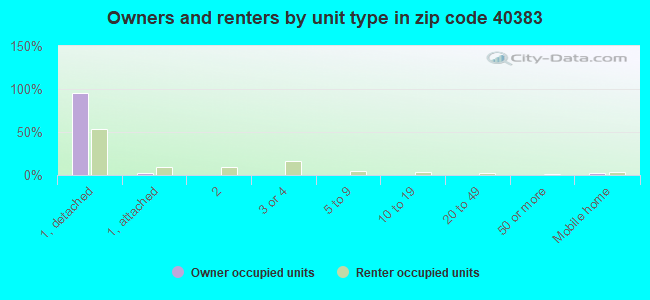
Houses and condos: 10,464 Renter-occupied apartments: 2,710
% of renters here:
28%
State:
31%
March 2022 cost of living index in zip code 40383: 88.9 (less than average, U.S. average is 100)
Land area: 151.8 sq. mi. Water area: 3.0 sq. mi.
Population density: 160 people per square mile
(very low).
OSM Map
General Map
Google Map
MSN Map
OSM Map
General Map
Google Map
MSN Map
OSM Map
General Map
Google Map
MSN Map
OSM Map
General Map
Google Map
MSN Map
Please wait while loading the map...
Real estate property taxes paid for housing units in 2022:
This zip code:
0.7% ($2,008)
Kentucky:
0.7% ($1,456)
Median real estate property taxes paid for housing units with mortgages in 2022: $2,044 (0.7%) Median real estate property taxes paid for housing units with no mortgage in 2022: $1,949 (0.7%)
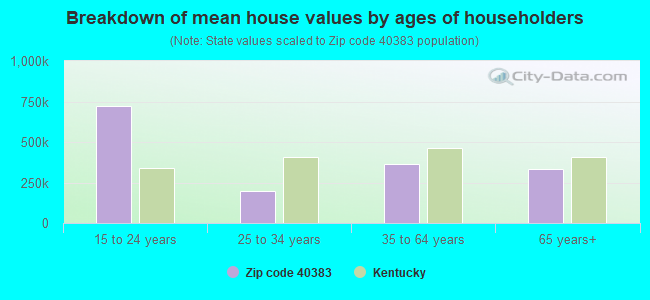
Estimated median house/condo value in 2022: $293,674
40383:
$293,674
Kentucky:
$196,300
According to our research of Kentucky and other state lists, there were 31 registered sex offenders living in 40383 zip code as of April 27, 2024. The ratio of all residents to sex offenders in zip code 40383 is 762 to 1. The ratio of registered sex offenders to all residents in this zip code is lower than the state average.
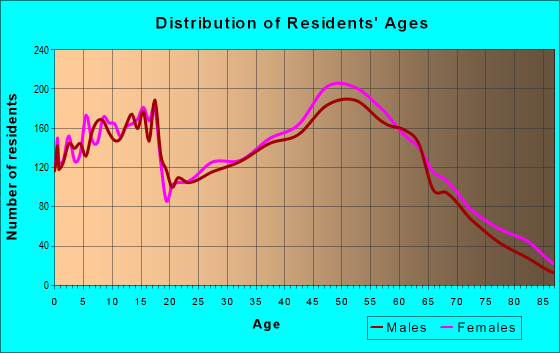
Median resident age:
This zip code:
43.0 years
Kentucky median age:
39.4 years
Average household size:
This zip code:
2.5 people
Kentucky:
2.4 people
Averages for the 2020 tax year for zip code 40383, filed in 2021:
Average Adjusted Gross Income (AGI) in 2020: $73,780 (Individual Income Tax Returns)
Here:
$73,780
State:
$61,342
Salary/wage: $58,590 (reported on 80.3% of returns)
Here:
$58,590
State:
$50,827
(% of AGI for various income ranges: 1185.9% for AGIs below $25k, 3651.2% for AGIs $25k-50k, 6133.3% for AGIs $50k-75k, 9304.3% for AGIs $75k-100k, 18120.4% for AGIs $100k-200k, 73351.9% for AGIs over 200k)
Taxable interest for individuals: $1,705 (reported on 34.5% of returns)
This zip code:
$1,705
Kentucky:
$1,441
(% of AGI for various income ranges: 21.1% for AGIs below $25k, 21.9% for AGIs $25k-50k, 59.2% for AGIs $50k-75k, 115.7% for AGIs $75k-100k, 158.9% for AGIs $100k-200k, 1708.1% for AGIs over 200k)
Ordinary dividends: $6,896 (reported on 20.6% of returns)
Here:
$6,896
State:
$7,388
(% of AGI for various income ranges: 24.7% for AGIs below $25k, 58.4% for AGIs $25k-50k, 149.1% for AGIs $50k-75k, 251.5% for AGIs $75k-100k, 509.1% for AGIs $100k-200k, 3668.8% for AGIs over 200k)
Net capital gain/loss in AGI: +$22,943 (reported on 18.5% of returns)
Here:
+$22,943
State:
+$19,475
(% of AGI for various income ranges: 15.5% for AGIs below $25k, 43.8% for AGIs $25k-50k, 148.5% for AGIs $50k-75k, 237.9% for AGIs $75k-100k, 738.4% for AGIs $100k-200k, 23239.4% for AGIs over 200k)
Profit/loss from business: +$14,264 (reported on 17.0% of returns)
Here:
+$14,264
State:
+$11,386
(% of AGI for various income ranges: 146.9% for AGIs below $25k, 167.6% for AGIs $25k-50k, 260.2% for AGIs $50k-75k, 505.1% for AGIs $75k-100k, 632.2% for AGIs $100k-200k, 5070.6% for AGIs over 200k)
Taxable individual retirement arrangement distribution: $21,133 (reported on 11.0% of returns)
40383:
$21,133
Kentucky:
$18,941
(% of AGI for various income ranges: 73.7% for AGIs below $25k, 130.6% for AGIs $25k-50k, 305.2% for AGIs $50k-75k, 532.6% for AGIs $75k-100k, 797.8% for AGIs $100k-200k, 4369.4% for AGIs over 200k)
Self-employed (Keogh) retirement plans: $15,371 (reported on 0.6% of returns)
40383:
$15,371
Kentucky:
$23,933
(% of AGI for various income ranges: 39.4% for AGIs $100k-200k, 406.2% for AGIs over 200k)
Total itemized deductions: $33,540 (reported on 8.9% of returns)
Here:
$33,540
State:
$32,473
(% of AGI for various income ranges: 47.5% for AGIs below $25k, 119.7% for AGIs $25k-50k, 259.9% for AGIs $50k-75k, 537.1% for AGIs $75k-100k, 1053.1% for AGIs $100k-200k, 8231.9% for AGIs over 200k)
Charity contributions: $14,111 (reported on 7.6% of returns)
Here:
$14,111
State:
$13,472
(% of AGI for various income ranges: 4.2% for AGIs below $25k, 20.7% for AGIs $25k-50k, 63.9% for AGIs $50k-75k, 129.0% for AGIs $75k-100k, 330.2% for AGIs $100k-200k, 4269.4% for AGIs over 200k)
Taxes paid: $7,955 (reported on 8.8% of returns)
40383:
$7,955
State:
$7,830
(% of AGI for various income ranges: 6.6% for AGIs below $25k, 17.6% for AGIs $25k-50k, 66.3% for AGIs $50k-75k, 144.7% for AGIs $75k-100k, 314.6% for AGIs $100k-200k, 1562.5% for AGIs over 200k)
Earned income credit: $2,175 (reported on 13.1% of returns)
Here:
$2,175
State:
$2,336
(% of AGI for various income ranges: 86.9% for AGIs below $25k, 62.4% for AGIs $25k-50k, 1.2% for AGIs $50k-75k)
Percentage of individuals using paid preparers for their 2020 taxes: 91.8%
Here:
92%
State:
94%
(% for various income ranges: 90.3% for AGIs below $25k, 92.4% for AGIs $25k-50k, 91.5% for AGIs $50k-75k, 91.5% for AGIs $75k-100k, 92.6% for AGIs $100k-200k, 96.6% for AGIs over 200k)
Averages for the 2012 tax year for zip code 40383, filed in 2013:
Average Adjusted Gross Income (AGI) in 2012: $64,959 (Individual Income Tax Returns)
Here:
$64,959
State:
$50,814
Salary/wage: $50,693 (reported on 83.6% of returns)
Here:
$50,693
State:
$42,723
(% of AGI for various income ranges: 75.4% for AGIs below $25k, 76.9% for AGIs $25k-50k, 73.4% for AGIs $50k-75k, 74.1% for AGIs $75k-100k, 73.8% for AGIs $100k-200k, 41.0% for AGIs over 200k)
Taxable interest for individuals: $1,615 (reported on 35.9% of returns)
This zip code:
$1,615
Kentucky:
$1,381
(% of AGI for various income ranges: 1.3% for AGIs below $25k, 0.7% for AGIs $25k-50k, 0.9% for AGIs $50k-75k, 0.8% for AGIs $75k-100k, 0.8% for AGIs $100k-200k, 1.0% for AGIs over 200k)
Ordinary dividends: $4,850 (reported on 20.5% of returns)
Here:
$4,850
State:
$6,239
(% of AGI for various income ranges: 1.1% for AGIs below $25k, 1.1% for AGIs $25k-50k, 1.3% for AGIs $50k-75k, 1.3% for AGIs $75k-100k, 1.7% for AGIs $100k-200k, 1.9% for AGIs over 200k)
Net capital gain/loss in AGI: +$14,091 (reported on 16.8% of returns)
Here:
+$14,091
State:
+$11,336
(% of AGI for various income ranges: 0.5% for AGIs below $25k, 0.5% for AGIs $25k-50k, 1.0% for AGIs $50k-75k, 0.9% for AGIs $75k-100k, 2.3% for AGIs $100k-200k, 9.7% for AGIs over 200k)
Profit/loss from business: +$12,339 (reported on 16.3% of returns)
Here:
+$12,339
State:
+$10,862
(% of AGI for various income ranges: 7.7% for AGIs below $25k, 3.8% for AGIs $25k-50k, 2.5% for AGIs $50k-75k, 2.5% for AGIs $75k-100k, 2.6% for AGIs $100k-200k, 2.7% for AGIs over 200k)
Taxable individual retirement arrangement distribution: $15,221 (reported on 10.6% of returns)
40383:
$15,221
Kentucky:
$14,296
(% of AGI for various income ranges: 3.1% for AGIs below $25k, 2.7% for AGIs $25k-50k, 2.5% for AGIs $50k-75k, 3.0% for AGIs $75k-100k, 2.9% for AGIs $100k-200k, 1.6% for AGIs over 200k)
Self-employment retirement plans: $19,500 (reported on 0.7% of returns)
40383:
$19,500
Kentucky:
$20,768
Total itemized deductions: $22,922 (19% of AGI, reported on 38.9% of returns)
Here:
$22,922
State:
$21,160
Here:
19.1% of AGI
State:
20.0% of AGI
(% of AGI for various income ranges: 9.7% for AGIs below $25k, 11.1% for AGIs $25k-50k, 14.7% for AGIs $50k-75k, 15.4% for AGIs $75k-100k, 16.6% for AGIs $100k-200k, 11.9% for AGIs over 200k)
Charity contributions: $4,968 (reported on 32.3% of returns)
Here:
$4,968
State:
$4,303
(% of AGI for various income ranges: 0.9% for AGIs below $25k, 1.3% for AGIs $25k-50k, 2.2% for AGIs $50k-75k, 2.5% for AGIs $75k-100k, 3.1% for AGIs $100k-200k, 2.9% for AGIs over 200k)
Taxes paid: $9,730 (reported on 38.7% of returns)
40383:
$9,730
State:
$8,496
(% of AGI for various income ranges: 1.6% for AGIs below $25k, 3.1% for AGIs $25k-50k, 4.7% for AGIs $50k-75k, 6.2% for AGIs $75k-100k, 7.5% for AGIs $100k-200k, 6.7% for AGIs over 200k)
Earned income credit: $2,150 (reported on 15.7% of returns)
Here:
$2,150
State:
$2,273
(% of AGI for various income ranges: 5.5% for AGIs below $25k, 1.1% for AGIs $25k-50k)
Percentage of individuals using paid preparers for their 2012 taxes: 58.9%
Here:
59%
State:
60%
(% for various income ranges: 54.4% for AGIs below $25k, 62.0% for AGIs $25k-50k, 60.8% for AGIs $50k-75k, 56.6% for AGIs $75k-100k, 60.7% for AGIs $100k-200k, 80.0% for AGIs over 200k)
Averages for the 2004 tax year for zip code 40383, filed in 2005:
Average Adjusted Gross Income (AGI) in 2004: $50,483 (Individual Income Tax Returns)
Here:
$50,483
State:
$41,540
Salary/wage: $43,778 (reported on 85.2% of returns)
Here:
$43,778
State:
$36,432
(% of AGI for various income ranges: 77.0% for AGIs $10k-25k, 80.4% for AGIs $25k-50k, 79.9% for AGIs $50k-75k, 80.7% for AGIs $75k-100k, 59.3% for AGIs over 100k)
Taxable interest for individuals: $1,820 (reported on 48.2% of returns)
This zip code:
$1,820
Kentucky:
$1,571
(% of AGI for various income ranges: 2.7% for AGIs $10k-25k, 1.4% for AGIs $25k-50k, 1.1% for AGIs $50k-75k, 1.3% for AGIs $75k-100k, 1.8% for AGIs over 100k)
Taxable dividends: $3,201 (reported on 24.1% of returns)
Here:
$3,201
State:
$3,453
(% of AGI for various income ranges: 1.1% for AGIs $10k-25k, 0.8% for AGIs $25k-50k, 0.9% for AGIs $50k-75k, 1.2% for AGIs $75k-100k, 2.1% for AGIs over 100k)
Net capital gain/loss: +$17,434 (reported on 19.7% of returns)
Here:
+$17,434
State:
+$9,663
(% of AGI for various income ranges: 1.2% for AGIs $10k-25k, 0.7% for AGIs $25k-50k, 1.0% for AGIs $50k-75k, 2.1% for AGIs $75k-100k, 14.2% for AGIs over 100k)
Profit/loss from business: +$11,705 (reported on 17.6% of returns)
Here:
+$11,705
State:
+$9,233
(% of AGI for various income ranges: 5.0% for AGIs $10k-25k, 3.4% for AGIs $25k-50k, 3.5% for AGIs $50k-75k, 2.4% for AGIs $75k-100k, 4.8% for AGIs over 100k)
IRA payment deduction: $3,265 (reported on 2.5% of returns)
40383:
$3,265
Kentucky:
$2,955
(% of AGI for various income ranges: 0.3% for AGIs $10k-25k, 0.3% for AGIs $25k-50k, 0.2% for AGIs $50k-75k, 0.1% for AGIs $75k-100k, 0.1% for AGIs over 100k)
Self-employed pension: $13,650 (reported on 1.1% of returns)
Here:
$13,650
Kentucky:
$14,996
(% of AGI for various income ranges: 0.2% for AGIs $10k-25k, 0.1% for AGIs $50k-75k, 0.1% for AGIs $75k-100k, 0.6% for AGIs over 100k)
Total itemized deductions: $18,499 (21% of AGI, reported on 42.4% of returns)
Here:
$18,499
State:
$17,474
Here:
20.8% of AGI
State:
21.0% of AGI
(% of AGI for various income ranges: 10.4% for AGIs $10k-25k, 13.6% for AGIs $25k-50k, 16.5% for AGIs $50k-75k, 18.1% for AGIs $75k-100k, 14.9% for AGIs over 100k)
Charity contributions deductions: $3,668 (4% of AGI, reported on 36.8% of returns)
Here:
$3,668
State:
$3,494
Here:
3.9% of AGI
State:
4.0% of AGI
(% of AGI for various income ranges: 1.3% for AGIs $10k-25k, 1.8% for AGIs $25k-50k, 2.4% for AGIs $50k-75k, 2.8% for AGIs $75k-100k, 3.3% for AGIs over 100k)
Total tax: $7,701 (reported on 78.2% of returns)
40383:
$7,701
State:
$6,162
(% of AGI for various income ranges: 4.4% for AGIs $10k-25k, 6.9% for AGIs $25k-50k, 8.7% for AGIs $50k-75k, 10.1% for AGIs $75k-100k, 17.3% for AGIs over 100k)
Earned income credit: $1,626 (reported on 12.5% of returns)
Here:
$1,626
State:
$1,723
Percentage of individuals using paid preparers for their 2004 taxes: 61.9%
Here:
62%
State:
66%
(% for various income ranges: 55.0% for AGIs below $10k, 65.5% for AGIs $10k-25k, 65.3% for AGIs $25k-50k, 61.3% for AGIs $50k-75k, 56.9% for AGIs $75k-100k, 65.1% for AGIs over 100k)
Likely homosexual households (counted as self-reported same-sex unmarried-partner households)
Lesbian couples: 0.1% of all households
Gay men: 0.1% of all households
Household received Food Stamps/SNAP in the past 12 months: 678 Household did not receive Food Stamps/SNAP in the past 12 months: 9,092
Women who had a birth in the past 12 months: 240 (188 now married, 49 unmarried) Women who did not have a birth in the past 12 months: 5,025 (2,432 now married, 2,596 unmarried)
Housing units in zip code 40383 with a mortgage: 4,230 (613 second mortgage, 573 both second mortgage and home equity loan) Houses without a mortgage: 199
Median monthly owner costs for units with a mortgage: $1,539 Median monthly owner costs for units without a mortgage: $542
Residents with income below the poverty level in 2022:
This zip code:
8.2%
Whole state:
16.5%
Residents with income below 50% of the poverty level in 2022:
This zip code:
4.2%
Whole state:
9.0%
Median number of rooms in houses and condos:
Here:
6.9
State:
6.4
Median number of rooms in apartments:
Here:
4.8
State:
4.4
Notable locations in this zip code not listed on our city pages
Notable locations in zip code 40383: Camp Otonk (A), Camp Cedarwood (B), Jesse (C), Cabin Brook Golf Course (D), Woodford Hills Country Club (E), Big Poplar Tree (F), Brookies Crossroad (G), Three Chimneys Farm (H), The Glen (I), Woodford County Fire Department Station 3 (J), Woodford County Fire Department Station 5 (K), Versailles Fire Department Station 2 (L), Woodford County Fire Department Station 1 (M), Versailles Fire Station 3 (N), Woodford County Ambulance Service (O), Versailles Fire Department Station 1 (P). Display/hide their locations on the map
Churches in zip code 40383 include: Fintville Church (A), Glenns Creek Church (B), Griers Creek Church (C), Hillsborough Church (D), Mount Edwin Church (E), Old Union Church (F), Clear Creek Church (G), Clover Bottom Church (H). Display/hide their locations on the map
Cemeteries: Mount Vernon Church Cemetery (1), Pisgah Cemetery (2), The Polk Memorial Church Cemetery (3), Weeping Willow Cemetery (4), Steele Cemetery (5), Allen Cemetery (6), Ebenezer Cemetery (7). Display/hide their locations on the map
Lakes and reservoirs: Clifton Road Lake (A), Cooke Lake (B), Sportsman Club Lake (C), Matthews Lake (D), Sycamore Lake (E), Glen Lake (F). Display/hide their locations on the map
Streams, rivers, and creeks: Griers Creek (A), Craig Creek (B), Clear Creek (C), Cave Spring Creek (D), Tanners Creek (E), Camden Creek (F), Steeles Run (G), Buck Run (H), Brushy Run (I). Display/hide their locations on the map
3,692 married couples with children.
1,220 single-parent households (103 men, 1,117 women).
93.9% of residents of 40383 zip code speak English at home.
4.7% of residents speak Spanish at home (47% very well, 12% well, 38% not well, 4% not at all).
1.0% of residents speak other Indo-European language at home (60% very well, 39% well, 1% not well).
0.1% of residents speak Asian or Pacific Island language at home (60% very well, 40% well).
0.3% of residents speak other language at home (98% very well, 2% not well).
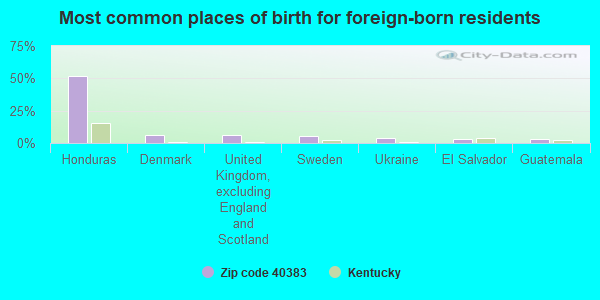
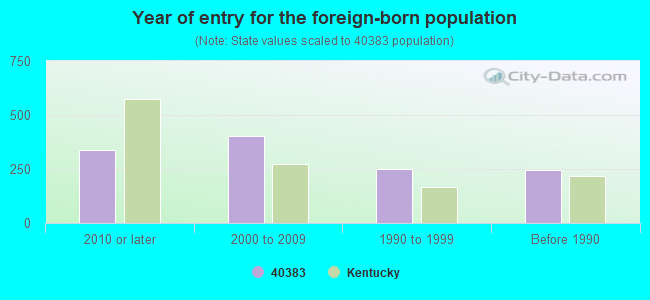
Foreign born population: 1,105 (4.5%) (24.6% of them are naturalized citizens)
This zip code:
4.5%
Whole state:
4.0%
52%Honduras
6%Denmark
6%United Kingdom, excluding England and Scotland
6%Sweden
4%Ukraine
3%El Salvador
3%Guatemala
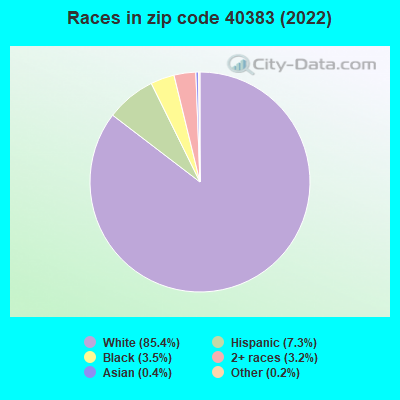
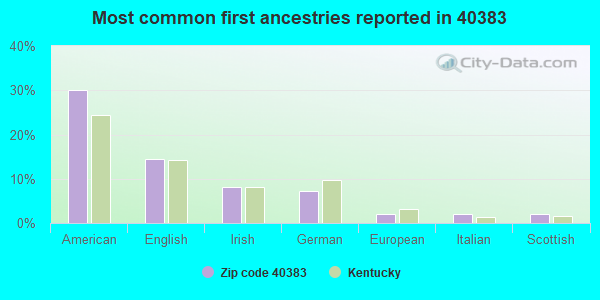
30%American
14%English
8%Irish
7%German
2%European
2%Italian
2%Scottish
Year of entry for the foreign-born population
3372010 or later
4012000 to 2009
2511990 to 1999
244Before 1990
Major facilities with environmental interests located in this zip code:
OSRAM SYLVANIA INCORPORATED (1000 TYRONE PIKE in VERSAILLES, KY)
AIR MAJOR (AIRS/AFS) CRITERIA AND HAZARDOUS AIR POLLUTANT INVENTORY (Inventory of air pollution sources) National Pollutant Discharge Elimination System NON-MAJOR (Tracking pollutant discharge elimination systems) - permit National Pollutant Discharge Elimination System NON-MAJOR (Tracking pollutant discharge elimination systems) - permit National Pollutant Discharge Elimination System NON-MAJOR (Tracking pollutant discharge elimination systems) - permit HAZARDOUS WASTE BIENNIAL REPORTER (Resource Conservation and Recovery Act (tracking hazardous waste)) Large Quantity Generators, more that 1000 kg of hazardous waste/month (Resource Conservation and Recovery Act (tracking hazardous waste)) - notification TSD (Resource Conservation and Recovery Act (tracking hazardous waste)) - notification TRI REPORTER (Tracking of toxic chemicals releasing facilities) Business SIC classification: EXCAVATION WORK; PRESSED AND BLOWN GLASS AND GLASSWARE; MANAGEMENT SERVICES Business NAICS classification: OTHER PRESSED AND BLOWN GLASS AND GLASSWARE MANUFACTURING.; OTHER PRESSED AND BLOWN GLASS AND GLASSWARE MANUFACTURING. Organizations: OSRAM SYLVANIA PRODUCTS INC (CONTACT/OPERATOR)
, OSRAM SYLVANIA PRODUCTS INC (CONTACT/OWNER)
Alternative names: OSRAM SYLVANIA PRODUCTS INC, OSRAM SYLVANIA PRODUCTS INC
OSRAM SYLVANIA (900 TYRONE PIKE in VERSAILLES, KY)
AIR MAJOR (AIRS/AFS) COMPLIANCE ACTIVITY (Tracking inspections of insecticide, fungicide, and rodenticide, and toxic substances) CRITERIA AND HAZARDOUS AIR POLLUTANT INVENTORY (Inventory of air pollution sources) National Pollutant Discharge Elimination System NON-MAJOR (Tracking pollutant discharge elimination systems) - permit HAZARDOUS WASTE BIENNIAL REPORTER (Resource Conservation and Recovery Act (tracking hazardous waste)) Large Quantity Generators, more that 1000 kg of hazardous waste/month (Resource Conservation and Recovery Act (tracking hazardous waste)) - notification TRI REPORTER (Tracking of toxic chemicals releasing facilities) Business SIC classification: PRESSED AND BLOWN GLASS AND GLASSWARE; ELECTRIC LAMP BULBS AND TUBES Business NAICS classification: ELECTRIC LAMP BULB AND PART MANUFACTURING. Organizations: OSRAM SYLVANIA INC LAMP PLANT (CONTACT/OWNER)
, OSRAM SYLVANIA PRODUCTS INC (CONTACT/OWNER)
Alternative names: OSRAM SYLVANIA INC LAMP PLANT, OSRAM SYLVANIA INC, OSRAM SYLVANIA PRODS. INC., OSRAM SYLVANIA PRODUCTS INC
OLSON GAS CO (411 LEXINGTON RD in VERSAILLES, KY)
(Integrated Compliance Information System) - ICIS-04-2001-2009, FORMAL ENFORCEMENT ACTION (Resource Conservation and Recovery Act (tracking hazardous waste)) Business SIC classification: PETROLEUM AND PETROLEUM PRODUCTS WHOLESALERS, EXCEPT BULK STATIONS AND TERMINALS Organizations: JAMES E OLSON (CONTACT/OWNER)
KUHLMAN CORPORATION DISTRIBUTION TRANSFORMER DIVISION (101 KUHLMAN BLVD. in VERSAILLES, KY)
COMPLIANCE ACTIVITY (Tracking inspections of insecticide, fungicide, and rodenticide, and toxic substances) CRITERIA AND HAZARDOUS AIR POLLUTANT INVENTORY (Inventory of air pollution sources) National Pollutant Discharge Elimination System NON-MAJOR (Tracking pollutant discharge elimination systems) - permit Small Quantity Generators, between 100 kg and 1000 kg of hazardous waste/month (Resource Conservation and Recovery Act (tracking hazardous waste)) - notification TRI REPORTER (Tracking of toxic chemicals releasing facilities) Business SIC classification: POWER, DISTRIBUTION, AND SPECIALTY TRANSFORMERS Business NAICS classification: POWER, DISTRIBUTION, AND SPECIALTY TRANSFORMER MANUFACTURING.; POWER, DISTRIBUTION, AND SPECIALTY TRANSFORMER MANUFACTURING. Organizations: KUHLMAN ELECTRIC CORP (CONTACT/OWNER)
Alternative names: KUHLMAN CORP TRANSFORMER DIV., KUHLMAN ELECTRIC CORP
LABROT & GRAHAM DISTILLERS CO (7855 MCCRACKEN PIKE in VERSAILLES, KY)
National Pollutant Discharge Elimination System NON-MAJOR (Tracking pollutant discharge elimination systems) - permit National Pollutant Discharge Elimination System NON-MAJOR (Tracking pollutant discharge elimination systems) - permit Business SIC classification: DISTILLED AND BLENDED LIQUORS Organizations: LABROT & GRAHAM DISTILLERY CO (CONTACT/OWNER)
, THE WOODFORD RESERVE DISTILLRY (CONTACT/OWNER)
Alternative names: LABROT & GRAHAM DISTILLERY CO, THE WOODFORD RESERVE DISTILLRY
ASHLAND BRANDED MARKETING #316-017 (503 LEXINGTON AVE in VERSAILLES, KY)
(Resource Conservation and Recovery Act (tracking hazardous waste)) Organizations: ASHLAND, INC. (CONTACT/OWNER)
ASHLAND BRANDED MARKETING #341-0330832 (3979 BIG SINK ROAD in VERSAILLES, KY)
(Resource Conservation and Recovery Act (tracking hazardous waste)) Organizations: ASHLAND BRANDED MARKETING INC. (CONTACT/OWNER)
ASHLAND SS #017 (MILLON LANE, ROUTE 2 in VERSAILLES, KY)
(Resource Conservation and Recovery Act (tracking hazardous waste)) Organizations: ASHLAND BRANDED MARKTING INC. (CONTACT/OWNER)
BENEDICT PROPERTY (6684 TROY PIKE in VERSAILLES, KY)
(Resource Conservation and Recovery Act (tracking hazardous waste)) Organizations: MARY BENEDICT (CONTACT/OWNER)
BIG O TIRES (197 FRANKFORT ST in VERSAILLES, KY)
(Resource Conservation and Recovery Act (tracking hazardous waste))
BIG SINK FARM (3979 BIG SINK ROAD in VERSAILLES, KY)
BP OIL STATION (200 LEXINGTON AVENUE in VERSAILLES, KY)
(Resource Conservation and Recovery Act (tracking hazardous waste)) Organizations: BP OIL COMPANY, INC. (CONTACT/OWNER)
BROOKDALE FARM (1905 FRANKFORT RD in VERSAILLES, KY)
(Resource Conservation and Recovery Act (tracking hazardous waste)) Organizations: FRED SEITZ (CONTACT/OWNER)
Housing units lacking complete plumbing facilities: 0.3% Housing units lacking complete kitchen facilities: 1.1%
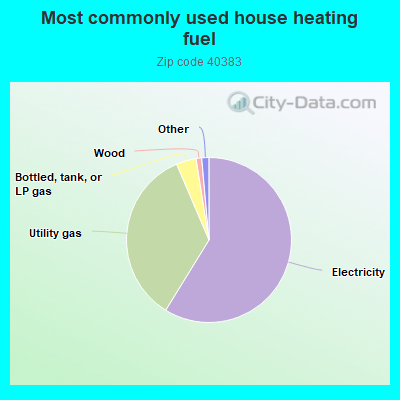
58.8%Electricity
34.8%Utility gas
3.9%Bottled, tank, or LP gas
1.1%Wood
0.6%Fuel oil, kerosene, etc.
0.5%No fuel used
Population in 1990: 18,204. Population change in the 1990s: +2,250 (+12.4%).
Place of birth for U.S.-born residents:
This state: 15,830
Northeast: 1,142
Midwest: 2,886
South: 2,259
West: 960
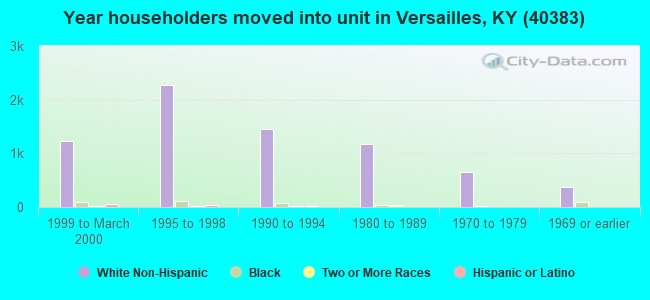
56% of the 40383 zip code residents lived in the same house 5 years ago. Out of people who lived in different houses, 42% lived in this county. Out of people who lived in different counties, 50% lived in Kentucky.
92% of the 40383 zip code residents lived in the same house 1 year ago. Out of people who lived in different houses, 35% moved from this county. Out of people who lived in different houses, 51% moved from different county within same state. Out of people who lived in different houses, 13% moved from different state. Out of people who lived in different houses, 3% moved from abroad.
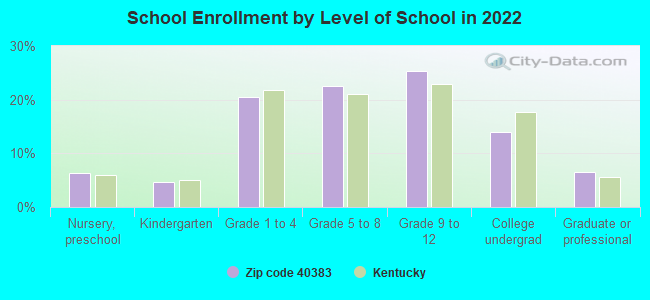
Private vs. public school enrollment:
Students in private schools in grades 1 to 8 (elementary and middle school): 410
Here:
18.7%
Kentucky:
17.2%
Students in private schools in grades 9 to 12 (high school): 236
Here:
18.2%
Kentucky:
15.2%
Students in private undergraduate colleges: 113
Here:
15.9%
Kentucky:
19.6%
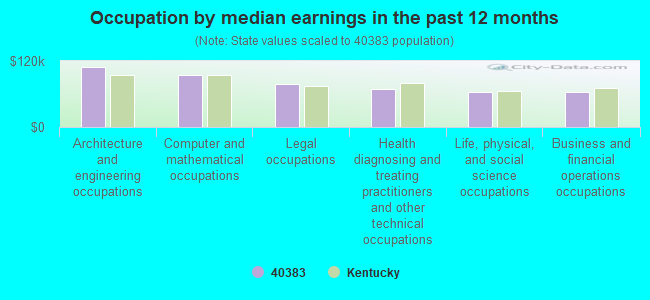
Occupation by median earnings in the past 12 months ($)
108,388Architecture and engineering occupations
95,453Computer and mathematical occupations
78,676Legal occupations
69,939Health diagnosing and treating practitioners and other technical occupations
63,437Life, physical, and social science occupations
62,979Business and financial operations occupations
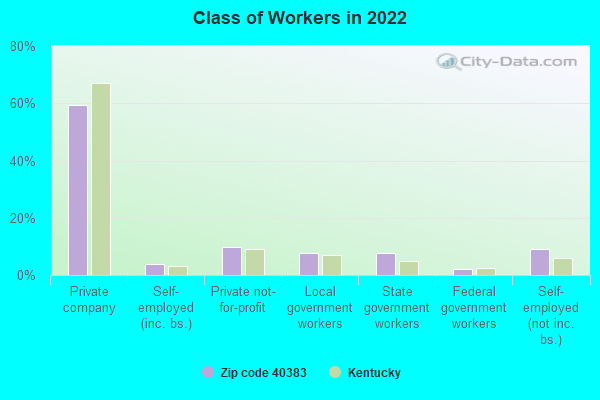
Companies with federal contracts located in this zip code (VERSAILLES, KY):
FOUSER ENVIRONMENTAL SERVICES (400 CROSSFIELD DRIVE; small business) : $112,513 in 7 contractsfrom 2002 to 2005
Contracts for Water Quality Support Services by Army Signed by year:2000: $0; 2001: $0; 2002: $28,996; 2003: $30,347; 2004: $31,534; 2005: $21,636; 2006: $0.
Biggest contracts:
$32,797 with Army for Water Quality Support Services. Signed on 2005-04-12. Completion date: 2006-03-31.
$31,534, same as above.Signed on 2004-03-09. Completion date: 2005-03-31.
$30,347, same as above.Signed on 2003-07-21. Completion date: 2004-04-01.
$28,996, same as above.Signed on 2002-06-07. Completion date: 2003-03-31.
H & A RESIDUALS & BIOSOLIDS MA (103 FIELDVIEW DR; small business) : $68,800 in 3 contractsfrom 2002 to 2003
$38,700 with Army for Waste Treatment and Storage. Signed on 2003-06-12. Completion date: 2003-07-03.
$30,100, same as above.Signed on 2003-04-17. Completion date: 2003-05-30.
$0, same as above.Signed on 2002-10-31. Completion date: 2004-01-17.
LEISURE CONCEPTS, LLC (210 GREY HAWK CT; small business)
$36,863 with Army for Recreational and Gymnastic Equipment. Signed on 2006-04-04. Completion date: 2006-03-08.
CLEARVIEW INVESTMENTS, INC (102 FIELDVIEW DRIVE; small business)
$25,437 with Army for Camouflage and Deception Equipment. Taking place in OK. Signed on 2003-09-09. Completion date: 2003-10-08.
ADVANCED TECHNOLOGY INC (102 FIELDVIEW DR STE 400; small business) 50 employees, $0 revenue.
$5,339 with Army for Accessories for Secondary Metalworking Machinery. Signed on 2004-03-17. Completion date: 2004-03-19.
THE LAWN BARBER II INC (2705 OREGON ROAD; small business) : $550 in 3 contractsfrom 2003 to 2004
$5,075 with Army for Landscaping/Groundskeeping Services. Signed on 2003-07-01. Completion date: 2004-06-30.
$0, same as above.Signed on 2003-07-01. Completion date: 2004-06-30.
-$4,525, same as above.Signed on 2004-04-29. Completion date: 2004-06-30.
Top industries in this zip code by the number of employees in 2005:
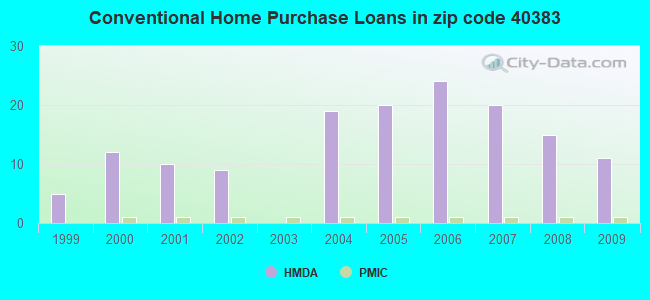
Detailed PMIC statistics for the following Tracts:0606.00
2002 - 2018 National Fire Incident Reporting System (NFIRS) incidents
Based on the data from the years 2002 - 2018 the average number of fire incidents per year is 53. The highest number of reported fire incidents - 97 took place in 2014, and the least - 0 in 2005. The data has a constant trend.
When looking into fire subcategories, the most incidents belonged to: Structure Fires (37.1%), and Outside Fires (27.0%).
Fire incident types reported to NFIRS in Zip Code 40383


 Nearest zip codes: 40339, 40513, 40347, 40510, 40390, 40372.


 Based on the data from the years 2002 - 2018 the average number of fire incidents per year is 53. The highest number of reported fire incidents - 97 took place in 2014, and the least - 0 in 2005. The data has a constant trend.
 When looking into fire subcategories, the most incidents belonged to: Structure Fires (37.1%), and Outside Fires (27.0%).