Estimated zip code population in 2022: 4,025 Zip code population in 2010: 3,321 Zip code population in 2000: 2,315
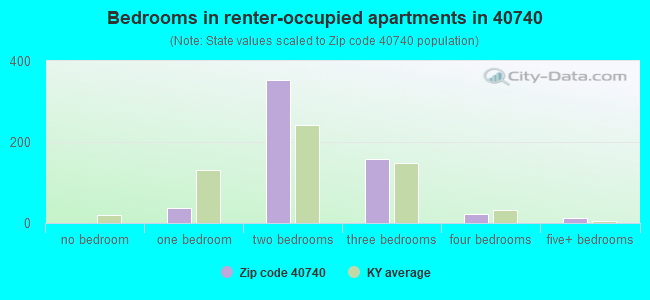
Houses and condos: 1,370 Renter-occupied apartments: 585
% of renters here:
43%
State:
31%
March 2022 cost of living index in zip code 40740: 81.0 (low, U.S. average is 100)
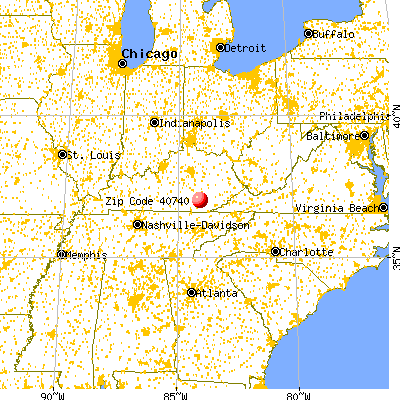
Land area: 16.3 sq. mi. Water area: 0.2 sq. mi.
Population density: 247 people per square mile
(very low).
OSM Map
General Map
Google Map
MSN Map
OSM Map
General Map
Google Map
MSN Map
OSM Map
General Map
Google Map
MSN Map
OSM Map
General Map
Google Map
MSN Map
Please wait while loading the map...
Real estate property taxes paid for housing units in 2022:
This zip code:
0.5% ($620)
Kentucky:
0.7% ($1,456)
Median real estate property taxes paid for housing units with mortgages in 2022: $885 (0.6%) Median real estate property taxes paid for housing units with no mortgage in 2022: $401 (0.3%)
Business Search- 14 Million verified businesses
Males: 1,968
(48.9%)
Females: 2,057
(51.1%)
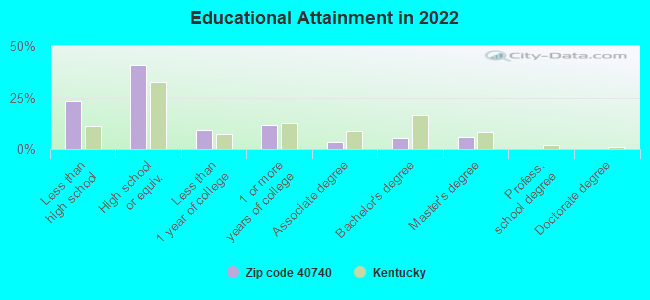
For population 25 years and over in 40740:
High school or higher: 75.0%
Bachelor's degree or higher: 11.4%
Graduate or professional degree: 6.1%
Unemployed: 1.7%
Mean travel time to work (commute): 22.7 minutes
For population 15 years and over in 40740:
Never married: 34.0%
Now married: 49.3%
Separated: 3.1%
Widowed: 5.4%
Divorced: 8.1%
Zip code 40740 compared to state average:
Unemployed percentage below state average.
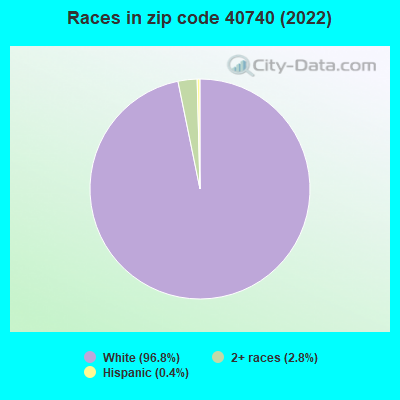
Black race population percentage significantly below state average.
Hispanic race population percentage significantly below state average.
Foreign-born population percentage significantly below state average.
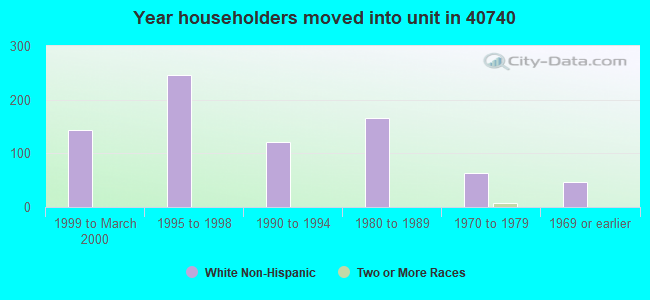
Length of stay since moving in significantly above state average.
House age below state average.
Percentage of population with a bachelor's degree or higher significantly below state average.
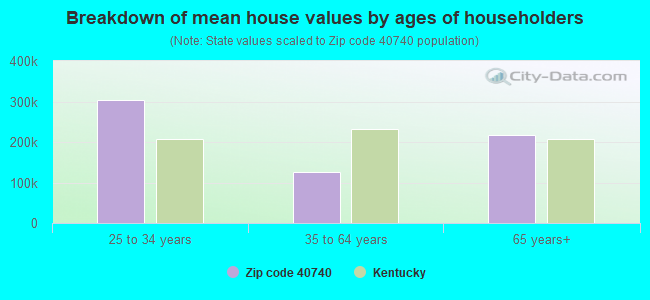
Estimated median house/condo value in 2022: $131,976
40740:
$131,976
Kentucky:
$196,300
According to our research of Kentucky and other state lists, there were 8 registered sex offenders living in 40740 zip code as of April 25, 2024. The ratio of all residents to sex offenders in zip code 40740 is 412 to 1. The ratio of registered sex offenders to all residents in this zip code is near the state average.
Median resident age:
This zip code:
39.5 years
Kentucky median age:
39.4 years
Average household size:
This zip code:
2.9 people
Kentucky:
2.4 people
Averages for the 2020 tax year for zip code 40740, filed in 2021:
Average Adjusted Gross Income (AGI) in 2020: $38,669 (Individual Income Tax Returns)
Here:
$38,669
State:
$61,342
Salary/wage: $35,373 (reported on 86.4% of returns)
Here:
$35,373
State:
$50,827
(% of AGI for various income ranges: 1032.4% for AGIs below $25k, 3495.7% for AGIs $25k-50k, 6425.4% for AGIs $50k-75k, 9880.0% for AGIs $75k-100k, 13374.0% for AGIs $100k-200k)
Taxable interest for individuals: $243 (reported on 11.9% of returns)
This zip code:
$243
Kentucky:
$1,441
(% of AGI for various income ranges: 3.6% for AGIs below $25k, 3.6% for AGIs $25k-50k, 4.6% for AGIs $50k-75k, 6.0% for AGIs $100k-200k)
Ordinary dividends: $350 (reported on 1.7% of returns)
Here:
$350
State:
$7,388
(% of AGI for various income ranges: 1.7% for AGIs below $25k)
Net capital gain/loss in AGI: +$800 (reported on 2.5% of returns)
Here:
+$800
State:
+$19,475
(% of AGI for various income ranges: 8.6% for AGIs $25k-50k)
Profit/loss from business: +$6,706 (reported on 14.4% of returns)
Here:
+$6,706
State:
+$11,386
(% of AGI for various income ranges: 133.6% for AGIs below $25k, 84.6% for AGIs $25k-50k, 215.4% for AGIs $50k-75k, 88.6% for AGIs $75k-100k)
Taxable individual retirement arrangement distribution: $14,767 (reported on 2.5% of returns)
40740:
$14,767
Kentucky:
$18,941
(% of AGI for various income ranges: 158.2% for AGIs $25k-50k)
Taxes paid: $5,600 (reported on 1.7% of returns)
40740:
$5,600
State:
$7,830
(% of AGI for various income ranges: 26.7% for AGIs below $25k)
Earned income credit: $2,783 (reported on 30.5% of returns)
Here:
$2,783
State:
$2,336
(% of AGI for various income ranges: 159.0% for AGIs below $25k, 119.3% for AGIs $25k-50k)
Percentage of individuals using paid preparers for their 2020 taxes: 97.5%
Here:
97%
State:
94%
(% for various income ranges: 98.0% for AGIs below $25k, 97.1% for AGIs $25k-50k, 94.1% for AGIs $50k-75k, 100.0% for AGIs $75k-100k, 100.0% for AGIs $100k-200k)
Averages for the 2012 tax year for zip code 40740, filed in 2013:
Average Adjusted Gross Income (AGI) in 2012: $32,454 (Individual Income Tax Returns)
Here:
$32,454
State:
$50,814
Salary/wage: $30,747 (reported on 88.7% of returns)
Here:
$30,747
State:
$42,723
(% of AGI for various income ranges: 72.1% for AGIs below $25k, 86.2% for AGIs $25k-50k, 88.0% for AGIs $50k-75k, 87.3% for AGIs $75k-100k, 85.7% for AGIs $100k-200k)
Taxable interest for individuals: $250 (reported on 12.2% of returns)
This zip code:
$250
Kentucky:
$1,381
(% of AGI for various income ranges: 0.2% for AGIs below $25k, 0.1% for AGIs $25k-50k, 0.1% for AGIs $50k-75k)
Ordinary dividends: $200 (reported on 3.5% of returns)
Here:
$200
State:
$6,239
Net capital gain/loss in AGI: +$33 (reported on 2.6% of returns)
Here:
+$33
State:
+$11,336
Profit/loss from business: +$7,406 (reported on 15.7% of returns)
Here:
+$7,406
State:
+$10,862
(% of AGI for various income ranges: 13.9% for AGIs below $25k, 1.7% for AGIs $25k-50k, 1.2% for AGIs $50k-75k)
Taxable individual retirement arrangement distribution: $11,367 (reported on 2.6% of returns)
40740:
$11,367
Kentucky:
$14,296
Total itemized deductions: $16,012 (26% of AGI, reported on 14.8% of returns)
Here:
$16,012
State:
$21,160
Here:
25.8% of AGI
State:
20.0% of AGI
(% of AGI for various income ranges: 4.0% for AGIs below $25k, 4.8% for AGIs $25k-50k, 8.4% for AGIs $50k-75k, 10.9% for AGIs $75k-100k, 13.0% for AGIs $100k-200k)
Charity contributions: $2,900 (reported on 11.3% of returns)
Here:
$2,900
State:
$4,303
(% of AGI for various income ranges: 0.9% for AGIs $25k-50k, 1.2% for AGIs $50k-75k, 1.5% for AGIs $75k-100k, 2.2% for AGIs $100k-200k)
Taxes paid: $4,476 (reported on 14.8% of returns)
40740:
$4,476
State:
$8,496
(% of AGI for various income ranges: 0.6% for AGIs below $25k, 1.1% for AGIs $25k-50k, 2.0% for AGIs $50k-75k, 3.9% for AGIs $75k-100k, 5.5% for AGIs $100k-200k)
Earned income credit: $2,588 (reported on 37.4% of returns)
Here:
$2,588
State:
$2,273
(% of AGI for various income ranges: 11.9% for AGIs below $25k, 2.2% for AGIs $25k-50k)
Percentage of individuals using paid preparers for their 2012 taxes: 70.4%
Here:
70%
State:
60%
(% for various income ranges: 67.8% for AGIs below $25k, 70.0% for AGIs $25k-50k, 82.4% for AGIs $50k-75k, 100.0% for AGIs $75k-100k)
Averages for the 2004 tax year for zip code 40740, filed in 2005:
Average Adjusted Gross Income (AGI) in 2004: $26,500 (Individual Income Tax Returns)
Here:
$26,500
State:
$41,540
Salary/wage: $26,339 (reported on 88.3% of returns)
Here:
$26,339
State:
$36,432
(% of AGI for various income ranges: 81.0% for AGIs below $10k, 79.3% for AGIs $10k-25k, 88.6% for AGIs $25k-50k, 94.3% for AGIs $50k-75k, 87.3% for AGIs $75k-100k)
Taxable interest for individuals: $327 (reported on 22.1% of returns)
This zip code:
$327
Kentucky:
$1,571
(% of AGI for various income ranges: 1.9% for AGIs below $10k, 0.5% for AGIs $10k-25k, 0.1% for AGIs $25k-50k, 0.1% for AGIs $50k-75k, 0.1% for AGIs $75k-100k)
Taxable dividends: $132 (reported on 3.4% of returns)
Here:
$132
State:
$3,453
Net capital gain/loss: +$382 (reported on 3.1% of returns)
Here:
+$382
State:
+$9,663
Profit/loss from business: +$5,312 (reported on 15.3% of returns)
Here:
+$5,312
State:
+$9,233
(% of AGI for various income ranges: 13.7% for AGIs below $10k, 7.1% for AGIs $10k-25k, 3.2% for AGIs $25k-50k, -0.7% for AGIs $50k-75k)
Total itemized deductions: $13,468 (25% of AGI, reported on 13.9% of returns)
Here:
$13,468
State:
$17,474
Here:
25.2% of AGI
State:
21.0% of AGI
(% of AGI for various income ranges: 3.2% for AGIs $10k-25k, 6.3% for AGIs $25k-50k, 9.9% for AGIs $50k-75k, 12.2% for AGIs $75k-100k)
Charity contributions deductions: $2,146 (4% of AGI, reported on 9.3% of returns)
Here:
$2,146
State:
$3,494
Here:
3.8% of AGI
State:
4.0% of AGI
Total tax: $2,469 (reported on 64.3% of returns)
40740:
$2,469
State:
$6,162
(% of AGI for various income ranges: 2.9% for AGIs below $10k, 3.6% for AGIs $10k-25k, 5.0% for AGIs $25k-50k, 7.7% for AGIs $50k-75k, 10.7% for AGIs $75k-100k)
Earned income credit: $1,875 (reported on 32.4% of returns)
Here:
$1,875
State:
$1,723
Percentage of individuals using paid preparers for their 2004 taxes: 72.9%
Here:
73%
State:
66%
(% for various income ranges: 70.0% for AGIs below $10k, 72.9% for AGIs $10k-25k, 77.0% for AGIs $25k-50k, 68.2% for AGIs $50k-75k, 76.3% for AGIs $75k-100k)
Household received Food Stamps/SNAP in the past 12 months: 349 Household did not receive Food Stamps/SNAP in the past 12 months: 1,019
Women who had a birth in the past 12 months: 45 (44 now married, 0 unmarried) Women who did not have a birth in the past 12 months: 1,016 (460 now married, 556 unmarried)
Housing units in zip code 40740 with a mortgage: 410 (12 second mortgage, 10 both second mortgage and home equity loan) Median monthly owner costs for units with a mortgage: $926 Median monthly owner costs for units without a mortgage: $374
Residents with income below the poverty level in 2022:
This zip code:
25.7%
Whole state:
16.5%
Residents with income below 50% of the poverty level in 2022:
This zip code:
11.3%
Whole state:
9.0%
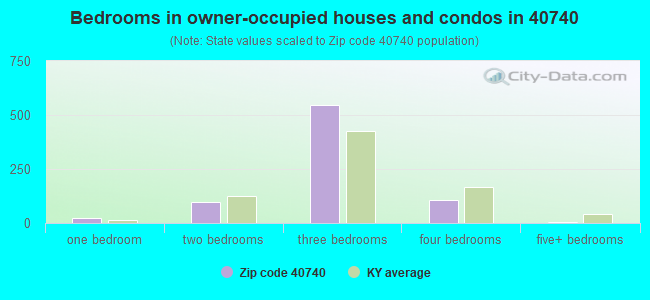
Median number of rooms in houses and condos:
Here:
5.5
State:
6.4
Median number of rooms in apartments:
Here:
4.6
State:
4.4
Notable locations in this zip code not listed on our city pages
In group quarters: 4 (-1 institutionalized population)
Size of family households: 350 2-persons, 284 3-persons, 245 4-persons, 59 5-persons, 65 6-persons, 33 7-or-more-persons
Size of nonfamily households: 209 1-person, 112 2-persons
556 married couples with children.
202 single-parent households (77 men, 125 women).
98.2% of residents of 40740 zip code speak English at home.
1.1% of residents speak Spanish at home (100% very well).
0.1% of residents speak other Indo-European language at home (100% very well).
Foreign born population: 5 (0.1%) (100.0% of them are naturalized citizens)
This zip code:
0.1%
Whole state:
4.0%
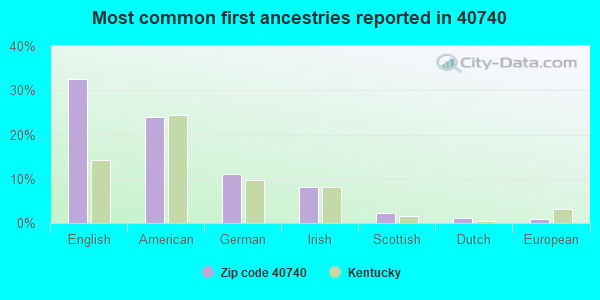
33%English
24%American
11%German
8%Irish
2%Scottish
1%Dutch
1%European
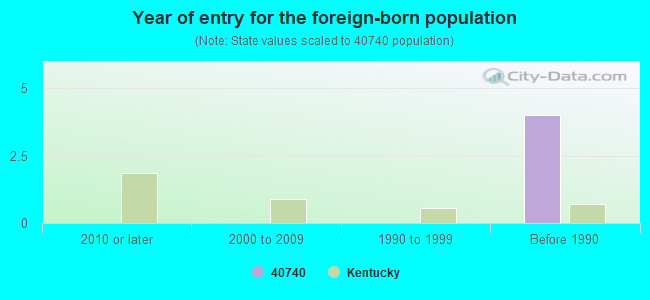
Year of entry for the foreign-born population
02010 or later
02000 to 2009
01990 to 1999
4Before 1990
Facilities with environmental interests located in this zip code:
SUPERFUND (Superfund database) CRITERIA AND HAZARDOUS AIR POLLUTANT INVENTORY (Inventory of air pollution sources) National Pollutant Discharge Elimination System NON-MAJOR (Tracking pollutant discharge elimination systems) - permit National Pollutant Discharge Elimination System NON-MAJOR (Tracking pollutant discharge elimination systems) - permit Business SIC classification: LOCAL TRUCKING WITHOUT STORAGE; REFUSE SYSTEMS Business NAICS classification: SOLID WASTE LANDFILL. Organizations: LAUREL RIDGE LANDFILL INC (CONTACT/OWNER)
CENTRAL KY MIXED CONCRETE INC (151 ECHO VALLEY RD in LILY, KY)
National Pollutant Discharge Elimination System NON-MAJOR (Tracking pollutant discharge elimination systems) - permit Business SIC classification: READY-MIXED CONCRETE
CORNERSTONE CHRISTIAN SCHOOL (420 LILY SCHOOL RD in LILY, KY)
National Pollutant Discharge Elimination System NON-MAJOR (Tracking pollutant discharge elimination systems) - permit Business SIC classification: RELIGIOUS ORGANIZATIONS
PATTERSON CHIP CO (HWY 25 in LILY, KY)
National Pollutant Discharge Elimination System NON-MAJOR (Tracking pollutant discharge elimination systems) - permit Business SIC classification: WOOD PRODUCTS
Housing units lacking complete plumbing facilities: 2.0% Housing units lacking complete kitchen facilities: 2.0%
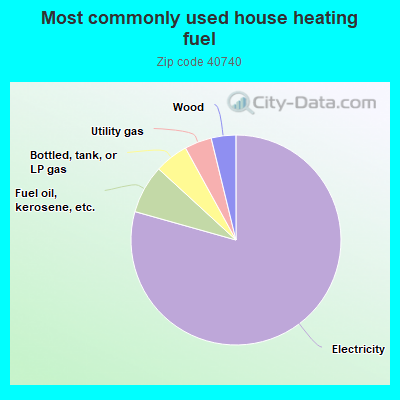
79.6%Electricity
7.5%Fuel oil, kerosene, etc.
5.2%Bottled, tank, or LP gas
4.2%Utility gas
3.8%Wood
Population in 1990: 7,471.
Place of birth for U.S.-born residents:
This state: 3,312
Northeast: 55
Midwest: 446
South: 149
West: 28
60% of the 40740 zip code residents lived in the same house 5 years ago. Out of people who lived in different houses, 62% lived in this county. Out of people who lived in different counties, 50% lived in Kentucky.
94% of the 40740 zip code residents lived in the same house 1 year ago. Out of people who lived in different houses, 33% moved from this county. Out of people who lived in different houses, 30% moved from different county within same state. Out of people who lived in different houses, 50% moved from abroad.
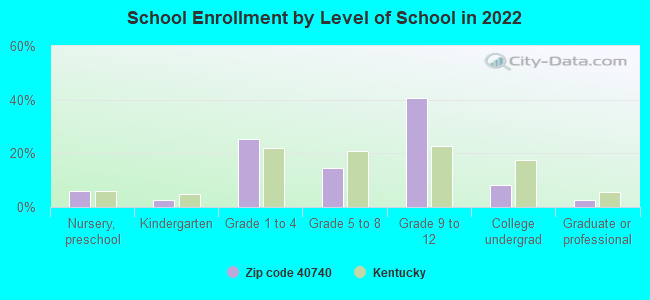
Private vs. public school enrollment:
Students in private schools in grades 1 to 8 (elementary and middle school): 92
Here:
21.7%
Kentucky:
17.2%
Students in private schools in grades 9 to 12 (high school): 11
Here:
2.7%
Kentucky:
15.2%
Students in private undergraduate colleges: 26
Here:
29.7%
Kentucky:
19.6%
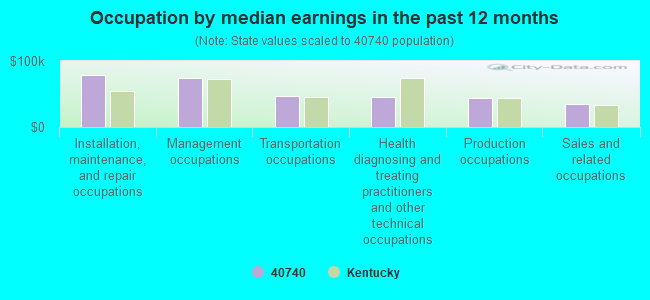
Occupation by median earnings in the past 12 months ($)
79,116Installation, maintenance, and repair occupations
74,502Management occupations
46,836Transportation occupations
46,061Health diagnosing and treating practitioners and other technical occupations
43,353Production occupations
34,568Sales and related occupations
Top industries in this zip code by the number of employees in 2005:
Administrative and Support and Waste Management and Remediation Services: Solid Waste Collection (100-249 employees: 1 establishment, 10-19 employees: 1 establishment, 5-9 employees: 1 establishment, 1-4 employees: 1 establishment)
Health Care and Social Assistance: Offices of Physicians (except Mental Health Specialists) (10-19: 1)
Construction: Plumbing, Heating, and Air-Conditioning Contractors (1-4: 1)
Utilities: Fossil Fuel Electric Power Generation (1-4: 1)
2003 - 2018 National Fire Incident Reporting System (NFIRS) incidents
According to the data from the years 2003 - 2018 the average number of fires per year is 8. The highest number of reported fire incidents - 18 took place in 2004, and the least - 0 in 2008. The data has a dropping trend.
When looking into fire subcategories, the most reports belonged to: Structure Fires (60.7%), and Outside Fires (27.9%).
Fire incident types reported to NFIRS in Zip Code 40740


 Nearest zip codes: 40744, 40743, 40737, 40734, 40741, 40701.
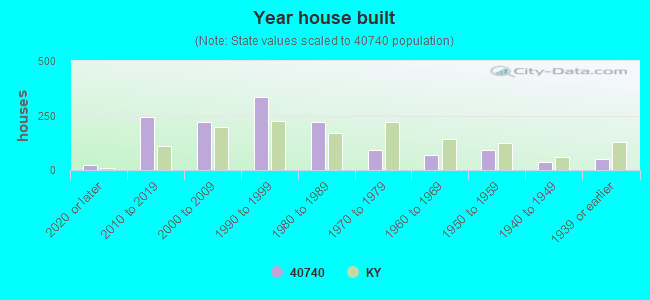


 According to the data from the years 2003 - 2018 the average number of fires per year is 8. The highest number of reported fire incidents - 18 took place in 2004, and the least - 0 in 2008. The data has a dropping trend.
 When looking into fire subcategories, the most reports belonged to: Structure Fires (60.7%), and Outside Fires (27.9%).