Estimated zip code population in 2022: 66,260 Zip code population in 2010: 58,424 Zip code population in 2000: 45,861
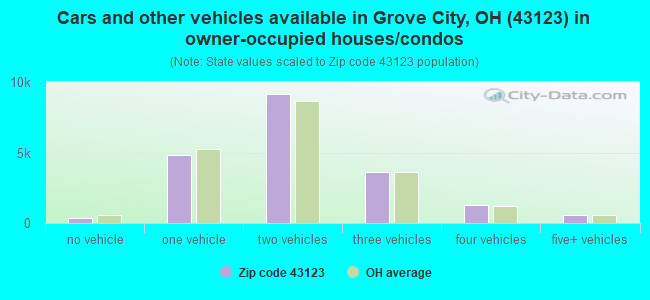
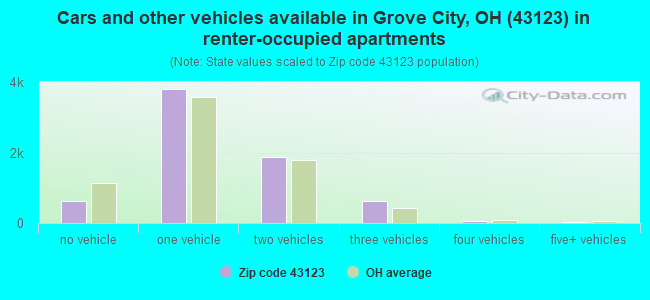
Houses and condos: 27,749 Renter-occupied apartments: 7,005
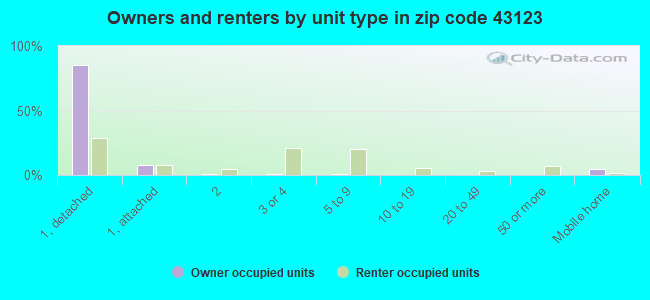
% of renters here:
26%
State:
33%
March 2022 cost of living index in zip code 43123: 95.6 (near average, U.S. average is 100)
Land area: 59.5 sq. mi. Water area: 0.7 sq. mi.
Population density: 1,113 people per square mile
(low).
OSM Map
General Map
Google Map
MSN Map
OSM Map
General Map
Google Map
MSN Map
OSM Map
General Map
Google Map
MSN Map
OSM Map
General Map
Google Map
MSN Map
Please wait while loading the map...
Real estate property taxes paid for housing units in 2022:
This zip code:
1.4% ($3,894)
Ohio:
1.3% ($2,639)
Median real estate property taxes paid for housing units with mortgages in 2022: $4,011 (1.4%) Median real estate property taxes paid for housing units with no mortgage in 2022: $3,606 (1.5%)
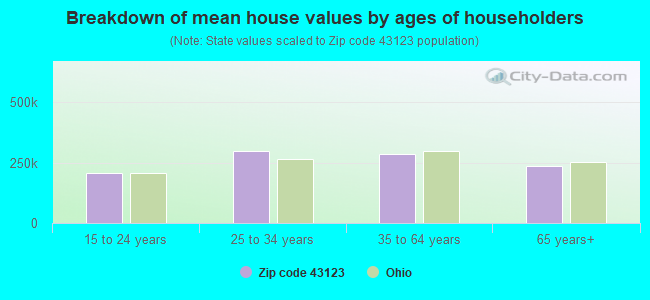
Estimated median house/condo value in 2022: $268,570
43123:
$268,570
Ohio:
$204,100
According to our research of Ohio and other state lists, there were 54 registered sex offenders living in 43123 zip code as of April 26, 2024. The ratio of all residents to sex offenders in zip code 43123 is 1,166 to 1. The ratio of registered sex offenders to all residents in this zip code is lower than the state average.
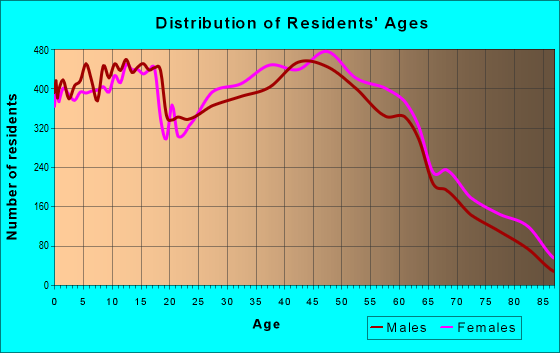
Median resident age:
This zip code:
40.6 years
Ohio median age:
39.9 years
Average household size:
This zip code:
2.5 people
Ohio:
2.4 people
Averages for the 2020 tax year for zip code 43123, filed in 2021:
Average Adjusted Gross Income (AGI) in 2020: $65,764 (Individual Income Tax Returns)
Here:
$65,764
State:
$67,288
Salary/wage: $58,803 (reported on 83.8% of returns)
Here:
$58,803
State:
$55,628
(% of AGI for various income ranges: 1115.1% for AGIs below $25k, 3547.3% for AGIs $25k-50k, 6380.5% for AGIs $50k-75k, 9624.1% for AGIs $75k-100k, 17897.3% for AGIs $100k-200k, 64053.7% for AGIs over 200k)
Taxable interest for individuals: $863 (reported on 24.2% of returns)
This zip code:
$863
Ohio:
$1,518
(% of AGI for various income ranges: 10.8% for AGIs below $25k, 11.8% for AGIs $25k-50k, 21.9% for AGIs $50k-75k, 28.5% for AGIs $75k-100k, 64.4% for AGIs $100k-200k, 489.4% for AGIs over 200k)
Ordinary dividends: $3,561 (reported on 15.6% of returns)
Here:
$3,561
State:
$7,167
(% of AGI for various income ranges: 14.9% for AGIs below $25k, 21.7% for AGIs $25k-50k, 48.2% for AGIs $50k-75k, 78.5% for AGIs $75k-100k, 157.0% for AGIs $100k-200k, 2020.6% for AGIs over 200k)
Net capital gain/loss in AGI: +$10,226 (reported on 13.7% of returns)
Here:
+$10,226
State:
+$18,919
(% of AGI for various income ranges: 7.7% for AGIs below $25k, 20.5% for AGIs $25k-50k, 44.2% for AGIs $50k-75k, 99.2% for AGIs $75k-100k, 379.7% for AGIs $100k-200k, 8223.1% for AGIs over 200k)
Profit/loss from business: +$12,707 (reported on 13.8% of returns)
Here:
+$12,707
State:
+$13,744
(% of AGI for various income ranges: 100.4% for AGIs below $25k, 127.7% for AGIs $25k-50k, 180.0% for AGIs $50k-75k, 204.9% for AGIs $75k-100k, 483.6% for AGIs $100k-200k, 4185.7% for AGIs over 200k)
Taxable individual retirement arrangement distribution: $17,733 (reported on 8.8% of returns)
43123:
$17,733
Ohio:
$18,876
(% of AGI for various income ranges: 61.1% for AGIs below $25k, 91.3% for AGIs $25k-50k, 188.6% for AGIs $50k-75k, 315.3% for AGIs $75k-100k, 529.0% for AGIs $100k-200k, 2459.4% for AGIs over 200k)
Self-employed (Keogh) retirement plans: $18,470 (reported on 0.3% of returns)
43123:
$18,470
Ohio:
$24,898
(% of AGI for various income ranges: 3.9% for AGIs $50k-75k, 14.6% for AGIs $100k-200k, 336.6% for AGIs over 200k)
Total itemized deductions: $26,515 (reported on 7.4% of returns)
Here:
$26,515
State:
$33,869
(% of AGI for various income ranges: 29.0% for AGIs below $25k, 80.2% for AGIs $25k-50k, 256.1% for AGIs $50k-75k, 396.3% for AGIs $75k-100k, 652.5% for AGIs $100k-200k, 4443.4% for AGIs over 200k)
Charity contributions: $8,937 (reported on 5.5% of returns)
Here:
$8,937
State:
$14,577
(% of AGI for various income ranges: 2.4% for AGIs below $25k, 11.3% for AGIs $25k-50k, 36.2% for AGIs $50k-75k, 66.3% for AGIs $75k-100k, 173.2% for AGIs $100k-200k, 1913.1% for AGIs over 200k)
Taxes paid: $7,627 (reported on 7.4% of returns)
43123:
$7,627
State:
$7,681
(% of AGI for various income ranges: 5.8% for AGIs below $25k, 18.3% for AGIs $25k-50k, 76.6% for AGIs $50k-75k, 134.1% for AGIs $75k-100k, 217.1% for AGIs $100k-200k, 941.1% for AGIs over 200k)
Earned income credit: $2,259 (reported on 11.7% of returns)
Here:
$2,259
State:
$2,304
(% of AGI for various income ranges: 76.1% for AGIs below $25k, 54.3% for AGIs $25k-50k, 1.0% for AGIs $50k-75k)
Percentage of individuals using paid preparers for their 2020 taxes: 94.2%
Here:
94%
State:
94%
(% for various income ranges: 92.8% for AGIs below $25k, 95.4% for AGIs $25k-50k, 94.2% for AGIs $50k-75k, 94.2% for AGIs $75k-100k, 94.3% for AGIs $100k-200k, 95.3% for AGIs over 200k)
Averages for the 2012 tax year for zip code 43123, filed in 2013:
Average Adjusted Gross Income (AGI) in 2012: $52,684 (Individual Income Tax Returns)
Here:
$52,684
State:
$54,926
Salary/wage: $47,797 (reported on 87.3% of returns)
Here:
$47,797
State:
$45,869
(% of AGI for various income ranges: 76.8% for AGIs below $25k, 81.2% for AGIs $25k-50k, 79.9% for AGIs $50k-75k, 81.3% for AGIs $75k-100k, 82.1% for AGIs $100k-200k, 60.7% for AGIs over 200k)
Taxable interest for individuals: $741 (reported on 27.3% of returns)
This zip code:
$741
Ohio:
$1,297
(% of AGI for various income ranges: 0.6% for AGIs below $25k, 0.3% for AGIs $25k-50k, 0.3% for AGIs $50k-75k, 0.2% for AGIs $75k-100k, 0.3% for AGIs $100k-200k, 0.9% for AGIs over 200k)
Ordinary dividends: $2,467 (reported on 15.3% of returns)
Here:
$2,467
State:
$5,821
(% of AGI for various income ranges: 0.7% for AGIs below $25k, 0.5% for AGIs $25k-50k, 0.6% for AGIs $50k-75k, 0.6% for AGIs $75k-100k, 0.7% for AGIs $100k-200k, 2.0% for AGIs over 200k)
Net capital gain/loss in AGI: +$5,021 (reported on 10.8% of returns)
Here:
+$5,021
State:
+$11,232
(% of AGI for various income ranges: 0.1% for AGIs $25k-50k, 0.2% for AGIs $50k-75k, 0.3% for AGIs $75k-100k, 0.9% for AGIs $100k-200k, 8.2% for AGIs over 200k)
Profit/loss from business: +$9,389 (reported on 12.9% of returns)
Here:
+$9,389
State:
+$12,773
(% of AGI for various income ranges: 6.6% for AGIs below $25k, 2.2% for AGIs $25k-50k, 1.5% for AGIs $50k-75k, 1.6% for AGIs $75k-100k, 2.0% for AGIs $100k-200k, 2.9% for AGIs over 200k)
Taxable individual retirement arrangement distribution: $13,346 (reported on 8.8% of returns)
43123:
$13,346
Ohio:
$14,511
(% of AGI for various income ranges: 3.1% for AGIs below $25k, 2.1% for AGIs $25k-50k, 2.4% for AGIs $50k-75k, 2.2% for AGIs $75k-100k, 2.2% for AGIs $100k-200k, 1.8% for AGIs over 200k)
Self-employment retirement plans: $12,344 (reported on 0.3% of returns)
43123:
$12,344
Ohio:
$20,257
(% of AGI for various income ranges: 0.4% for AGIs over 200k)
Total itemized deductions: $18,141 (21% of AGI, reported on 40.3% of returns)
Here:
$18,141
State:
$21,278
Here:
21.2% of AGI
State:
18.8% of AGI
(% of AGI for various income ranges: 7.5% for AGIs below $25k, 10.6% for AGIs $25k-50k, 14.2% for AGIs $50k-75k, 16.0% for AGIs $75k-100k, 16.5% for AGIs $100k-200k, 12.7% for AGIs over 200k)
Charity contributions: $2,742 (reported on 31.4% of returns)
Here:
$2,742
State:
$3,943
(% of AGI for various income ranges: 0.7% for AGIs below $25k, 1.0% for AGIs $25k-50k, 1.6% for AGIs $50k-75k, 1.9% for AGIs $75k-100k, 2.1% for AGIs $100k-200k, 1.9% for AGIs over 200k)
Taxes paid: $8,049 (reported on 40.2% of returns)
43123:
$8,049
State:
$9,568
(% of AGI for various income ranges: 2.4% for AGIs below $25k, 3.6% for AGIs $25k-50k, 5.7% for AGIs $50k-75k, 7.0% for AGIs $75k-100k, 8.2% for AGIs $100k-200k, 7.6% for AGIs over 200k)
Earned income credit: $2,246 (reported on 14.1% of returns)
Here:
$2,246
State:
$2,285
(% of AGI for various income ranges: 5.8% for AGIs below $25k, 0.8% for AGIs $25k-50k)
Percentage of individuals using paid preparers for their 2012 taxes: 45.7%
Here:
46%
State:
51%
(% for various income ranges: 40.3% for AGIs below $25k, 45.6% for AGIs $25k-50k, 49.6% for AGIs $50k-75k, 48.8% for AGIs $75k-100k, 49.6% for AGIs $100k-200k, 74.4% for AGIs over 200k)
Averages for the 2004 tax year for zip code 43123, filed in 2005:
Average Adjusted Gross Income (AGI) in 2004: $44,325 (Individual Income Tax Returns)
Here:
$44,325
State:
$44,480
Salary/wage: $41,422 (reported on 89.0% of returns)
Here:
$41,422
State:
$39,198
(% of AGI for various income ranges: 100.8% for AGIs below $10k, 76.7% for AGIs $10k-25k, 85.1% for AGIs $25k-50k, 85.9% for AGIs $50k-75k, 88.4% for AGIs $75k-100k, 74.5% for AGIs over 100k)
Taxable interest for individuals: $934 (reported on 39.1% of returns)
This zip code:
$934
Ohio:
$1,532
(% of AGI for various income ranges: 3.1% for AGIs below $10k, 1.6% for AGIs $10k-25k, 0.8% for AGIs $25k-50k, 0.7% for AGIs $50k-75k, 0.5% for AGIs $75k-100k, 0.8% for AGIs over 100k)
Taxable dividends: $1,263 (reported on 18.8% of returns)
Here:
$1,263
State:
$3,496
(% of AGI for various income ranges: 1.8% for AGIs below $10k, 0.8% for AGIs $10k-25k, 0.4% for AGIs $25k-50k, 0.4% for AGIs $50k-75k, 0.3% for AGIs $75k-100k, 0.8% for AGIs over 100k)
Net capital gain/loss: +$5,520 (reported on 13.8% of returns)
Here:
+$5,520
State:
+$8,582
(% of AGI for various income ranges: -1.5% for AGIs below $10k, 0.1% for AGIs $10k-25k, 0.2% for AGIs $25k-50k, 0.5% for AGIs $50k-75k, 0.9% for AGIs $75k-100k, 6.3% for AGIs over 100k)
Profit/loss from business: +$7,974 (reported on 13.4% of returns)
Here:
+$7,974
State:
+$10,813
(% of AGI for various income ranges: -1.4% for AGIs below $10k, 4.2% for AGIs $10k-25k, 1.9% for AGIs $25k-50k, 1.8% for AGIs $50k-75k, 2.1% for AGIs $75k-100k, 3.5% for AGIs over 100k)
IRA payment deduction: $2,634 (reported on 1.6% of returns)
43123:
$2,634
Ohio:
$2,794
(% of AGI for various income ranges: 0.1% for AGIs below $10k, 0.1% for AGIs $10k-25k, 0.1% for AGIs $25k-50k, 0.1% for AGIs $50k-75k, 0.1% for AGIs $75k-100k, 0.1% for AGIs over 100k)
Self-employed pension: $8,752 (reported on 0.5% of returns)
Here:
$8,752
Ohio:
$13,981
(% of AGI for various income ranges: 0.0% for AGIs $25k-50k, 0.0% for AGIs $50k-75k, 0.1% for AGIs $75k-100k, 0.3% for AGIs over 100k)
Total itemized deductions: $15,759 (23% of AGI, reported on 46.5% of returns)
Here:
$15,759
State:
$17,503
Here:
23.3% of AGI
State:
20.8% of AGI
(% of AGI for various income ranges: 10.3% for AGIs below $10k, 9.3% for AGIs $10k-25k, 14.5% for AGIs $25k-50k, 18.7% for AGIs $50k-75k, 19.6% for AGIs $75k-100k, 16.7% for AGIs over 100k)
Charity contributions deductions: $2,225 (3% of AGI, reported on 39.4% of returns)
Here:
$2,225
State:
$3,087
Here:
3.2% of AGI
State:
3.4% of AGI
(% of AGI for various income ranges: 0.5% for AGIs below $10k, 1.1% for AGIs $10k-25k, 1.5% for AGIs $25k-50k, 2.2% for AGIs $50k-75k, 2.3% for AGIs $75k-100k, 2.4% for AGIs over 100k)
Total tax: $5,322 (reported on 80.6% of returns)
43123:
$5,322
State:
$6,781
(% of AGI for various income ranges: 2.8% for AGIs below $10k, 4.5% for AGIs $10k-25k, 7.3% for AGIs $25k-50k, 8.7% for AGIs $50k-75k, 9.7% for AGIs $75k-100k, 15.7% for AGIs over 100k)
Earned income credit: $1,650 (reported on 11.0% of returns)
Here:
$1,650
State:
$1,696
Percentage of individuals using paid preparers for their 2004 taxes: 50.3%
Here:
50%
State:
55%
(% for various income ranges: 40.5% for AGIs below $10k, 50.5% for AGIs $10k-25k, 52.9% for AGIs $25k-50k, 52.8% for AGIs $50k-75k, 50.2% for AGIs $75k-100k, 54.2% for AGIs over 100k)
Likely homosexual households (counted as self-reported same-sex unmarried-partner households)
Lesbian couples: 0.3% of all households
Gay men: 0.2% of all households
Household received Food Stamps/SNAP in the past 12 months: 1,757 Household did not receive Food Stamps/SNAP in the past 12 months: 25,011
Women who had a birth in the past 12 months: 816 (545 now married, 272 unmarried) Women who did not have a birth in the past 12 months: 13,484 (6,754 now married, 6,725 unmarried)
Housing units in zip code 43123 with a mortgage: 14,232 (1,887 second mortgage, 62 home equity loan, 1,512 both second mortgage and home equity loan) Houses without a mortgage: 411
Median monthly owner costs for units with a mortgage: $1,590 Median monthly owner costs for units without a mortgage: $681
Residents with income below the poverty level in 2022:
This zip code:
6.4%
Whole state:
13.4%
Residents with income below 50% of the poverty level in 2022:
This zip code:
3.8%
Whole state:
7.0%
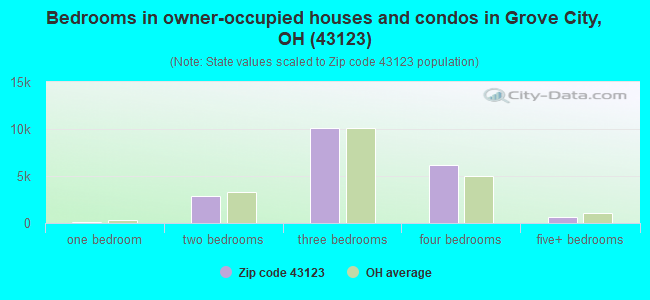
Median number of rooms in houses and condos:
Here:
6.6
State:
6.7
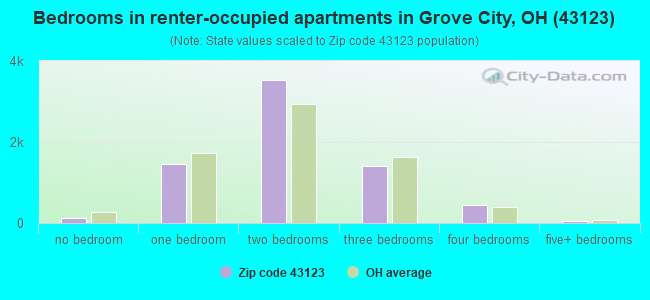
Median number of rooms in apartments:
Here:
4.3
State:
4.4
Notable locations in this zip code not listed on our city pages
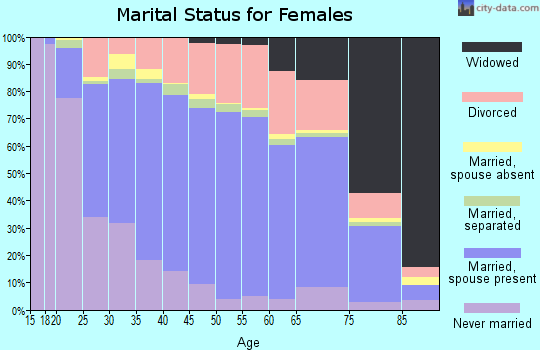
10,819 married couples with children.
3,412 single-parent households (1,028 men, 2,384 women).
92.3% of residents of 43123 zip code speak English at home.
2.2% of residents speak Spanish at home (65% very well, 22% well, 14% not well).
2.8% of residents speak other Indo-European language at home (63% very well, 27% well, 9% not well, 1% not at all).
1.5% of residents speak Asian or Pacific Island language at home (36% very well, 35% well, 26% not well, 2% not at all).
1.2% of residents speak other language at home (79% very well, 9% well, 10% not well, 2% not at all).
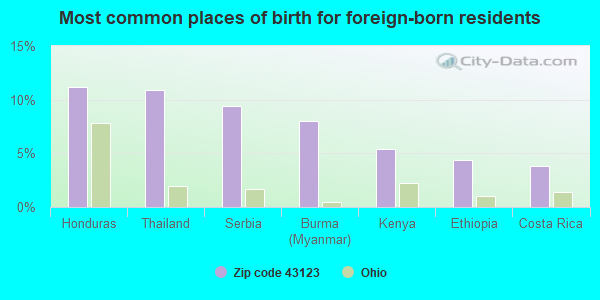
Foreign born population: 2,852 (4.3%) (55.6% of them are naturalized citizens)
Major facilities with environmental interests located in this zip code:
3M CO GROVE CITY AC&S (3570 SUNSHINE PL. in GROVE CITY, OH)
STATE MASTER (Ohio general info) - RCRA-OHD000716928, HAZARDOUS WASTE PROGRAM, AIR MAJOR, EPCRA, TRIS-43123MCMPN3570S, TRI REPORTER Small Quantity Generators, between 100 kg and 1000 kg of hazardous waste/month (Resource Conservation and Recovery Act (tracking hazardous waste)) - notification TRI REPORTER (Tracking of toxic chemicals releasing facilities) Business SIC classification: FABRICATED RUBBER PRODUCTS Business NAICS classification: SYNTHETIC RUBBER MANUFACTURING. Organizations: 3M COMPANY (CONTACT/OPERATOR)
, 3M CO GROVE CITY AC & S (CONTACT/OWNER)
BAESMAN PRINTING CORP (2120 HARDY PKWY ST in GROVE CITY, OH)
STATE MASTER (Ohio general info) - RCRA-OHD987047891, HAZARDOUS WASTE PROGRAM (Resource Conservation and Recovery Act (tracking hazardous waste)) Organizations: ROTHERMICH MARGARET (CONTACT/OWNER)
, MARGARET ROTHERMICH (CONTACT/OWNER)
BECKER POWDER COATINGS INC (3875 BROOKHAM DRIVE in GROVE CITY, OH)
CRITERIA AND HAZARDOUS AIR POLLUTANT INVENTORY (Inventory of air pollution sources) STATE MASTER (Ohio general info) - AIR MAJOR Conditionally Exempt Small Quantity Generators, less than 100 kg/month of hazardous waste (Resource Conservation and Recovery Act (tracking hazardous waste)) - notification TRI REPORTER (Tracking of toxic chemicals releasing facilities) Business SIC classification: PAINTS, VARNISHES, LACQUERS, ENAMELS, AND ALLIED PRODUCTS
AMERISTOP FOOD MART NO 324 (5503 NORTON RD in GROVE CITY, OH)
STATE MASTER (Ohio general info) - EPCRA, PCS-OH0130729, National Pollutant Discharge Elimination System Permit National Pollutant Discharge Elimination System NON-MAJOR (Tracking pollutant discharge elimination systems) - permit Business SIC classification: SEWERAGE SYSTEMS Organizations: DARBYDALE AMERISTOP FOOD MART (CONTACT/OWNER)
Alternative names: DARBYDALE A.M.F.
AUTOMATED GRAPHIC SYSTEMS (2375 HARRISBURG PIKE in GROVE CITY, OH)
STATE MASTER (Ohio general info) - RCRA-OHD004282943, HAZARDOUS WASTE PROGRAM, SDWIS-2546812, DRINKING WATER PROGRAM Small Quantity Generators, between 100 kg and 1000 kg of hazardous waste/month (Resource Conservation and Recovery Act (tracking hazardous waste)) - notification Organizations: BYRUM LITHOGRAPHING CO (CONTACT/OWNER)
Alternative names: BYRUM LITHOGRAPHING CO
AMERICAN AGGREGATES (3300 JACKSON PIKE in GROVE CITY, OH)
AIR MINOR (AIRS/AFS) National Pollutant Discharge Elimination System NON-MAJOR (Tracking pollutant discharge elimination systems) - permit Small Quantity Generators, between 100 kg and 1000 kg of hazardous waste/month (Resource Conservation and Recovery Act (tracking hazardous waste)) - notification Business SIC classification: CRUSHED AND BROKEN LIMESTONE Organizations: THE SHELLY COMPANY (CONTACT/OWNER)
, AMERICAN AGGREGATES CORP (CONTACT/OWNER)
Alternative names: MARTIN MARIETTA MATERIALS INC.
BOC GASES (1699 FEDDERN AVE in GROVE CITY, OH)
STATE MASTER (Ohio general info) - EPCRA (Resource Conservation and Recovery Act (tracking hazardous waste))
BP OIL CO (2487 STRINGTOWN RD in GROVE CITY, OH)
STATE MASTER (Ohio general info) - RCRA-OHD987013380, HAZARDOUS WASTE PROGRAM, AIR MAJOR, -25-5541-168-28, EPCRA Conditionally Exempt Small Quantity Generators, less than 100 kg/month of hazardous waste (Resource Conservation and Recovery Act (tracking hazardous waste)) - notification Organizations: BP OIL COMPANY (CONTACT/OWNER)
BP OIL CO (1825 HARRISBURG PIKE in GROVE CITY, OH)
STATE MASTER (Ohio general info) - RCRA-OHD987013398, HAZARDOUS WASTE PROGRAM, -25-5541-168-17, EPCRA Conditionally Exempt Small Quantity Generators, less than 100 kg/month of hazardous waste (Resource Conservation and Recovery Act (tracking hazardous waste)) - notification Organizations: BP OIL COMPANY (CONTACT/OWNER)
CENTRAL CROSSING HIGH SCHOOL (4500 BIG RUN SOUTH RD in GROVE CITY, OH)
(National Center for Education Statistics) - STATE ID-142018 Organizations: SOUTH-WESTERN (SCHOOL DISTRICT)
ADVANCED INDUSTRIAL DISPOSAL SYSTEMS (6316 SEEDS RD in GROVE CITY, OH)
(Resource Conservation and Recovery Act (tracking hazardous waste))
Housing units lacking complete plumbing facilities: 0.5% Housing units lacking complete kitchen facilities: 0.7%
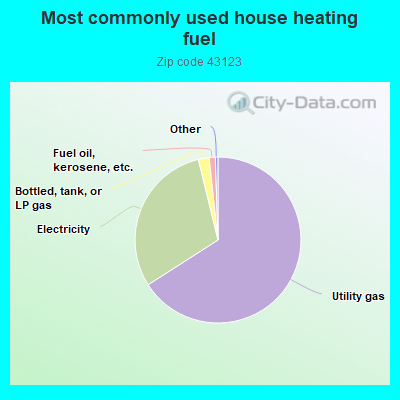
66.0%Utility gas
30.3%Electricity
2.1%Bottled, tank, or LP gas
1.2%Fuel oil, kerosene, etc.
Population in 1990: 33,730. Population change in the 1990s: +12,131 (+36.0%).
Place of birth for U.S.-born residents:
This state: 51,594
Northeast: 2,324
Midwest: 2,528
South: 4,824
West: 1,790
52% of the 43123 zip code residents lived in the same house 5 years ago. Out of people who lived in different houses, 75% lived in this county. Out of people who lived in different counties, 50% lived in Ohio.
89% of the 43123 zip code residents lived in the same house 1 year ago. Out of people who lived in different houses, 62% moved from this county. Out of people who lived in different houses, 22% moved from different county within same state. Out of people who lived in different houses, 12% moved from different state. Out of people who lived in different houses, 2% moved from abroad.
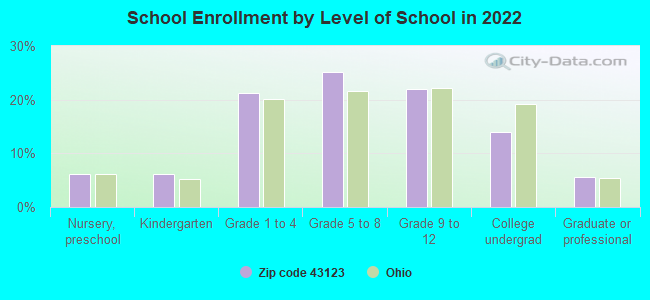
Private vs. public school enrollment:
Students in private schools in grades 1 to 8 (elementary and middle school): 647
Here:
9.8%
Ohio:
16.0%
Students in private schools in grades 9 to 12 (high school): 345
Here:
11.0%
Ohio:
13.1%
Students in private undergraduate colleges: 392
Here:
19.7%
Ohio:
22.3%
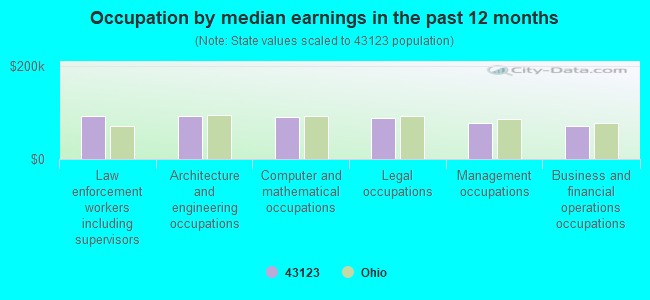
Occupation by median earnings in the past 12 months ($)
93,001Law enforcement workers including supervisors
92,264Architecture and engineering occupations
89,932Computer and mathematical occupations
88,102Legal occupations
77,507Management occupations
71,698Business and financial operations occupations
Companies with biggest federal contracts located in this zip code (GROVE CITY, OH):
C J MAHAN CONSTRUCTION COMPAN (3400 SOUTHWEST BLVD) : $93,001,088 in 79 contractsfrom 2000 to 2006
Contracts for Construction of Structures and Facilities -- Highways, Roads, Streets, Bridges, and Railways (includes resurfacing), Construction of Structures and Facilities -- Dams, Construction of Structures and Facilities -- Recreation Facilities (Non-Building) by Army, U.S. Army Corps of Engineers - civil program financing only, Federal Highway Administration Signed by year:2000: $2,000,000; 2001: $3,743,430; 2002: $11,843,226; 2003: $17,436,373; 2004: $31,397,818; 2005: $18,710,650; 2006: $7,869,591.
Biggest contracts:
$7,144,591 with Army for Construction of Structures and Facilities -- Highways, Roads, Streets, Bridges, and Railways (includes resurfacing). Taking place in KY. Signed on 2006-03-10. Completion date: 2005-10-28.
$5,500,000, same as above.Signed on 2005-02-04. Completion date: 2005-10-28.
$5,500,000 with U.S. Army Corps of Engineers - civil program financing only for Construction of Structures and Facilities -- Highways, Roads, Streets, Bridges, and Railways (includes resurfacing). Taking place in KY. Signed on 2005-02-04. Completion date: 2005-10-28.
$3,476,135 with Army for Construction of Structures and Facilities -- Dams. Taking place in KY. Signed on 2005-02-04. Completion date: 2005-09-30.
LATHAM AND PHILLIPS OPHTHALMIC (2300 SOUTHWEST BLVD; small business) : $925,712 in 45 contractsfrom 2002 to 2006
Contracts for Ophthalmic Instruments, Equipment, and Supplies, Optical Instruments, Test Equipment, Components and Accessories, Medical and Surgical Instruments, Equipment, and Supplies, Dental Instruments, Equipment, and Supplies, and moreby Department of Veterans Affairs, Army, Navy, Bureau of Prisoners/Federal Prison System, and others Signed by year:2000: $0; 2001: $0; 2002: $63,195; 2003: $441,059; 2004: $228,402; 2005: $62,980; 2006: $130,076.
Biggest contracts:
$105,000 with Department of Veterans Affairs for Ophthalmic Instruments, Equipment, and Supplies. Taking place in CA. Signed on 2004-09-16. Completion date: 2004-11-15.
$85,550 with Department of Veterans Affairs for Ophthalmic Instruments, Equipment, and Supplies. Signed on 2003-09-15. Completion date: 2003-10-15.
$64,838 with Department of Veterans Affairs for Optical Instruments, Test Equipment, Components and Accessories. Taking place in NC. Signed on 2003-09-15. Completion date: 2003-10-15.
$64,582 with Department of Veterans Affairs for Ophthalmic Instruments, Equipment, and Supplies. Taking place in GA. Signed on 2003-09-15. Completion date: 2003-10-15.
WATEC, INC (6327 BEAVER LAKE DRIVE; small business) : $334,954 in 15 contractsfrom 2000 to 2004
Contracts for Water Purification Equipment, Miscellaneous Special Industry Machinery, Power and Hand Pumps, Laboratory Equipment and Supplies, and moreby Army, Air Force, Defense Logistics Agency Signed by year:2000: $86,016; 2001: $34,214; 2002: $9,744; 2003: $66,921; 2004: $138,059; 2005: $0; 2006: $0.
Biggest contracts:
$55,100 with Army for Water Purification Equipment. Taking place in NJ. Signed on 2004-03-02. Completion date: 2004-03-17.
$52,727 with Army for Water Purification Equipment. Taking place in UT. Signed on 2004-03-11. Completion date: 2004-05-10.
$44,110 with Air Force for Water Purification Equipment. Signed on 2003-09-26. Completion date: 2003-10-30.
$43,008 with Defense Logistics Agency for Water Purification Equipment. Signed on 2000-11-17. Completion date: 2001-01-16.
HALCORE GROUP, INC (3800 MCDOWELL RD; small business) : $251,829 in 2 contractsfrom 2001 to 2004
$154,829 with Navy for Vehicular Cab, Body, and Frame Structural Components. Signed on 2004-02-26. Completion date: 2004-09-01.
$97,000 with National Park Service for Passenger Motor Vehicles. Taking place in CA. Signed on 2001-09-15. Completion date: 2002-03-15.
ADVANCE INDUSTRIAL MANUFACTURI (1996 LONGWOOD AVE; small business) : $217,062 in 8 contractsfrom 2005 to 2006
Contracts for Bridges, Fixed and Floating, Miscellaneous Vehicular Components, Vehicular Cab, Body, and Frame Structural Components by Defense Logistics Agency Signed by year:2000: $0; 2001: $0; 2002: $0; 2003: $0; 2004: $0; 2005: $60,388; 2006: $156,674.
Biggest contracts:
$120,305 with Defense Logistics Agency for Bridges, Fixed and Floating. Signed on 2006-04-12. Completion date: 2006-07-11.
$29,470 with Defense Logistics Agency for Miscellaneous Vehicular Components. Signed on 2006-04-07. Completion date: 2006-08-05.
$15,624 with Defense Logistics Agency for Vehicular Cab, Body, and Frame Structural Components. Signed on 2005-03-03. Completion date: 2005-05-05.
$15,004, same as above.Signed on 2005-05-24. Completion date: 2005-08-23.
BUCK EQUIPMENT INC (1720 FEDDERN AVE; small business) : $176,127 in 2 contractsfrom 2002 to 2004
$92,589 with Army for Miscellaneous Materials Handling Equipment. Signed on 2004-09-09. Completion date: 2004-10-22.
$83,538 with Navy for Lease or Rental of Equipment -- Railway Equipment. Signed on 2002-09-20. Completion date: 2003-09-19.
TOSOH SMD INC (3600 GANTZ RD) : $84,246 in 6 contractsfrom 2002 to 2005
Contracts for Precious Metals Primary Forms, Hardware, Commercial, Other Defense -- Applied Research and Exploratory Development (R&D), Laboratory Equipment and Supplies, and moreby Army Signed by year:2000: $0; 2001: $0; 2002: $18,025; 2003: $27,211; 2004: $20,550; 2005: $18,460; 2006: $0.
Biggest contracts:
$27,211 with Army for Precious Metals Primary Forms. Signed on 2003-01-21. Completion date: 2003-01-31.
$18,460 with Army for Hardware, Commercial. Signed on 2005-06-23. Completion date: 2005-09-01.
$15,000 with Army for Other Defense -- Applied Research and Exploratory Development (R&D). Signed on 2004-09-22. Completion date: 2004-12-15.
$15,000 with Army for Laboratory Equipment and Supplies. Signed on 2002-01-22. Completion date: 2002-03-04.
TOOLTEX INC (6160 SEEDS RD; small business)
$39,796 with Navy for Hydraulic and Pneumatic Presses, Power Driven. Taking place in GA. Signed on 2003-01-28. Completion date: 2003-02-14.
COLUMBUS PRODUCTION PAINTING I (2087 HENDRIX DR; small business)
$29,000 with Army for Paints, Dopes, Varnishes, and Related Products. Signed on 2004-03-18. Completion date: 2004-03-25.
OKI SYSTEMS LIMITED (2100 SOUTHWEST BLVD; small business) : $15,151 in 3 contractsfrom 2005 to 2006
$9,056 with Defense Logistics Agency for Warehouse Trucks and Tractors, Self-Propelled. Signed on 2005-05-20. Completion date: 2005-07-20.
$3,542 with Defense Logistics Agency for Gears, Pulleys, Sprockets, and Transmission Chain. Signed on 2006-05-23. Completion date: 2006-08-21.
$2,553 with Defense Logistics Agency for Warehouse Trucks and Tractors, Self-Propelled. Signed on 2005-03-21. Completion date: 2005-05-20.
Top industries in this zip code by the number of employees in 2005:
2002 - 2018 National Fire Incident Reporting System (NFIRS) incidents
According to the data from the years 2002 - 2018 the average number of fires per year is 117. The highest number of fires - 156 took place in 2007, and the least - 69 in 2017. The data has an increasing trend.
When looking into fire subcategories, the most incidents belonged to: Structure Fires (38.1%), and Outside Fires (35.5%).
Fire incident types reported to NFIRS in Zip Code 43123
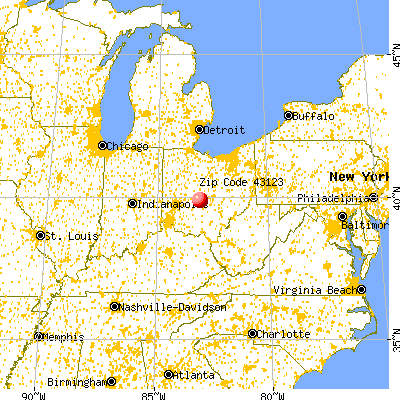


 Nearest zip codes: 43126, 43204, 43228, 43146, 43223, 43116.


 According to the data from the years 2002 - 2018 the average number of fires per year is 117. The highest number of fires - 156 took place in 2007, and the least - 69 in 2017. The data has an increasing trend.
 When looking into fire subcategories, the most incidents belonged to: Structure Fires (38.1%), and Outside Fires (35.5%).