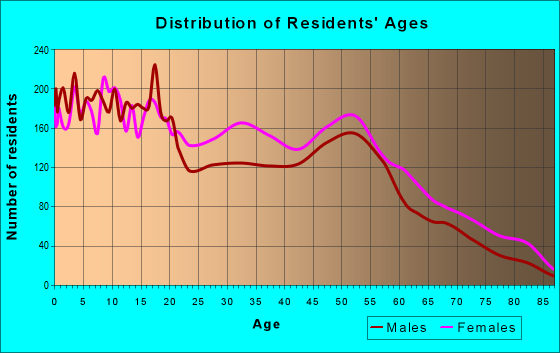
Estimated zip code population in 2022: 21,941 Zip code population in 2010: 21,600 Zip code population in 2000: 25,013
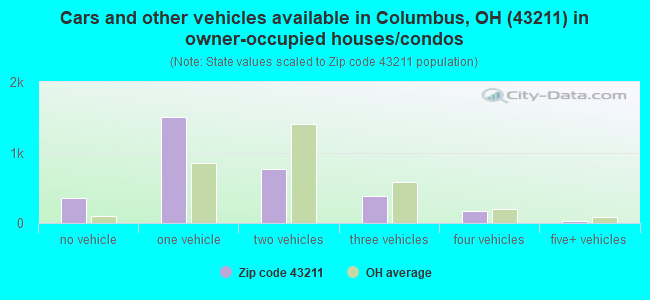
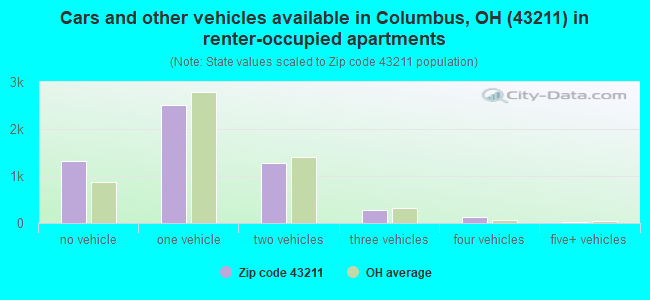
Houses and condos: 10,059 Renter-occupied apartments: 5,516
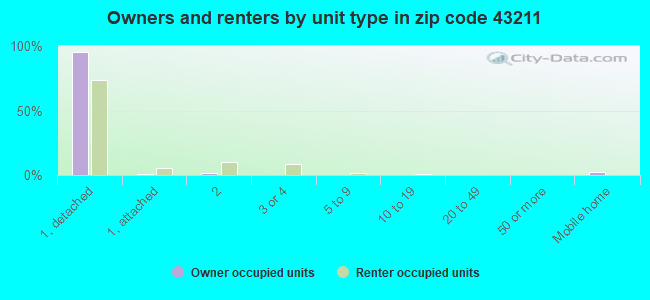
% of renters here:
63%
State:
33%
March 2022 cost of living index in zip code 43211: 94.0 (less than average, U.S. average is 100)
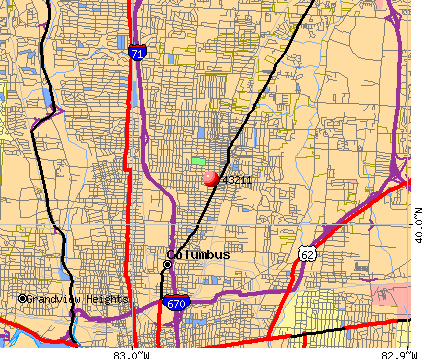
Land area: 4.7 sq. mi. Water area: 0.0 sq. mi.
Population density: 4,653 people per square mile
(average).
OSM Map
General Map
Google Map
MSN Map
OSM Map
General Map
Google Map
MSN Map
OSM Map
General Map
Google Map
MSN Map
OSM Map
General Map
Google Map
MSN Map
Please wait while loading the map...
Real estate property taxes paid for housing units in 2022:
This zip code:
1.4% ($1,177)
Ohio:
1.3% ($2,639)
Median real estate property taxes paid for housing units with mortgages in 2022: $1,271 (1.3%) Median real estate property taxes paid for housing units with no mortgage in 2022: $1,049 (1.6%)
Averages for the 2020 tax year for zip code 43211, filed in 2021:
Average Adjusted Gross Income (AGI) in 2020: $27,200 (Individual Income Tax Returns)
Here:
$27,200
State:
$67,288
Salary/wage: $24,695 (reported on 84.0% of returns)
Here:
$24,695
State:
$55,628
(% of AGI for various income ranges: 1066.6% for AGIs below $25k, 3389.8% for AGIs $25k-50k, 6582.3% for AGIs $50k-75k, 9943.6% for AGIs $75k-100k, 17686.0% for AGIs $100k-200k)
Taxable interest for individuals: $213 (reported on 5.5% of returns)
This zip code:
$213
Ohio:
$1,518
(% of AGI for various income ranges: 0.8% for AGIs below $25k, 0.9% for AGIs $25k-50k, 2.5% for AGIs $50k-75k, 20.7% for AGIs $75k-100k, 14.0% for AGIs $100k-200k)
Ordinary dividends: $765 (reported on 2.4% of returns)
Here:
$765
State:
$7,167
(% of AGI for various income ranges: 0.9% for AGIs below $25k, 0.9% for AGIs $25k-50k, 7.1% for AGIs $50k-75k, 50.7% for AGIs $75k-100k)
Net capital gain/loss in AGI: +$3,485 (reported on 2.1% of returns)
Here:
+$3,485
State:
+$18,919
(% of AGI for various income ranges: 1.1% for AGIs below $25k, 6.0% for AGIs $25k-50k, 24.1% for AGIs $50k-75k, 249.3% for AGIs $75k-100k)
Profit/loss from business: +$6,123 (reported on 18.7% of returns)
Here:
+$6,123
State:
+$13,744
(% of AGI for various income ranges: 129.8% for AGIs below $25k, 113.2% for AGIs $25k-50k, 242.7% for AGIs $50k-75k, 510.7% for AGIs $75k-100k)
Taxable individual retirement arrangement distribution: $8,437 (reported on 2.0% of returns)
43211:
$8,437
Ohio:
$18,876
(% of AGI for various income ranges: 9.8% for AGIs below $25k, 19.6% for AGIs $25k-50k, 113.2% for AGIs $50k-75k)
Total itemized deductions: $22,000 (reported on 0.9% of returns)
Here:
$22,000
State:
$33,869
(% of AGI for various income ranges: 32.7% for AGIs $25k-50k, 195.7% for AGIs $50k-75k)
Charity contributions: $8,440 (reported on 0.5% of returns)
Here:
$8,440
State:
$14,577
(% of AGI for various income ranges: 6.5% for AGIs $25k-50k, 43.9% for AGIs $50k-75k)
Taxes paid: $3,478 (reported on 0.9% of returns)
43211:
$3,478
State:
$7,681
(% of AGI for various income ranges: 4.0% for AGIs $25k-50k, 36.4% for AGIs $50k-75k)
Earned income credit: $2,920 (reported on 43.2% of returns)
Here:
$2,920
State:
$2,304
(% of AGI for various income ranges: 196.7% for AGIs below $25k, 120.7% for AGIs $25k-50k)
Percentage of individuals using paid preparers for their 2020 taxes: 94.3%
Here:
94%
State:
94%
(% for various income ranges: 94.1% for AGIs below $25k, 95.1% for AGIs $25k-50k, 92.2% for AGIs $50k-75k, 90.9% for AGIs $75k-100k, 100.0% for AGIs $100k-200k)
Averages for the 2012 tax year for zip code 43211, filed in 2013:
Average Adjusted Gross Income (AGI) in 2012: $22,090 (Individual Income Tax Returns)
Here:
$22,090
State:
$54,926
Salary/wage: $20,332 (reported on 83.6% of returns)
Here:
$20,332
State:
$45,869
(% of AGI for various income ranges: 74.2% for AGIs below $25k, 82.1% for AGIs $25k-50k, 79.0% for AGIs $50k-75k, 78.2% for AGIs $75k-100k, 49.7% for AGIs $100k-200k)
Taxable interest for individuals: $308 (reported on 7.2% of returns)
This zip code:
$308
Ohio:
$1,297
(% of AGI for various income ranges: 0.2% for AGIs $50k-75k)
Ordinary dividends: $1,862 (reported on 2.8% of returns)
Here:
$1,862
State:
$5,821
(% of AGI for various income ranges: 0.2% for AGIs below $25k, 0.2% for AGIs $25k-50k, 0.8% for AGIs $50k-75k)
Net capital gain/loss in AGI: +$150 (reported on 1.2% of returns)
Here:
+$150
State:
+$11,232
(% of AGI for various income ranges: 0.1% for AGIs below $25k)
Profit/loss from business: +$8,337 (reported on 17.3% of returns)
Here:
+$8,337
State:
+$12,773
(% of AGI for various income ranges: 15.8% for AGIs below $25k, 1.0% for AGIs $25k-50k, 0.7% for AGIs $50k-75k)
Taxable individual retirement arrangement distribution: $7,513 (reported on 2.7% of returns)
43211:
$7,513
Ohio:
$14,511
(% of AGI for various income ranges: 0.6% for AGIs below $25k, 0.8% for AGIs $25k-50k, 1.5% for AGIs $50k-75k, 3.5% for AGIs $75k-100k)
Total itemized deductions: $12,742 (26% of AGI, reported on 8.4% of returns)
Here:
$12,742
State:
$21,278
Here:
26.4% of AGI
State:
18.8% of AGI
(% of AGI for various income ranges: 1.8% for AGIs below $25k, 5.3% for AGIs $25k-50k, 8.7% for AGIs $50k-75k, 9.0% for AGIs $75k-100k, 9.4% for AGIs $100k-200k)
Charity contributions: $3,162 (reported on 6.2% of returns)
Here:
$3,162
State:
$3,943
(% of AGI for various income ranges: 0.2% for AGIs below $25k, 1.0% for AGIs $25k-50k, 1.8% for AGIs $50k-75k, 1.8% for AGIs $75k-100k, 2.0% for AGIs $100k-200k)
Taxes paid: $3,620 (reported on 8.3% of returns)
43211:
$3,620
State:
$9,568
(% of AGI for various income ranges: 0.4% for AGIs below $25k, 1.4% for AGIs $25k-50k, 2.4% for AGIs $50k-75k, 2.8% for AGIs $75k-100k, 4.0% for AGIs $100k-200k)
Earned income credit: $2,851 (reported on 50.0% of returns)
Here:
$2,851
State:
$2,285
(% of AGI for various income ranges: 15.1% for AGIs below $25k, 1.8% for AGIs $25k-50k)
Percentage of individuals using paid preparers for their 2012 taxes: 43.3%
Here:
43%
State:
51%
(% for various income ranges: 44.1% for AGIs below $25k, 40.4% for AGIs $25k-50k, 44.4% for AGIs $50k-75k, 41.7% for AGIs $75k-100k, 50.0% for AGIs $100k-200k)
Averages for the 2004 tax year for zip code 43211, filed in 2005:
Average Adjusted Gross Income (AGI) in 2004: $22,065 (Individual Income Tax Returns)
Here:
$22,065
State:
$44,480
Salary/wage: $21,028 (reported on 89.9% of returns)
Here:
$21,028
State:
$39,198
(% of AGI for various income ranges: 85.3% for AGIs below $10k, 84.6% for AGIs $10k-25k, 88.7% for AGIs $25k-50k, 86.5% for AGIs $50k-75k, 80.4% for AGIs $75k-100k, 44.5% for AGIs over 100k)
Taxable interest for individuals: $475 (reported on 12.5% of returns)
This zip code:
$475
Ohio:
$1,532
(% of AGI for various income ranges: 0.3% for AGIs below $10k, 0.3% for AGIs $10k-25k, 0.3% for AGIs $25k-50k, 0.2% for AGIs $50k-75k, 0.5% for AGIs $75k-100k, 0.4% for AGIs over 100k)
Taxable dividends: $585 (reported on 3.4% of returns)
Here:
$585
State:
$3,496
(% of AGI for various income ranges: 0.2% for AGIs below $10k, 0.1% for AGIs $10k-25k, 0.1% for AGIs $25k-50k, 0.1% for AGIs $50k-75k, 0.4% for AGIs $75k-100k)
Net capital gain/loss: +$374 (reported on 2.3% of returns)
Here:
+$374
State:
+$8,582
(% of AGI for various income ranges: -0.1% for AGIs below $10k, -0.0% for AGIs $10k-25k, 0.1% for AGIs $25k-50k, 0.2% for AGIs $50k-75k, 0.2% for AGIs $75k-100k)
Profit/loss from business: +$4,090 (reported on 10.0% of returns)
Here:
+$4,090
State:
+$10,813
(% of AGI for various income ranges: 8.0% for AGIs below $10k, 3.4% for AGIs $10k-25k, 0.6% for AGIs $25k-50k, 0.1% for AGIs $50k-75k, 1.5% for AGIs $75k-100k)
IRA payment deduction: $1,614 (reported on 0.6% of returns)
43211:
$1,614
Ohio:
$2,794
Total itemized deductions: $11,139 (28% of AGI, reported on 15.3% of returns)
Here:
$11,139
State:
$17,503
Here:
27.8% of AGI
State:
20.8% of AGI
(% of AGI for various income ranges: 1.8% for AGIs below $10k, 4.3% for AGIs $10k-25k, 8.8% for AGIs $25k-50k, 12.0% for AGIs $50k-75k, 11.4% for AGIs $75k-100k, 15.7% for AGIs over 100k)
Charity contributions deductions: $2,856 (7% of AGI, reported on 11.9% of returns)
Here:
$2,856
State:
$3,087
Here:
6.8% of AGI
State:
3.4% of AGI
(% of AGI for various income ranges: 0.2% for AGIs below $10k, 0.7% for AGIs $10k-25k, 1.6% for AGIs $25k-50k, 3.0% for AGIs $50k-75k, 2.9% for AGIs $75k-100k, 3.9% for AGIs over 100k)
Total tax: $2,305 (reported on 56.8% of returns)
43211:
$2,305
State:
$6,781
(% of AGI for various income ranges: 1.9% for AGIs below $10k, 3.1% for AGIs $10k-25k, 6.3% for AGIs $25k-50k, 9.3% for AGIs $50k-75k, 11.6% for AGIs $75k-100k, 18.4% for AGIs over 100k)
Earned income credit: $2,079 (reported on 42.6% of returns)
Here:
$2,079
State:
$1,696
Percentage of individuals using paid preparers for their 2004 taxes: 57.2%
Here:
57%
State:
55%
(% for various income ranges: 54.5% for AGIs below $10k, 63.1% for AGIs $10k-25k, 52.9% for AGIs $25k-50k, 54.1% for AGIs $50k-75k, 47.8% for AGIs $75k-100k, 67.9% for AGIs over 100k)
Likely homosexual households (counted as self-reported same-sex unmarried-partner households)
Lesbian couples: 0.2% of all households
Gay men: 0.1% of all households
Household received Food Stamps/SNAP in the past 12 months: 3,262 Household did not receive Food Stamps/SNAP in the past 12 months: 5,570
Women who had a birth in the past 12 months: 391 (69 now married, 310 unmarried) Women who did not have a birth in the past 12 months: 5,490 (1,366 now married, 4,126 unmarried)
Housing units in zip code 43211 with a mortgage: 1,632 (164 second mortgage, 23 home equity loan, 79 both second mortgage and home equity loan) Houses without a mortgage: 88
Median monthly owner costs for units with a mortgage: $855 Median monthly owner costs for units without a mortgage: $365
Residents with income below the poverty level in 2022:
This zip code:
36.8%
Whole state:
13.4%
Residents with income below 50% of the poverty level in 2022:
This zip code:
17.9%
Whole state:
7.0%
Median number of rooms in houses and condos:
Here:
5.4
State:
6.7
Median number of rooms in apartments:
Here:
5.0
State:
4.4
Notable locations in this zip code not listed on our city pages
Notable locations in zip code 43211: Ohio Exposition Center (A), Bridgeview Golf Course (B), Korbel East Campground (C), Korbel West Campground (D), Korbel North Campground (E), Columbus Crew Stadium (F), Mifflin Township Division of Fire Station 132 (G), Ohio Historical Center (H), Columbus Division of Fire Station 18 Herbert F Turner / South Linden Fire Station (I), Ohio Expo Center Coliseum (J), Rabbit And Poultry Building (K), Janis Center (L), South Commercial Building (M), Cox Fine Arts Center (N), North Commercial Building (O), O'Neill Building (P), Voinovich Livestock And Trade Center (Q), Buckeye Building (R), Ohio Building (S), Ohio Exposition Center Administration Office (T). Display/hide their locations on the map
Churches in zip code 43211 include: Unified Interdenominational Church of Christ (A), Twelfth Avenue Baptist Church (B), Travelers Rest Baptist Church (C), Temple of Faith Church of Deliverance (D), New Walk Church of God in Christ (E), Mount Victory Baptist Church (F), Mount Lebanon Baptist Church (G), Maynard Avenue Baptist Church (H), Man in Christ Ministries (I). Display/hide their locations on the map
Parks in zip code 43211 include: Natural Resources Park (1), Heritage Park (2), Central Park (3), Audubon Park (4), Alum Creek Arlington Park (5), Windsor Park (6), Linden Park (7), Joan Park (8). Display/hide their locations on the map
866 married couples with children.
4,325 single-parent households (367 men, 3,958 women).
88.8% of residents of 43211 zip code speak English at home.
7.1% of residents speak Spanish at home (24% very well, 36% well, 25% not well, 15% not at all).
3.1% of residents speak other Indo-European language at home (49% very well, 27% well, 7% not well, 16% not at all).
0.1% of residents speak Asian or Pacific Island language at home (100% well).
1.0% of residents speak other language at home (59% very well, 20% well, 22% not well).
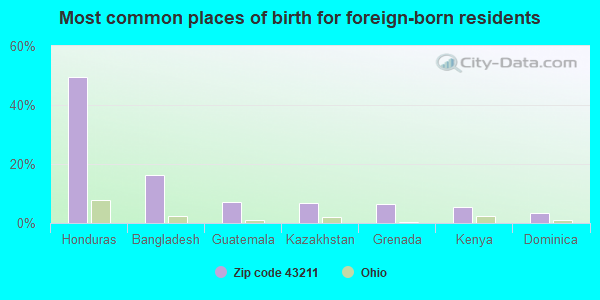
Foreign born population: 1,546 (7.0%) (29.0% of them are naturalized citizens)
Facilities with environmental interests located in this zip code:
AKZO NOBEL COATINGS INC (1313 WINDSOR AVENUE in COLUMBUS, OH)
AIR SYNTHETIC MINOR (AIRS/AFS) (Integrated Compliance Information System) - ICIS-05-2005-0069, ENFORCEMENT/COMPLIANCE ACTIVITY, ICIS-, FORMAL ENFORCEMENT ACTION (Integrated Compliance Information System) - ICIS-05-2005-0069, ENFORCEMENT/COMPLIANCE ACTIVITY, ICIS-, CRITERIA AND HAZARDOUS AIR POLLUTANT INVENTORY (Inventory of air pollution sources) STATE MASTER (Ohio general info) - RCRA-OHD004288890, HAZARDOUS WASTE PROGRAM, AIR MAJOR, EPCRA, TRIS-43211HNNCH1313W, TRI REPORTER HAZARDOUS WASTE BIENNIAL REPORTER (Resource Conservation and Recovery Act (tracking hazardous waste)) Large Quantity Generators, more that 1000 kg of hazardous waste/month (Resource Conservation and Recovery Act (tracking hazardous waste)) - notification TSD (Resource Conservation and Recovery Act (tracking hazardous waste)) TRI REPORTER (Tracking of toxic chemicals releasing facilities) Business SIC classification: PLASTICS MATERIALS, SYNTHETIC RESINS, AND NONVULCANIZABLE ELASTOMERS; PAINTS, VARNISHES, LACQUERS, ENAMELS, AND ALLIED PRODUCTS Business NAICS classification: PLASTICS MATERIAL AND RESIN MANUFACTURING.; PAINT AND COATING MANUFACTURING. Organizations: AKZO NOBEL INC (CONTACT/OWNER)
Alternative names: AKZ0 C0ATINGS, INC., AKZO NOBLE COATINGS INC
ASARCO INC * (1363 WINDSOR AVENUE in COLUMBUS, OH)
SUPERFUND (Superfund database) STATE MASTER (Ohio general info) - PCS-OH0102067, National Pollutant Discharge Elimination System Permit, RCRA-OHD056743933, HAZARDOUS WASTE PROGRAM, EPCRA National Pollutant Discharge Elimination System NON-MAJOR (Tracking pollutant discharge elimination systems) - permit HAZARDOUS WASTE BIENNIAL REPORTER (Resource Conservation and Recovery Act (tracking hazardous waste)) (Resource Conservation and Recovery Act (tracking hazardous waste)) Business SIC classification: CHEMICALS AND ALLIED PRODUCTS Organizations: ASARCO INC. (CONTACT/OWNER)
, ASARCO INC(PARENT COMPANY) (CONTACT/OWNER)
, BRIDGEVIEW MANAGMENT CO INC (CONTACT/OWNER)
BONDED 1077 (1147 E WEBER RD in COLUMBUS, OH)
STATE MASTER (Ohio general info) - RCRA-OHD987003035, HAZARDOUS WASTE PROGRAM, AIR MAJOR, -25-5541-899-7, EPCRA (Resource Conservation and Recovery Act (tracking hazardous waste)) Organizations: SPEEDWAY/SUPERAMERICA (CONTACT/OWNER)
BONDED 1079 (1800 E HUDSON RD in COLUMBUS, OH)
STATE MASTER (Ohio general info) - RCRA-OHD987003043, HAZARDOUS WASTE PROGRAM, AIR MAJOR, -25-5541-899-8, EPCRA (Resource Conservation and Recovery Act (tracking hazardous waste)) Organizations: SPEEDWAY/SUPERAMERICA (CONTACT/OWNER)
BP OIL CO (675 E HUDSON in COLUMBUS, OH)
STATE MASTER (Ohio general info) - RCRA-OHD987013216, HAZARDOUS WASTE PROGRAM, AIR MAJOR, -25-5541-168-23, EPCRA Small Quantity Generators, between 100 kg and 1000 kg of hazardous waste/month (Resource Conservation and Recovery Act (tracking hazardous waste)) - notification Organizations: BP OIL COMPANY (CONTACT/OWNER)
CHECKPOINT BODYSHOP (2274 CLEVELAND AVE in COLUMBUS, OH)
STATE MASTER (Ohio general info) - RCRA-OHR000002477, HAZARDOUS WASTE PROGRAM Conditionally Exempt Small Quantity Generators, less than 100 kg/month of hazardous waste (Resource Conservation and Recovery Act (tracking hazardous waste)) - notification Organizations: VINCENT D DEFELICE (CONTACT/OWNER)
ALLERGY LABS OF OHIO INC (623 E ELEVENTH AVE in COLUMBUS, OH)
Small Quantity Generators, between 100 kg and 1000 kg of hazardous waste/month (Resource Conservation and Recovery Act (tracking hazardous waste)) - notification
Housing units lacking complete plumbing facilities: 4.1% Housing units lacking complete kitchen facilities: 5.7%
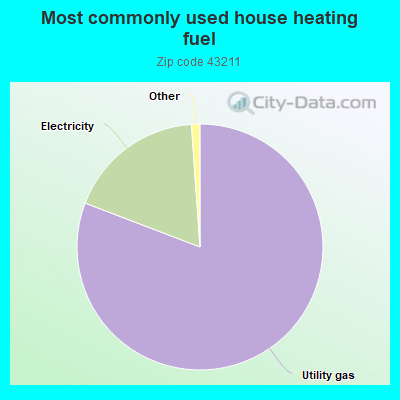
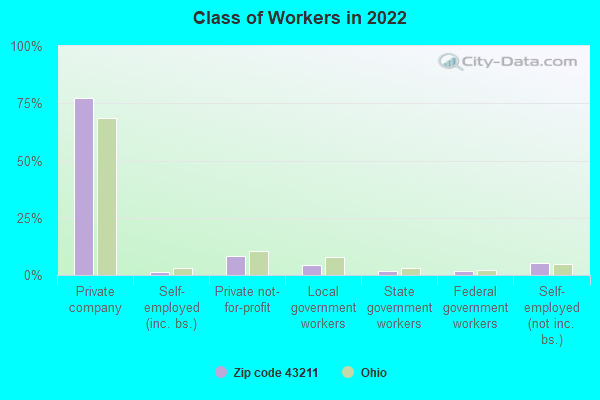
80.9%Utility gas
18.1%Electricity
Population in 1990: 28,031.
Place of birth for U.S.-born residents:
This state: 16,397
Northeast: 904
Midwest: 722
South: 1,899
West: 240
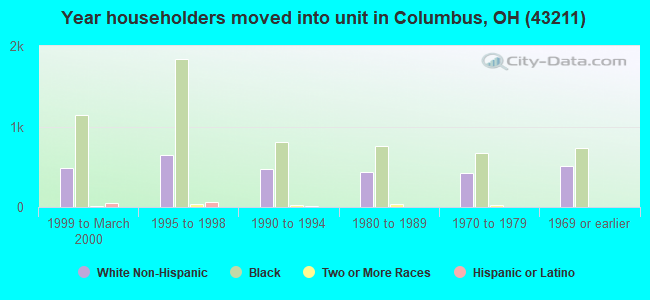
52% of the 43211 zip code residents lived in the same house 5 years ago. Out of people who lived in different houses, 83% lived in this county. Out of people who lived in different counties, 50% lived in Ohio.
86% of the 43211 zip code residents lived in the same house 1 year ago. Out of people who lived in different houses, 77% moved from this county. Out of people who lived in different houses, 9% moved from different county within same state. Out of people who lived in different houses, 5% moved from different state. Out of people who lived in different houses, 3% moved from abroad.
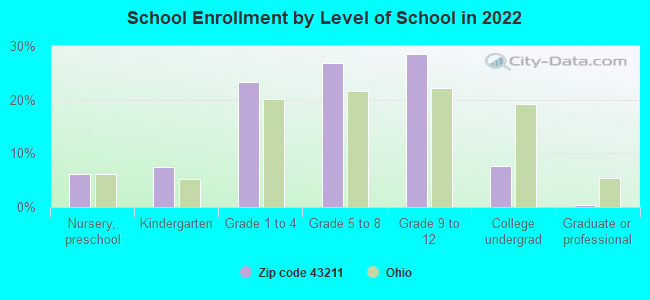
Private vs. public school enrollment:
Students in private schools in grades 1 to 8 (elementary and middle school): 288
Here:
10.0%
Ohio:
16.0%
Students in private schools in grades 9 to 12 (high school): 155
Here:
9.5%
Ohio:
13.1%
Students in private undergraduate colleges: 97
Here:
22.2%
Ohio:
22.3%
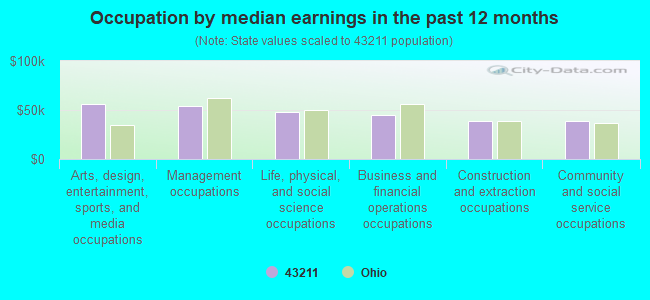
Occupation by median earnings in the past 12 months ($)
55,708Arts, design, entertainment, sports, and media occupations
53,968Management occupations
48,276Life, physical, and social science occupations
45,253Business and financial operations occupations
38,280Construction and extraction occupations
38,275Community and social service occupations
Companies with federal contracts located in this zip code (COLUMBUS, OH):
B & D HAULING, INC (1945 CLEVELAND AVE; small business) : $87,613 in 5 contractsfrom 2004 to 2005
Contracts for Trash/Garbage Collection Services - Including Portable Sanitation Services, Miscellaneous Items by Army, Defense Logistics Agency Signed by year:2000: $0; 2001: $0; 2002: $0; 2003: $0; 2004: $33,553; 2005: $54,060; 2006: $0.
Biggest contracts:
$54,060 with Army for Trash/Garbage Collection Services - Including Portable Sanitation Services. Signed on 2005-10-13. Completion date: 2005-09-30.
$54,060, same as above.Signed on 2004-10-14. Completion date: 2005-09-30.
$0, same as above.Signed on 2005-10-13. Completion date: 2005-09-30.
-$639 with Defense Logistics Agency for Miscellaneous Items. Signed on 2004-10-01. Completion date: 2004-10-30.
DIGITAL MILL, LLC (1391 ESSEX , STE B; small business)
$43,820 with Army for Signs, Advertising Displays, and Identification Plates. Signed on 2004-09-07. Completion date: 2004-10-30.
OHIO EXPOSITION CENTER (717 E 17TH AVE) : $25,395 in 8 contractsfrom 2004 to 2006
Contracts for Lease or Rental of Facilities -- Exhibit Design (Non-Building), Lease or Rental of Facilities -- Conference Space and Facilities, Advertising Services, Lease or Rental of Facilities -- Museums and Exhibition Buildings by Army, Navy, Bureau of Land Management Signed by year:2000: $0; 2001: $0; 2002: $0; 2003: $0; 2004: $5,225; 2005: $11,510; 2006: $8,660.
Biggest contracts:
$5,225 with Army for Lease or Rental of Facilities -- Exhibit Design (Non-Building). Signed on 2004-08-03. Completion date: 2004-08-15.
$5,010 with Army for Lease or Rental of Facilities -- Conference Space and Facilities. Signed on 2006-01-09. Completion date: 2006-08-13.
$5,010 with Army for Lease or Rental of Facilities -- Exhibit Design (Non-Building). Signed on 2005-01-26. Completion date: 2005-08-14.
$4,585, same as above.Signed on 2004-06-09. Completion date: 2004-08-15.
WATKINS PRINTING COMPANY (1401 E 17TH AVE; small business) : $6,985 in 2 contractsfrom 2005 to 2006
$6,575 with Army for Print/Binding Services. Signed on 2005-12-13. Completion date: 2006-01-03.
$410, same as above.Signed on 2006-04-07. Completion date: 2006-01-03.
TEAM COLUMBUS SOCCER LLC (ONE BLACK AND GOLD BLVD)
$5,000 with Army for Advertising Services. Signed on 2005-04-20. Completion date: 2005-04-21.
HALL ELECTRONICS INC (815 E HUDSON ST; small business)
$2,880 with U.S. Special Operations Command for Cable, Cord, and Wire Assemblies: Communications Equipment. Signed on 2005-12-09. Completion date: 2005-12-23.
Top industries in this zip code by the number of employees in 2005:
2002 - 2018 National Fire Incident Reporting System (NFIRS) incidents
Based on the data from the years 2002 - 2018 the average number of fire incidents per year is 208. The highest number of fire incidents - 275 took place in 2002, and the least - 141 in 2018. The data has a dropping trend.
When looking into fire subcategories, the most incidents belonged to: Structure Fires (38.1%), and Outside Fires (34.3%).
Fire incident types reported to NFIRS in Zip Code 43211
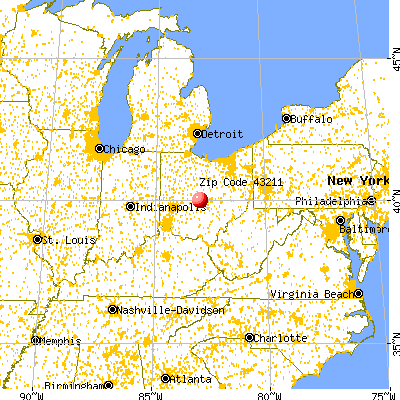


 Nearest zip codes: 43224, 43201, 43203, 43202, 43219, 43210.


 Based on the data from the years 2002 - 2018 the average number of fire incidents per year is 208. The highest number of fire incidents - 275 took place in 2002, and the least - 141 in 2018. The data has a dropping trend.
 When looking into fire subcategories, the most incidents belonged to: Structure Fires (38.1%), and Outside Fires (34.3%).