Estimated zip code population in 2022: 1,278 Zip code population in 2010: 1,456 Zip code population in 2000: 1,656
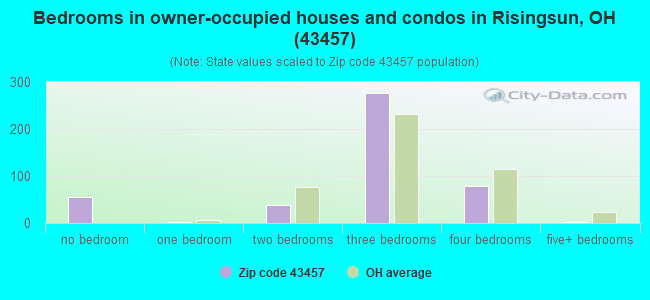
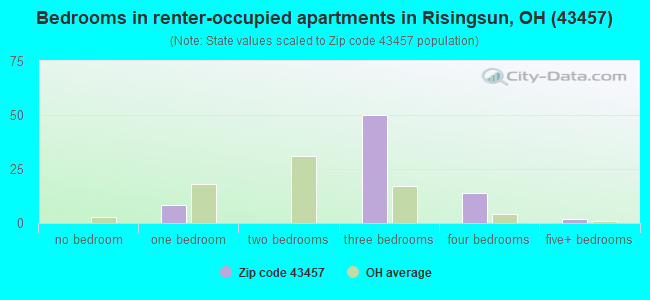
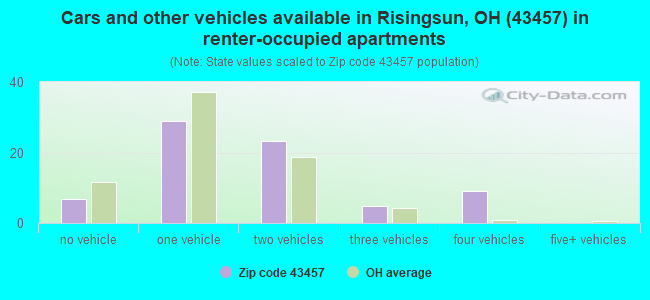
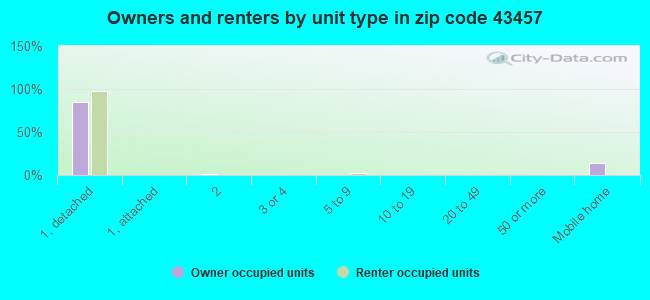
Houses and condos: 548 Renter-occupied apartments: 75
% of renters here:
14%
State:
33%
March 2022 cost of living index in zip code 43457: 83.7 (less than average, U.S. average is 100)
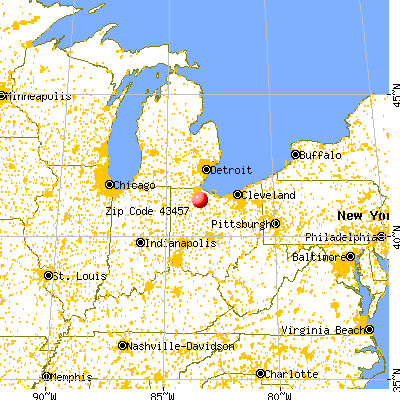
Land area: 18.5 sq. mi. Water area: 0.0 sq. mi.
Population density: 69 people per square mile
(very low).
OSM Map
General Map
Google Map
MSN Map
OSM Map
General Map
Google Map
MSN Map
OSM Map
General Map
Google Map
MSN Map
OSM Map
General Map
Google Map
MSN Map
Please wait while loading the map...
Real estate property taxes paid for housing units in 2022:
This zip code:
1.0% ($1,735)
Ohio:
1.3% ($2,639)
Median real estate property taxes paid for housing units with mortgages in 2022: $1,780 (1.0%) Median real estate property taxes paid for housing units with no mortgage in 2022: $1,647 (1.0%)
Business Search- 14 Million verified businesses
Males: 692
(54.1%)
Females: 586
(45.9%)
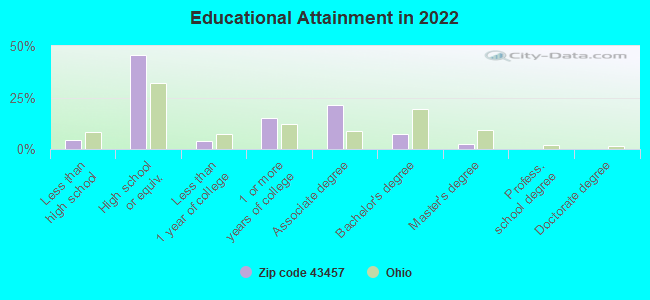
For population 25 years and over in 43457:
High school or higher: 93.9%
Bachelor's degree or higher: 9.4%
Graduate or professional degree: 2.3%
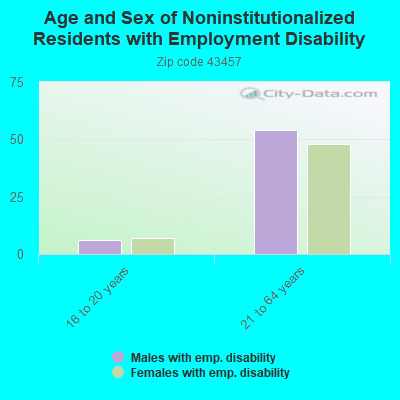
Unemployed: 1.4%
Mean travel time to work (commute): 30.0 minutes
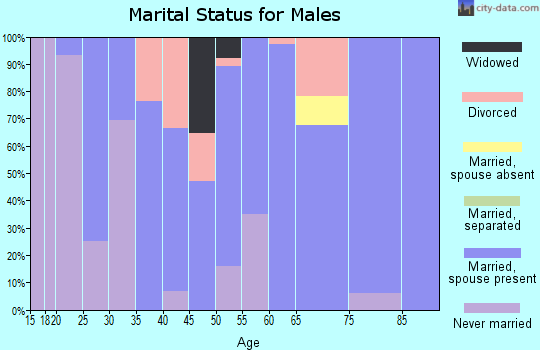
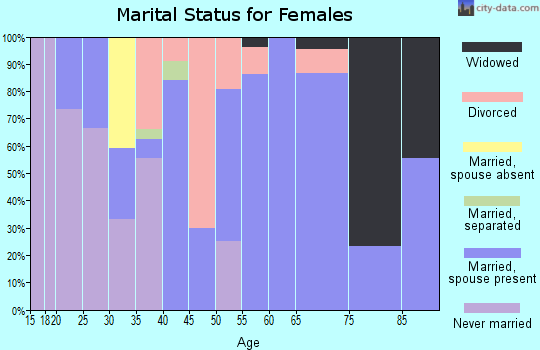
For population 15 years and over in 43457:
Never married: 21.8%
Now married: 52.0%
Separated: 0.6%
Widowed: 5.4%
Divorced: 20.3%
Zip code 43457 compared to state average:
Unemployed percentage below state average.
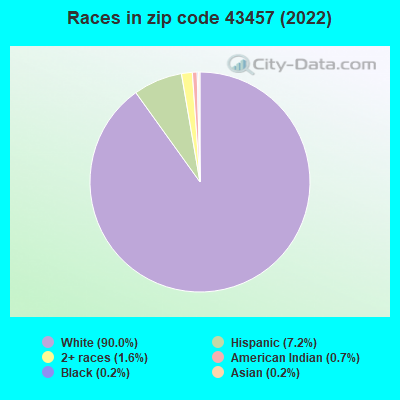
Black race population percentage significantly below state average.
Hispanic race population percentage above state average.
Median age above state average.
Foreign-born population percentage significantly below state average.
Renting percentage significantly below state average.
Length of stay since moving in significantly above state average.
Number of college students below state average.
Percentage of population with a bachelor's degree or higher significantly below state average.
Averages for the 2020 tax year for zip code 43457, filed in 2021:
Average Adjusted Gross Income (AGI) in 2020: $49,615 (Individual Income Tax Returns)
Here:
$49,615
State:
$67,288
Salary/wage: $44,332 (reported on 82.7% of returns)
Here:
$44,332
State:
$55,628
(% of AGI for various income ranges: 1096.5% for AGIs below $25k, 3549.4% for AGIs $25k-50k, 6218.2% for AGIs $50k-75k, 8886.0% for AGIs $75k-100k, 15900.0% for AGIs $100k-200k)
Taxable interest for individuals: $627 (reported on 20.0% of returns)
This zip code:
$627
Ohio:
$1,518
(% of AGI for various income ranges: 10.0% for AGIs below $25k, 21.1% for AGIs $25k-50k, 14.5% for AGIs $50k-75k, 8.0% for AGIs $75k-100k, 38.0% for AGIs $100k-200k)
Ordinary dividends: $1,350 (reported on 10.7% of returns)
Here:
$1,350
State:
$7,167
(% of AGI for various income ranges: 18.2% for AGIs below $25k, 25.5% for AGIs $50k-75k, 98.0% for AGIs $100k-200k)
Net capital gain/loss in AGI: +$8,575 (reported on 10.7% of returns)
Here:
+$8,575
State:
+$18,919
(% of AGI for various income ranges: 145.5% for AGIs $50k-75k, 1062.0% for AGIs $100k-200k)
Profit/loss from business: +$7,638 (reported on 10.7% of returns)
Here:
+$7,638
State:
+$13,744
(% of AGI for various income ranges: 133.5% for AGIs below $25k, 86.1% for AGIs $25k-50k, 458.0% for AGIs $75k-100k)
Taxable individual retirement arrangement distribution: $9,312 (reported on 10.7% of returns)
43457:
$9,312
Ohio:
$18,876
(% of AGI for various income ranges: 180.0% for AGIs below $25k, 399.1% for AGIs $50k-75k)
Earned income credit: $1,864 (reported on 14.7% of returns)
Here:
$1,864
State:
$2,304
(% of AGI for various income ranges: 72.9% for AGIs below $25k, 45.0% for AGIs $25k-50k)
Percentage of individuals using paid preparers for their 2020 taxes: 96.0%
Here:
96%
State:
94%
(% for various income ranges: 95.8% for AGIs below $25k, 95.5% for AGIs $25k-50k, 92.9% for AGIs $50k-75k, 100.0% for AGIs $75k-100k, 100.0% for AGIs $100k-200k)
Averages for the 2012 tax year for zip code 43457, filed in 2013:
Average Adjusted Gross Income (AGI) in 2012: $40,541 (Individual Income Tax Returns)
Here:
$40,541
State:
$54,926
Salary/wage: $37,420 (reported on 82.2% of returns)
Here:
$37,420
State:
$45,869
(% of AGI for various income ranges: 72.5% for AGIs below $25k, 78.7% for AGIs $25k-50k, 75.7% for AGIs $50k-75k, 75.4% for AGIs $75k-100k, 74.5% for AGIs $100k-200k)
Taxable interest for individuals: $626 (reported on 26.0% of returns)
This zip code:
$626
Ohio:
$1,297
(% of AGI for various income ranges: 0.8% for AGIs below $25k, 0.6% for AGIs $25k-50k, 0.2% for AGIs $50k-75k, 0.4% for AGIs $75k-100k, 0.1% for AGIs $100k-200k)
Ordinary dividends: $1,336 (reported on 15.1% of returns)
Here:
$1,336
State:
$5,821
(% of AGI for various income ranges: 0.9% for AGIs below $25k, 0.8% for AGIs $25k-50k, 0.8% for AGIs $75k-100k)
Net capital gain/loss in AGI: +$62 (reported on 11.0% of returns)
Here:
+$62
State:
+$11,232
(% of AGI for various income ranges: 0.3% for AGIs $75k-100k)
Profit/loss from business: +$4,200 (reported on 12.3% of returns)
Here:
+$4,200
State:
+$12,773
(% of AGI for various income ranges: 4.3% for AGIs below $25k, 1.7% for AGIs $25k-50k, 1.3% for AGIs $50k-75k)
Taxable individual retirement arrangement distribution: $8,600 (reported on 12.3% of returns)
43457:
$8,600
Ohio:
$14,511
(% of AGI for various income ranges: 3.9% for AGIs below $25k, 4.0% for AGIs $25k-50k, 5.0% for AGIs $50k-75k)
Total itemized deductions: $15,822 (24% of AGI, reported on 24.7% of returns)
Here:
$15,822
State:
$21,278
Here:
24.4% of AGI
State:
18.8% of AGI
(% of AGI for various income ranges: 11.1% for AGIs $25k-50k, 9.0% for AGIs $50k-75k, 10.4% for AGIs $75k-100k, 13.4% for AGIs $100k-200k)
Charity contributions: $2,100 (reported on 15.1% of returns)
Here:
$2,100
State:
$3,943
(% of AGI for various income ranges: 0.7% for AGIs $25k-50k, 0.5% for AGIs $50k-75k, 1.1% for AGIs $75k-100k, 1.4% for AGIs $100k-200k)
Taxes paid: $4,889 (reported on 24.7% of returns)
43457:
$4,889
State:
$9,568
(% of AGI for various income ranges: 2.7% for AGIs $25k-50k, 2.3% for AGIs $50k-75k, 3.5% for AGIs $75k-100k, 5.4% for AGIs $100k-200k)
Earned income credit: $2,250 (reported on 19.2% of returns)
Here:
$2,250
State:
$2,285
(% of AGI for various income ranges: 6.9% for AGIs below $25k, 0.8% for AGIs $25k-50k)
Percentage of individuals using paid preparers for their 2012 taxes: 60.3%
Here:
60%
State:
51%
(% for various income ranges: 57.1% for AGIs below $25k, 60.9% for AGIs $25k-50k, 60.0% for AGIs $50k-75k, 57.1% for AGIs $75k-100k, 80.0% for AGIs $100k-200k)
Averages for the 2004 tax year for zip code 43457, filed in 2005:
Average Adjusted Gross Income (AGI) in 2004: $35,818 (Individual Income Tax Returns)
Here:
$35,818
State:
$44,480
Salary/wage: $34,162 (reported on 88.2% of returns)
Here:
$34,162
State:
$39,198
(% of AGI for various income ranges: 97.2% for AGIs below $10k, 78.6% for AGIs $10k-25k, 85.5% for AGIs $25k-50k, 86.5% for AGIs $50k-75k, 85.8% for AGIs $75k-100k, 71.8% for AGIs over 100k)
Taxable interest for individuals: $792 (reported on 37.5% of returns)
This zip code:
$792
Ohio:
$1,532
(% of AGI for various income ranges: 2.2% for AGIs below $10k, 2.0% for AGIs $10k-25k, 1.0% for AGIs $25k-50k, 0.4% for AGIs $50k-75k, 0.2% for AGIs $75k-100k, 0.5% for AGIs over 100k)
Taxable dividends: $685 (reported on 18.5% of returns)
Here:
$685
State:
$3,496
(% of AGI for various income ranges: 1.2% for AGIs below $10k, 1.0% for AGIs $10k-25k, 0.3% for AGIs $25k-50k, 0.4% for AGIs $50k-75k, 0.1% for AGIs $75k-100k)
Profit/loss from business: +$1,165 (reported on 11.0% of returns)
Here:
+$1,165
State:
+$10,813
(% of AGI for various income ranges: -10.2% for AGIs below $10k, -0.5% for AGIs $10k-25k, 1.4% for AGIs $25k-50k, -0.4% for AGIs $50k-75k, 1.5% for AGIs $75k-100k)
Profit/loss from farming: +$622 (reported on 4.8% of returns)
Here:
+$622
State:
-$3,706
Total itemized deductions: $12,173 (21% of AGI, reported on 25.4% of returns)
Here:
$12,173
State:
$17,503
Here:
20.9% of AGI
State:
20.8% of AGI
(% of AGI for various income ranges: 5.1% for AGIs $10k-25k, 6.3% for AGIs $25k-50k, 9.7% for AGIs $50k-75k, 12.8% for AGIs $75k-100k, 14.1% for AGIs over 100k)
Charity contributions deductions: $1,833 (3% of AGI, reported on 21.0% of returns)
Here:
$1,833
State:
$3,087
Here:
3.1% of AGI
State:
3.4% of AGI
(% of AGI for various income ranges: 0.6% for AGIs $10k-25k, 0.6% for AGIs $25k-50k, 1.3% for AGIs $50k-75k, 1.8% for AGIs $75k-100k, 2.0% for AGIs over 100k)
Total tax: $3,784 (reported on 79.4% of returns)
43457:
$3,784
State:
$6,781
(% of AGI for various income ranges: 3.5% for AGIs below $10k, 4.0% for AGIs $10k-25k, 7.3% for AGIs $25k-50k, 9.4% for AGIs $50k-75k, 10.8% for AGIs $75k-100k, 12.6% for AGIs over 100k)
Earned income credit: $1,828 (reported on 11.3% of returns)
Here:
$1,828
State:
$1,696
Percentage of individuals using paid preparers for their 2004 taxes: 57.8%
Here:
58%
State:
55%
(% for various income ranges: 47.9% for AGIs below $10k, 58.3% for AGIs $10k-25k, 55.6% for AGIs $25k-50k, 65.6% for AGIs $50k-75k, 68.0% for AGIs $75k-100k, 68.4% for AGIs over 100k)
Household received Food Stamps/SNAP in the past 12 months: 21 Household did not receive Food Stamps/SNAP in the past 12 months: 497
Women who did not have a birth in the past 12 months: 208 (160 now married, 47 unmarried)
Housing units in zip code 43457 with a mortgage: 305 (73 second mortgage, 2 home equity loan, 68 both second mortgage and home equity loan) Median monthly owner costs for units with a mortgage: $1,114 Median monthly owner costs for units without a mortgage: $523
Residents with income below the poverty level in 2022:
This zip code:
14.8%
Whole state:
13.4%
Residents with income below 50% of the poverty level in 2022:
This zip code:
5.7%
Whole state:
7.0%
Median number of rooms in houses and condos:
Here:
7.0
State:
6.7
Median number of rooms in apartments:
Here:
6.9
State:
4.4
Notable locations in this zip code not listed on our city pages
Size of family households: 123 2-persons, 52 3-persons, 72 4-persons, 44 5-persons, 9 6-persons, 1 7-or-more-persons
Size of nonfamily households: 130 1-person, 84 2-persons, 2 3-persons
264 married couples with children.
25 single-parent households (7 men, 18 women).
94.4% of residents of 43457 zip code speak English at home.
6.6% of residents speak Spanish at home (58% very well, 42% not at all).
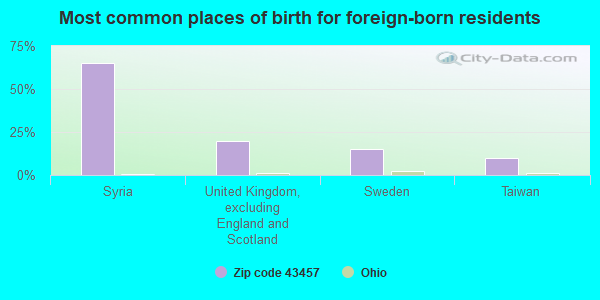
Foreign born population: 20 (1.6%) (100.0% of them are naturalized citizens)
This zip code:
1.6%
Whole state:
5.0%
65%Syria
20%United Kingdom, excluding England and Scotland
15%Sweden
10%Taiwan
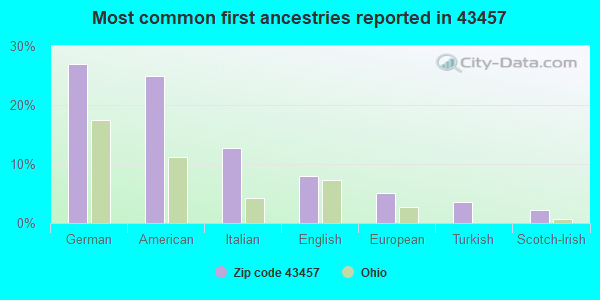
27%German
25%American
13%Italian
8%English
5%European
4%Turkish
2%Scotch-Irish
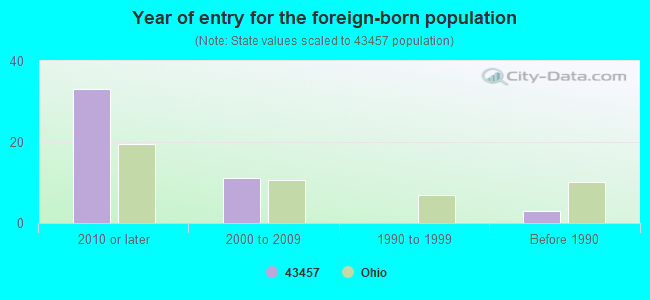
Year of entry for the foreign-born population
332010 or later
112000 to 2009
01990 to 1999
3Before 1990
Facilities with environmental interests located in this zip code:
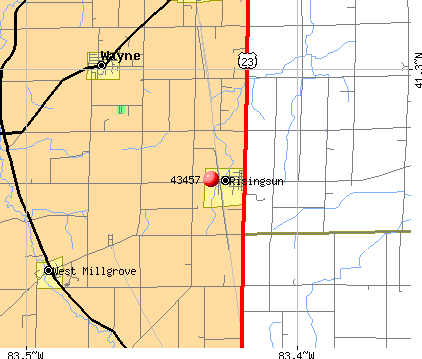
CHARTER STEEL INC (6255 US HIGHWAY 23 SOUTH in RISING SUN, OH)
AIR MAJOR (AIRS/AFS) STATE MASTER (Ohio general info) - AIR MAJOR, RCRA-OHR000040790, HAZARDOUS WASTE PROGRAM Conditionally Exempt Small Quantity Generators, less than 100 kg/month of hazardous waste (Resource Conservation and Recovery Act (tracking hazardous waste)) TRI REPORTER (Tracking of toxic chemicals releasing facilities) Business SIC classification: STEEL WORKS, BLAST FURNACES (INCLUDING COKE OVENS), AND ROLLING MILLS; METAL HEAT TREATING Organizations: CHARTER MFG. CO. INC. (CONTACT/OWNER)
, CHARTER MANUFACTURING CO INC (CONTACT/OWNER)
Alternative names: CHARTER STEEL - RISINGSUN
CHARTER STEEL - RISINGSUN (6255 US RTE. 23 S. in RISINGSUN, OH)
CRITERIA AND HAZARDOUS AIR POLLUTANT INVENTORY (Inventory of air pollution sources) Business SIC classification: STEEL WORKS, BLAST FURNACES (INCLUDING COKE OVENS), AND ROLLING MILLS
Housing units lacking complete plumbing facilities: 7.5% Housing units lacking complete kitchen facilities: 8.4%
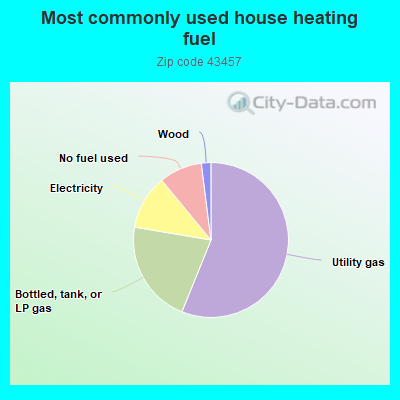
56.3%Utility gas
21.6%Bottled, tank, or LP gas
11.4%Electricity
9.0%No fuel used
2.0%Wood
Population in 1990: 1,756.
Place of birth for U.S.-born residents:
This state: 1,044
Midwest: 99
South: 73
West: 13
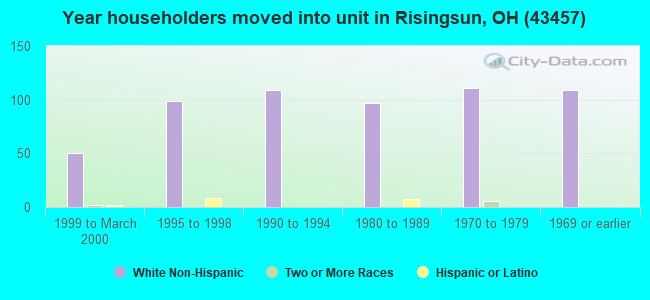
71% of the 43457 zip code residents lived in the same house 5 years ago. Out of people who lived in different houses, 66% lived in this county. Out of people who lived in different counties, 50% lived in Ohio.
93% of the 43457 zip code residents lived in the same house 1 year ago. Out of people who lived in different houses, 87% moved from this county. Out of people who lived in different houses, 10% moved from different state.
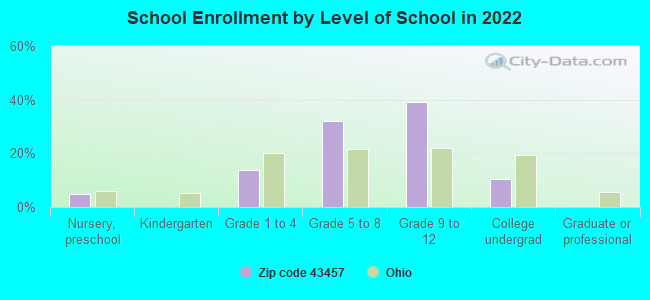
Private vs. public school enrollment:
Students in private schools in grades 1 to 8 (elementary and middle school): 14
Here:
14.4%
Ohio:
16.0%
Students in private schools in grades 9 to 12 (high school): 14
Here:
17.2%
Ohio:
13.1%
Students in private undergraduate colleges:
Here:
0.0%
Ohio:
22.3%
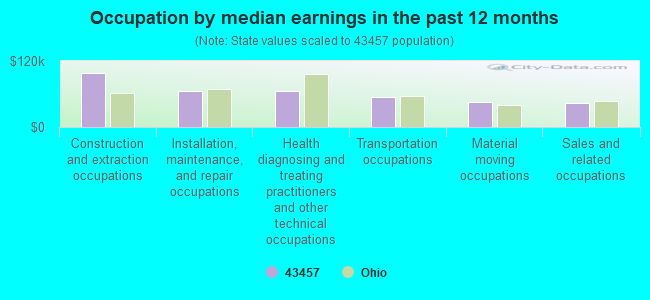
Occupation by median earnings in the past 12 months ($)
97,424Construction and extraction occupations
66,021Installation, maintenance, and repair occupations
64,777Health diagnosing and treating practitioners and other technical occupations
53,723Transportation occupations
44,668Material moving occupations
43,954Sales and related occupations
Top industries in this zip code by the number of employees in 2005:
Health Care and Social Assistance: Offices of Physicians (except Mental Health Specialists) (10-19 employees: 1 establishment)
Other Services (except Public Administration): Religious Organizations (1-4: 4)
Construction: New Single-Family Housing Construction (except Operative Builders) (5-9: 1)
Administrative and Support and Waste Management and Remediation Services: Landscaping Services (1-4: 2)
Construction: Drywall and Insulation Contractors (1-4: 1)
Wholesale Trade: Wholesale Trade Agents and Brokers (1-4: 1)
Home Mortgage Disclosure Act Aggregated Statistics For Year 2009 (Based on 4 partial tracts)
A) FHA, FSA/RHS & VA Home Purchase Loans
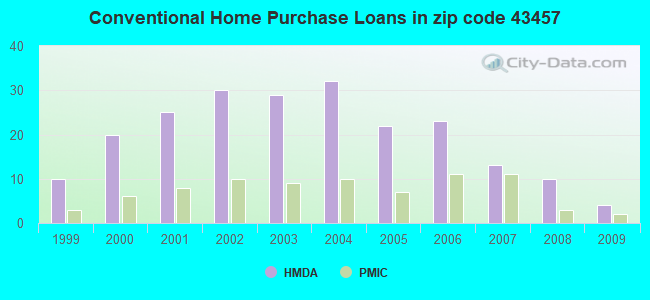
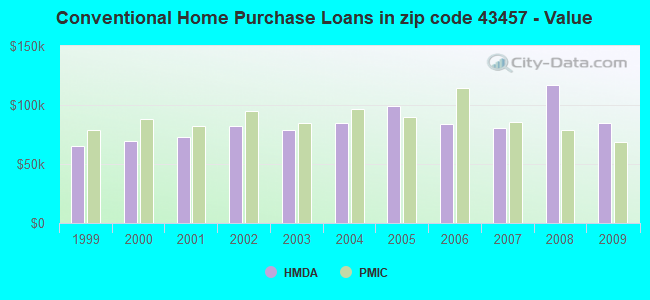
B) Conventional Home Purchase Loans
C) Refinancings
D) Home Improvement Loans
F) Non-occupant Loans on < 5 Family Dwellings (A B C & D)
G) Loans On Manufactured Home Dwelling (A B C & D)
Number
Average Value
Number
Average Value
Number
Average Value
Number
Average Value
Number
Average Value
Number
Average Value
LOANS ORIGINATED
9
$101,867
4
$84,738
32
$105,692
2
$39,740
1
$58,470
1
$42,030
APPLICATIONS APPROVED, NOT ACCEPTED
0
$0
0
$0
3
$104,453
0
$0
0
$0
0
$0
APPLICATIONS DENIED
0
$0
2
$74,915
13
$108,578
1
$14,620
0
$0
1
$125,620
APPLICATIONS WITHDRAWN
0
$0
0
$0
5
$108,718
0
$0
0
$0
0
$0
FILES CLOSED FOR INCOMPLETENESS
0
$0
0
$0
1
$82,220
1
$10,960
0
$0
0
$0
Aggregated Statistics For Year 2008 (Based on 4 partial tracts)
A) FHA, FSA/RHS & VA Home Purchase Loans
B) Conventional Home Purchase Loans
C) Refinancings
D) Home Improvement Loans
F) Non-occupant Loans on < 5 Family Dwellings (A B C & D)
G) Loans On Manufactured Home Dwelling (A B C & D)
Number
Average Value
Number
Average Value
Number
Average Value
Number
Average Value
Number
Average Value
Number
Average Value
LOANS ORIGINATED
6
$97,755
10
$117,352
25
$84,618
3
$35,327
3
$171,910
2
$63,725
APPLICATIONS APPROVED, NOT ACCEPTED
0
$0
0
$0
5
$83,228
1
$21,930
0
$0
0
$0
APPLICATIONS DENIED
1
$42,940
3
$82,530
24
$96,404
6
$64,333
2
$38,600
1
$92,270
APPLICATIONS WITHDRAWN
1
$105,980
0
$0
4
$110,202
0
$0
0
$0
0
$0
FILES CLOSED FOR INCOMPLETENESS
0
$0
0
$0
1
$52,530
0
$0
0
$0
0
$0
Aggregated Statistics For Year 2007 (Based on 4 partial tracts)
A) FHA, FSA/RHS & VA Home Purchase Loans
B) Conventional Home Purchase Loans
C) Refinancings
D) Home Improvement Loans
F) Non-occupant Loans on < 5 Family Dwellings (A B C & D)
G) Loans On Manufactured Home Dwelling (A B C & D)
Number
Average Value
Number
Average Value
Number
Average Value
Number
Average Value
Number
Average Value
Number
Average Value
LOANS ORIGINATED
2
$93,870
13
$80,256
32
$85,136
6
$35,707
5
$72,266
2
$65,550
APPLICATIONS APPROVED, NOT ACCEPTED
0
$0
1
$70,350
10
$96,339
2
$44,310
1
$95,930
1
$103,240
APPLICATIONS DENIED
0
$0
7
$75,894
45
$95,867
11
$39,534
2
$68,750
4
$40,770
APPLICATIONS WITHDRAWN
0
$0
2
$70,805
20
$114,840
3
$106,283
0
$0
1
$84,050
FILES CLOSED FOR INCOMPLETENESS
0
$0
0
$0
2
$95,245
0
$0
0
$0
0
$0
Aggregated Statistics For Year 2006 (Based on 4 partial tracts)
A) FHA, FSA/RHS & VA Home Purchase Loans
B) Conventional Home Purchase Loans
C) Refinancings
D) Home Improvement Loans
F) Non-occupant Loans on < 5 Family Dwellings (A B C & D)
G) Loans On Manufactured Home Dwelling (A B C & D)
Number
Average Value
Number
Average Value
Number
Average Value
Number
Average Value
Number
Average Value
Number
Average Value
LOANS ORIGINATED
4
$96,270
23
$83,594
55
$86,260
9
$24,972
5
$68,794
4
$66,235
APPLICATIONS APPROVED, NOT ACCEPTED
0
$0
3
$72,630
8
$109,918
2
$20,330
0
$0
1
$91,820
APPLICATIONS DENIED
1
$100,040
5
$80,214
45
$102,069
10
$28,824
2
$162,390
3
$90,447
APPLICATIONS WITHDRAWN
1
$93,640
4
$66,122
22
$102,240
1
$59,380
2
$84,050
1
$142,520
FILES CLOSED FOR INCOMPLETENESS
0
$0
1
$96,840
5
$98,852
0
$0
0
$0
0
$0
Aggregated Statistics For Year 2005 (Based on 4 partial tracts)
A) FHA, FSA/RHS & VA Home Purchase Loans
B) Conventional Home Purchase Loans
C) Refinancings
D) Home Improvement Loans
F) Non-occupant Loans on < 5 Family Dwellings (A B C & D)
G) Loans On Manufactured Home Dwelling (A B C & D)
Number
Average Value
Number
Average Value
Number
Average Value
Number
Average Value
Number
Average Value
Number
Average Value
LOANS ORIGINATED
1
$120,600
22
$98,814
48
$89,723
5
$34,534
5
$61,212
1
$80,400
APPLICATIONS APPROVED, NOT ACCEPTED
0
$0
4
$89,190
13
$83,665
0
$0
0
$0
0
$0
APPLICATIONS DENIED
0
$0
9
$67,048
50
$95,197
11
$42,483
2
$86,335
6
$68,368
APPLICATIONS WITHDRAWN
0
$0
5
$92,364
21
$92,230
5
$73,728
1
$57,100
1
$32,430
FILES CLOSED FOR INCOMPLETENESS
0
$0
2
$86,565
5
$89,350
1
$51,160
0
$0
0
$0
Aggregated Statistics For Year 2004 (Based on 4 partial tracts)
A) FHA, FSA/RHS & VA Home Purchase Loans
B) Conventional Home Purchase Loans
C) Refinancings
D) Home Improvement Loans
F) Non-occupant Loans on < 5 Family Dwellings (A B C & D)
G) Loans On Manufactured Home Dwelling (A B C & D)
Number
Average Value
Number
Average Value
Number
Average Value
Number
Average Value
Number
Average Value
Number
Average Value
LOANS ORIGINATED
2
$91,590
32
$84,379
55
$88,470
5
$26,494
6
$60,527
3
$86,183
APPLICATIONS APPROVED, NOT ACCEPTED
0
$0
4
$78,455
17
$85,986
1
$116,940
0
$0
1
$127,900
APPLICATIONS DENIED
0
$0
10
$86,381
49
$87,715
15
$43,975
0
$0
4
$76,628
APPLICATIONS WITHDRAWN
0
$0
3
$83,747
23
$98,172
5
$85,696
1
$98,210
0
$0
FILES CLOSED FOR INCOMPLETENESS
0
$0
1
$99,580
6
$115,037
0
$0
0
$0
0
$0
Aggregated Statistics For Year 2003 (Based on 4 partial tracts)
A) FHA, FSA/RHS & VA Home Purchase Loans
B) Conventional Home Purchase Loans
C) Refinancings
D) Home Improvement Loans
F) Non-occupant Loans on < 5 Family Dwellings (A B C & D)
Number
Average Value
Number
Average Value
Number
Average Value
Number
Average Value
Number
Average Value
LOANS ORIGINATED
4
$90,448
29
$78,916
91
$87,675
8
$20,441
10
$54,405
APPLICATIONS APPROVED, NOT ACCEPTED
0
$0
7
$89,207
14
$99,386
2
$36,770
0
$0
APPLICATIONS DENIED
0
$0
12
$63,837
39
$83,231
9
$30,910
2
$49,105
APPLICATIONS WITHDRAWN
0
$0
3
$83,747
20
$84,965
2
$25,125
0
$0
FILES CLOSED FOR INCOMPLETENESS
0
$0
3
$119,987
5
$98,852
1
$27,410
0
$0
Aggregated Statistics For Year 2002 (Based on 4 partial tracts)
A) FHA, FSA/RHS & VA Home Purchase Loans
B) Conventional Home Purchase Loans
C) Refinancings
D) Home Improvement Loans
F) Non-occupant Loans on < 5 Family Dwellings (A B C & D)
Number
Average Value
Number
Average Value
Number
Average Value
Number
Average Value
Number
Average Value
LOANS ORIGINATED
1
$131,100
30
$82,589
63
$103,280
7
$16,380
9
$71,058
APPLICATIONS APPROVED, NOT ACCEPTED
0
$0
6
$66,008
13
$92,238
1
$18,270
0
$0
APPLICATIONS DENIED
1
$51,620
8
$73,659
44
$90,914
7
$10,050
1
$89,080
APPLICATIONS WITHDRAWN
0
$0
1
$125,620
20
$82,886
1
$25,120
0
$0
FILES CLOSED FOR INCOMPLETENESS
0
$0
1
$136,130
8
$93,359
0
$0
1
$43,400
Aggregated Statistics For Year 2001 (Based on 4 partial tracts)
A) FHA, FSA/RHS & VA Home Purchase Loans
B) Conventional Home Purchase Loans
C) Refinancings
D) Home Improvement Loans
F) Non-occupant Loans on < 5 Family Dwellings (A B C & D)
Number
Average Value
Number
Average Value
Number
Average Value
Number
Average Value
Number
Average Value
LOANS ORIGINATED
4
$89,418
25
$72,978
71
$78,190
3
$24,210
6
$67,073
APPLICATIONS APPROVED, NOT ACCEPTED
0
$0
3
$66,083
16
$85,222
3
$11,117
0
$0
APPLICATIONS DENIED
0
$0
11
$53,903
43
$81,682
9
$13,958
1
$57,560
APPLICATIONS WITHDRAWN
0
$0
1
$61,670
23
$77,517
2
$50,020
1
$46,590
FILES CLOSED FOR INCOMPLETENESS
0
$0
1
$84,960
5
$77,108
0
$0
0
$0
Aggregated Statistics For Year 2000 (Based on 4 partial tracts)
A) FHA, FSA/RHS & VA Home Purchase Loans
B) Conventional Home Purchase Loans
C) Refinancings
D) Home Improvement Loans
F) Non-occupant Loans on < 5 Family Dwellings (A B C & D)
Number
Average Value
Number
Average Value
Number
Average Value
Number
Average Value
Number
Average Value
LOANS ORIGINATED
2
$92,730
20
$69,068
33
$83,913
8
$24,496
5
$34,260
APPLICATIONS APPROVED, NOT ACCEPTED
0
$0
5
$49,152
16
$70,404
6
$21,088
2
$77,885
APPLICATIONS DENIED
0
$0
15
$57,435
36
$59,359
15
$27,377
2
$42,025
APPLICATIONS WITHDRAWN
0
$0
1
$44,310
10
$66,510
3
$14,923
1
$44,310
FILES CLOSED FOR INCOMPLETENESS
0
$0
1
$36,540
6
$87,477
0
$0
0
$0
Aggregated Statistics For Year 1999 (Based on 2 partial tracts)
A) FHA, FSA/RHS & VA Home Purchase Loans
B) Conventional Home Purchase Loans
C) Refinancings
D) Home Improvement Loans
F) Non-occupant Loans on < 5 Family Dwellings (A B C & D)
Detailed PMIC statistics for the following Tracts:0221.00
2002 - 2018 National Fire Incident Reporting System (NFIRS) incidents
According to the data from the years 2002 - 2018 the average number of fire incidents per year is 16. The highest number of fires - 27 took place in 2016, and the least - 1 in 2002. The data has a rising trend.
When looking into fire subcategories, the most incidents belonged to: Structure Fires (51.8%), and Outside Fires (34.3%).
Fire incident types reported to NFIRS in Zip Code 43457


+$622
-$3,706
 Nearest zip codes: 43467, 43406, 43466, 44830, 44841, 43435.


 According to the data from the years 2002 - 2018 the average number of fire incidents per year is 16. The highest number of fires - 27 took place in 2016, and the least - 1 in 2002. The data has a rising trend.
 When looking into fire subcategories, the most incidents belonged to: Structure Fires (51.8%), and Outside Fires (34.3%).