Estimated zip code population in 2022: 20,183 Zip code population in 2010: 20,873 Zip code population in 2000: 16,776
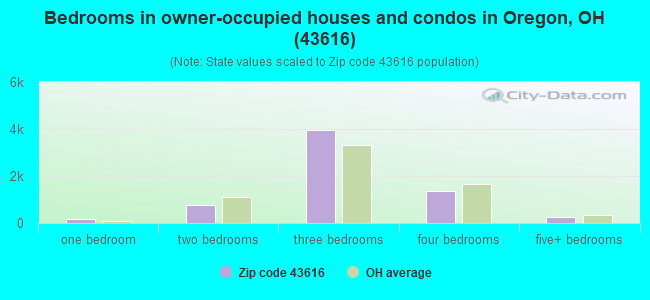
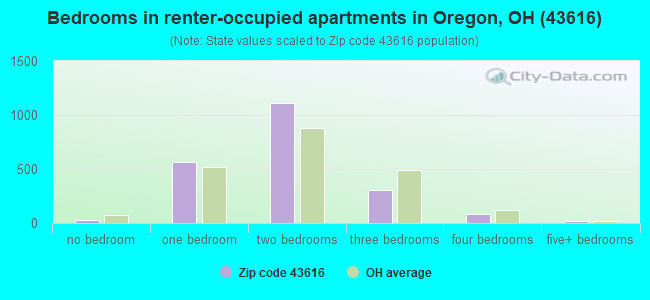
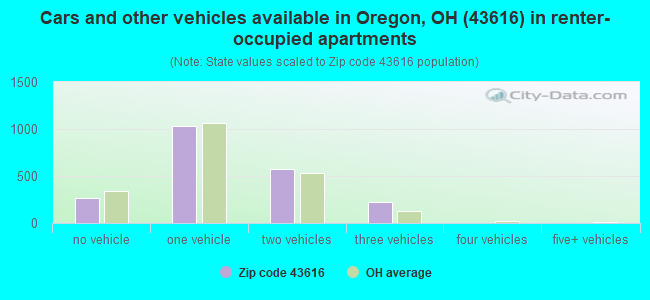
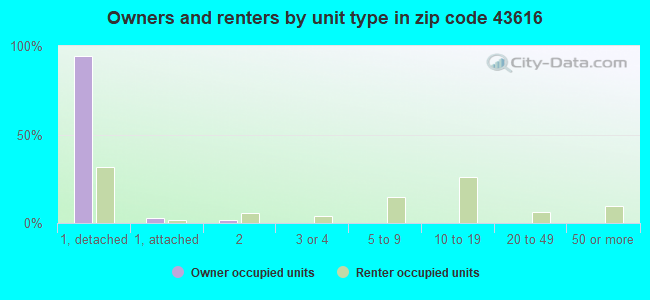
Houses and condos: 8,993 Renter-occupied apartments: 2,090
% of renters here:
24%
State:
33%
March 2022 cost of living index in zip code 43616: 92.0 (less than average, U.S. average is 100)
Land area: 40.0 sq. mi. Water area: 1.9 sq. mi.
Population density: 504 people per square mile
(low).
OSM Map
General Map
Google Map
MSN Map
OSM Map
General Map
Google Map
MSN Map
OSM Map
General Map
Google Map
MSN Map
OSM Map
General Map
Google Map
MSN Map
Please wait while loading the map...
Real estate property taxes paid for housing units in 2022:
This zip code:
1.5% ($2,875)
Ohio:
1.3% ($2,639)
Median real estate property taxes paid for housing units with mortgages in 2022: $3,120 (1.5%) Median real estate property taxes paid for housing units with no mortgage in 2022: $2,634 (1.5%)
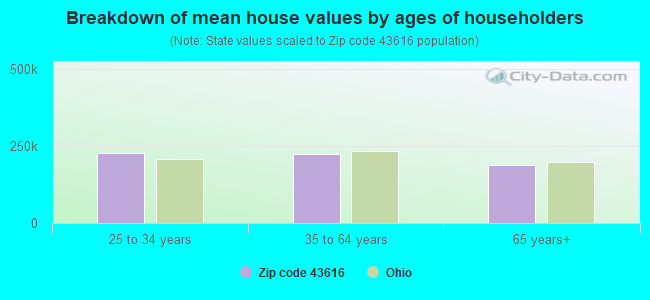
Estimated median house/condo value in 2022: $193,967
43616:
$193,967
Ohio:
$204,100
According to our research of Ohio and other state lists, there were 17 registered sex offenders living in 43616 zip code as of April 27, 2024. The ratio of all residents to sex offenders in zip code 43616 is 1,231 to 1. The ratio of registered sex offenders to all residents in this zip code is lower than the state average.
Median resident age:
This zip code:
44.4 years
Ohio median age:
39.9 years
Average household size:
This zip code:
2.3 people
Ohio:
2.4 people
Averages for the 2020 tax year for zip code 43616, filed in 2021:
Average Adjusted Gross Income (AGI) in 2020: $61,149 (Individual Income Tax Returns)
Here:
$61,149
State:
$67,288
Salary/wage: $52,466 (reported on 79.9% of returns)
Here:
$52,466
State:
$55,628
(% of AGI for various income ranges: 1089.7% for AGIs below $25k, 3187.0% for AGIs $25k-50k, 5835.2% for AGIs $50k-75k, 8699.8% for AGIs $75k-100k, 16241.0% for AGIs $100k-200k, 58840.0% for AGIs over 200k)
Taxable interest for individuals: $1,184 (reported on 27.3% of returns)
This zip code:
$1,184
Ohio:
$1,518
(% of AGI for various income ranges: 14.6% for AGIs below $25k, 29.7% for AGIs $25k-50k, 36.1% for AGIs $50k-75k, 55.7% for AGIs $75k-100k, 97.9% for AGIs $100k-200k, 745.0% for AGIs over 200k)
Ordinary dividends: $3,205 (reported on 17.3% of returns)
Here:
$3,205
State:
$7,167
(% of AGI for various income ranges: 18.9% for AGIs below $25k, 31.2% for AGIs $25k-50k, 75.0% for AGIs $50k-75k, 73.2% for AGIs $75k-100k, 175.1% for AGIs $100k-200k, 1913.8% for AGIs over 200k)
Net capital gain/loss in AGI: +$11,082 (reported on 14.5% of returns)
Here:
+$11,082
State:
+$18,919
(% of AGI for various income ranges: 9.0% for AGIs below $25k, 23.8% for AGIs $25k-50k, 51.5% for AGIs $50k-75k, 123.7% for AGIs $75k-100k, 353.8% for AGIs $100k-200k, 14368.8% for AGIs over 200k)
Profit/loss from business: +$9,956 (reported on 10.4% of returns)
Here:
+$9,956
State:
+$13,744
(% of AGI for various income ranges: 56.2% for AGIs below $25k, 78.4% for AGIs $25k-50k, 83.7% for AGIs $50k-75k, 161.9% for AGIs $75k-100k, 337.5% for AGIs $100k-200k, 2930.0% for AGIs over 200k)
Taxable individual retirement arrangement distribution: $17,750 (reported on 12.1% of returns)
43616:
$17,750
Ohio:
$18,876
(% of AGI for various income ranges: 76.2% for AGIs below $25k, 153.2% for AGIs $25k-50k, 265.6% for AGIs $50k-75k, 489.5% for AGIs $75k-100k, 733.3% for AGIs $100k-200k, 3906.2% for AGIs over 200k)
Self-employed (Keogh) retirement plans: $19,733 (reported on 0.3% of returns)
43616:
$19,733
Ohio:
$24,898
(% of AGI for various income ranges: 58.6% for AGIs $100k-200k)
Total itemized deductions: $28,286 (reported on 4.6% of returns)
Here:
$28,286
State:
$33,869
(% of AGI for various income ranges: 40.1% for AGIs below $25k, 71.2% for AGIs $25k-50k, 167.2% for AGIs $50k-75k, 286.1% for AGIs $75k-100k, 380.7% for AGIs $100k-200k, 4011.2% for AGIs over 200k)
Charity contributions: $8,416 (reported on 3.5% of returns)
Here:
$8,416
State:
$14,577
(% of AGI for various income ranges: 9.3% for AGIs $25k-50k, 29.6% for AGIs $50k-75k, 58.0% for AGIs $75k-100k, 102.2% for AGIs $100k-200k, 1365.0% for AGIs over 200k)
Taxes paid: $6,776 (reported on 4.5% of returns)
43616:
$6,776
State:
$7,681
(% of AGI for various income ranges: 2.1% for AGIs below $25k, 10.2% for AGIs $25k-50k, 40.9% for AGIs $50k-75k, 80.4% for AGIs $75k-100k, 119.0% for AGIs $100k-200k, 797.5% for AGIs over 200k)
Earned income credit: $2,140 (reported on 11.7% of returns)
Here:
$2,140
State:
$2,304
(% of AGI for various income ranges: 67.8% for AGIs below $25k, 50.5% for AGIs $25k-50k)
Percentage of individuals using paid preparers for their 2020 taxes: 93.6%
Here:
94%
State:
94%
(% for various income ranges: 92.7% for AGIs below $25k, 94.8% for AGIs $25k-50k, 93.3% for AGIs $50k-75k, 94.2% for AGIs $75k-100k, 93.9% for AGIs $100k-200k, 92.3% for AGIs over 200k)
Averages for the 2012 tax year for zip code 43616, filed in 2013:
Average Adjusted Gross Income (AGI) in 2012: $51,037 (Individual Income Tax Returns)
Here:
$51,037
State:
$54,926
Salary/wage: $45,605 (reported on 83.1% of returns)
Here:
$45,605
State:
$45,869
(% of AGI for various income ranges: 68.9% for AGIs below $25k, 74.2% for AGIs $25k-50k, 73.4% for AGIs $50k-75k, 79.3% for AGIs $75k-100k, 81.1% for AGIs $100k-200k, 49.9% for AGIs over 200k)
Taxable interest for individuals: $971 (reported on 33.1% of returns)
This zip code:
$971
Ohio:
$1,297
(% of AGI for various income ranges: 1.4% for AGIs below $25k, 0.8% for AGIs $25k-50k, 0.6% for AGIs $50k-75k, 0.4% for AGIs $75k-100k, 0.4% for AGIs $100k-200k, 0.9% for AGIs over 200k)
Ordinary dividends: $2,699 (reported on 18.5% of returns)
Here:
$2,699
State:
$5,821
(% of AGI for various income ranges: 1.3% for AGIs below $25k, 0.9% for AGIs $25k-50k, 0.7% for AGIs $50k-75k, 0.8% for AGIs $75k-100k, 0.8% for AGIs $100k-200k, 2.3% for AGIs over 200k)
Net capital gain/loss in AGI: +$1,922 (reported on 12.3% of returns)
Here:
+$1,922
State:
+$11,232
(% of AGI for various income ranges: 0.2% for AGIs $50k-75k, 0.5% for AGIs $75k-100k, 0.8% for AGIs $100k-200k, 1.8% for AGIs over 200k)
Profit/loss from business: +$11,393 (reported on 9.9% of returns)
Here:
+$11,393
State:
+$12,773
(% of AGI for various income ranges: 3.7% for AGIs below $25k, 1.9% for AGIs $25k-50k, 1.7% for AGIs $50k-75k, 1.1% for AGIs $75k-100k, 2.0% for AGIs $100k-200k, 5.4% for AGIs over 200k)
Taxable individual retirement arrangement distribution: $13,009 (reported on 12.4% of returns)
43616:
$13,009
Ohio:
$14,511
(% of AGI for various income ranges: 4.8% for AGIs below $25k, 3.0% for AGIs $25k-50k, 3.3% for AGIs $50k-75k, 2.7% for AGIs $75k-100k, 2.9% for AGIs $100k-200k, 3.4% for AGIs over 200k)
Self-employment retirement plans: $16,825 (reported on 0.4% of returns)
43616:
$16,825
Ohio:
$20,257
(% of AGI for various income ranges: 0.5% for AGIs $100k-200k)
Total itemized deductions: $17,803 (20% of AGI, reported on 34.7% of returns)
Here:
$17,803
State:
$21,278
Here:
20.1% of AGI
State:
18.8% of AGI
(% of AGI for various income ranges: 8.4% for AGIs below $25k, 8.3% for AGIs $25k-50k, 11.9% for AGIs $50k-75k, 13.4% for AGIs $75k-100k, 14.8% for AGIs $100k-200k, 12.9% for AGIs over 200k)
Charity contributions: $2,529 (reported on 27.3% of returns)
Here:
$2,529
State:
$3,943
(% of AGI for various income ranges: 0.6% for AGIs below $25k, 0.9% for AGIs $25k-50k, 1.3% for AGIs $50k-75k, 1.3% for AGIs $75k-100k, 1.8% for AGIs $100k-200k, 1.8% for AGIs over 200k)
Taxes paid: $7,908 (reported on 34.7% of returns)
43616:
$7,908
State:
$9,568
(% of AGI for various income ranges: 1.7% for AGIs below $25k, 2.8% for AGIs $25k-50k, 4.6% for AGIs $50k-75k, 5.8% for AGIs $75k-100k, 7.8% for AGIs $100k-200k, 7.6% for AGIs over 200k)
Earned income credit: $2,104 (reported on 13.6% of returns)
Here:
$2,104
State:
$2,285
(% of AGI for various income ranges: 4.9% for AGIs below $25k, 0.8% for AGIs $25k-50k)
Percentage of individuals using paid preparers for their 2012 taxes: 54.1%
Here:
54%
State:
51%
(% for various income ranges: 47.6% for AGIs below $25k, 53.7% for AGIs $25k-50k, 60.9% for AGIs $50k-75k, 60.4% for AGIs $75k-100k, 58.2% for AGIs $100k-200k, 69.2% for AGIs over 200k)
Averages for the 2004 tax year for zip code 43616, filed in 2005:
Average Adjusted Gross Income (AGI) in 2004: $41,825 (Individual Income Tax Returns)
Here:
$41,825
State:
$44,480
Salary/wage: $39,527 (reported on 84.8% of returns)
Here:
$39,527
State:
$39,198
(% of AGI for various income ranges: 82.6% for AGIs below $10k, 68.7% for AGIs $10k-25k, 76.1% for AGIs $25k-50k, 83.4% for AGIs $50k-75k, 88.6% for AGIs $75k-100k, 77.2% for AGIs over 100k)
Taxable interest for individuals: $1,320 (reported on 47.8% of returns)
This zip code:
$1,320
Ohio:
$1,532
(% of AGI for various income ranges: 4.6% for AGIs below $10k, 3.6% for AGIs $10k-25k, 1.9% for AGIs $25k-50k, 0.9% for AGIs $50k-75k, 0.9% for AGIs $75k-100k, 1.1% for AGIs over 100k)
Taxable dividends: $1,613 (reported on 23.7% of returns)
Here:
$1,613
State:
$3,496
(% of AGI for various income ranges: 2.4% for AGIs below $10k, 1.5% for AGIs $10k-25k, 0.9% for AGIs $25k-50k, 0.7% for AGIs $50k-75k, 0.5% for AGIs $75k-100k, 1.2% for AGIs over 100k)
Net capital gain/loss: +$2,695 (reported on 16.4% of returns)
Here:
+$2,695
State:
+$8,582
(% of AGI for various income ranges: -0.7% for AGIs below $10k, -0.3% for AGIs $10k-25k, 0.4% for AGIs $25k-50k, 0.8% for AGIs $50k-75k, 0.6% for AGIs $75k-100k, 3.3% for AGIs over 100k)
Profit/loss from business: +$8,804 (reported on 9.5% of returns)
Here:
+$8,804
State:
+$10,813
(% of AGI for various income ranges: 2.1% for AGIs below $10k, 2.2% for AGIs $10k-25k, 1.7% for AGIs $25k-50k, 1.6% for AGIs $50k-75k, 1.4% for AGIs $75k-100k, 3.3% for AGIs over 100k)
IRA payment deduction: $2,860 (reported on 1.7% of returns)
43616:
$2,860
Ohio:
$2,794
(% of AGI for various income ranges: 0.1% for AGIs $10k-25k, 0.2% for AGIs $25k-50k, 0.1% for AGIs $50k-75k, 0.1% for AGIs $75k-100k, 0.1% for AGIs over 100k)
Self-employed pension: $9,829 (reported on 0.4% of returns)
Here:
$9,829
Ohio:
$13,981
Total itemized deductions: $15,045 (22% of AGI, reported on 40.0% of returns)
Here:
$15,045
State:
$17,503
Here:
22.0% of AGI
State:
20.8% of AGI
(% of AGI for various income ranges: 9.2% for AGIs below $10k, 8.1% for AGIs $10k-25k, 11.9% for AGIs $25k-50k, 15.5% for AGIs $50k-75k, 16.9% for AGIs $75k-100k, 16.8% for AGIs over 100k)
Charity contributions deductions: $1,934 (3% of AGI, reported on 34.6% of returns)
Here:
$1,934
State:
$3,087
Here:
2.7% of AGI
State:
3.4% of AGI
(% of AGI for various income ranges: 0.4% for AGIs below $10k, 0.7% for AGIs $10k-25k, 1.3% for AGIs $25k-50k, 1.6% for AGIs $50k-75k, 1.8% for AGIs $75k-100k, 2.3% for AGIs over 100k)
Total tax: $5,030 (reported on 78.9% of returns)
43616:
$5,030
State:
$6,781
(% of AGI for various income ranges: 2.1% for AGIs below $10k, 3.9% for AGIs $10k-25k, 7.4% for AGIs $25k-50k, 9.3% for AGIs $50k-75k, 10.0% for AGIs $75k-100k, 14.9% for AGIs over 100k)
Earned income credit: $1,568 (reported on 10.2% of returns)
Here:
$1,568
State:
$1,696
Percentage of individuals using paid preparers for their 2004 taxes: 55.7%
Here:
56%
State:
55%
(% for various income ranges: 41.6% for AGIs below $10k, 54.0% for AGIs $10k-25k, 61.3% for AGIs $25k-50k, 62.3% for AGIs $50k-75k, 57.1% for AGIs $75k-100k, 57.4% for AGIs over 100k)
Likely homosexual households (counted as self-reported same-sex unmarried-partner households)
Lesbian couples: 0.0% of all households
Gay men: 0.3% of all households
Household received Food Stamps/SNAP in the past 12 months: 702 Household did not receive Food Stamps/SNAP in the past 12 months: 7,869
Women who had a birth in the past 12 months: 353 (279 now married, 76 unmarried) Women who did not have a birth in the past 12 months: 3,774 (1,649 now married, 2,125 unmarried)
Housing units in zip code 43616 with a mortgage: 3,834 (498 second mortgage, 41 home equity loan, 451 both second mortgage and home equity loan) Houses without a mortgage: 259
Median monthly owner costs for units with a mortgage: $1,356 Median monthly owner costs for units without a mortgage: $539
Residents with income below the poverty level in 2022:
This zip code:
7.2%
Whole state:
13.4%
Residents with income below 50% of the poverty level in 2022:
This zip code:
4.1%
Whole state:
7.0%
Median number of rooms in houses and condos:
Here:
6.4
State:
6.7
Median number of rooms in apartments:
Here:
4.2
State:
4.4
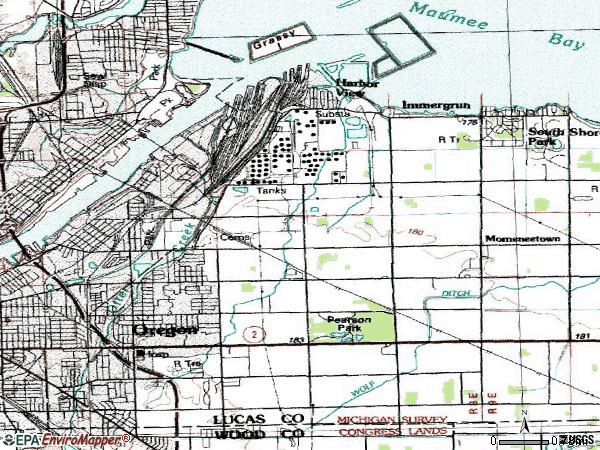
Notable locations in this zip code not listed on our city pages
Notable locations in zip code 43616: Homestead Yard (A), Harbor View Yacht Club (B), Sundance Kid Drive-In (C), Scottish Links Golf Course (D), Lifestar Ambulance Service (E), Lucas County Emergency Medical Services Lifesquad 8 (F), Oregon Fire Department Station 1 (G), Oregon Fire Department Station 2 (H), Oregon Fire Department Station 3 (I), University of Toledo Lake Erie Research Center (J). Display/hide their locations on the map
Shopping Centers: Oregon Plaza Shopping Center (1), Oregon Country Squire Shopping Center (2), Peter Navarre Shopping Center (3). Display/hide their locations on the map
Cemeteries: North Oregon Cemetery (1), Willow Cemetery (2), Beth Shalom Cemetery (3), Saint Ignatius Catholic Cemetery (4). Display/hide their locations on the map
Lakes, reservoirs, and swamps: Goose Pond (A), Wolf Creek Pond (B), Long Pond (C), Lacourse Pond (D), Cedar Creek Pond (E), Carrington Pond (F), Widgeon Pond (G), Pintail Pond (H). Display/hide their locations on the map
Parks in zip code 43616 include: Mallard Club Marsh State Wildlife Area (1), Cedar Point National Wildlife Refuge (2), Maumee Bay State Park (3), Pearson Metropark (4). Display/hide their locations on the map
In group quarters: 335 (-1 institutionalized population)
Size of family households: 2,631 2-persons, 1,277 3-persons, 1,125 4-persons, 273 5-persons, 181 6-persons, 22 7-or-more-persons
Size of nonfamily households: 2,552 1-person, 432 2-persons, 74 3-persons
2,573 married couples with children.
940 single-parent households (206 men, 734 women).
94.9% of residents of 43616 zip code speak English at home.
2.8% of residents speak Spanish at home (53% very well, 28% well, 12% not well, 6% not at all).
0.9% of residents speak other Indo-European language at home (81% very well, 17% well, 1% not well).
1.2% of residents speak Asian or Pacific Island language at home (32% very well, 4% well, 64% not well).
0.5% of residents speak other language at home (82% very well, 9% well, 8% not well).
Foreign born population: 550 (2.7%) (58.5% of them are naturalized citizens)
This zip code:
2.7%
Whole state:
5.0%
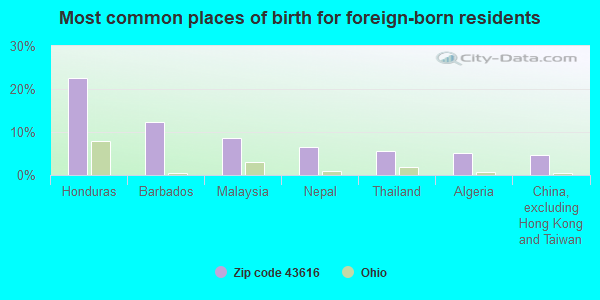
23%Honduras
12%Barbados
9%Malaysia
7%Nepal
6%Thailand
5%Algeria
5%China, excluding Hong Kong and Taiwan
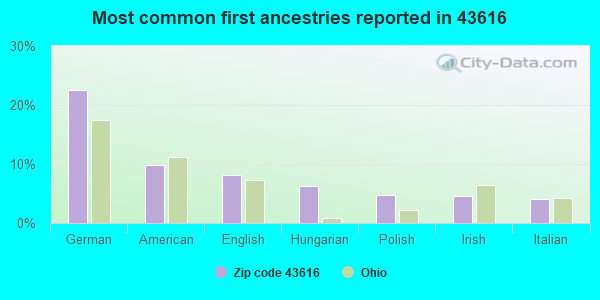
23%German
10%American
8%English
6%Hungarian
5%Polish
5%Irish
4%Italian
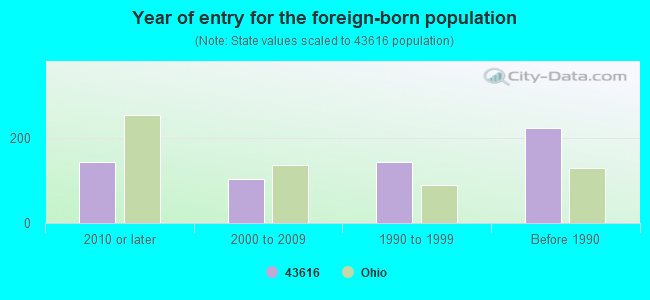
Year of entry for the foreign-born population
1432010 or later
1022000 to 2009
1431990 to 1999
222Before 1990
Major facilities with environmental interests located in this zip code:
BP OIL CO TOLEDO REFINERY (4001 CEDAR POINT RD. in OREGON, OH)
AIR MAJOR (AIRS/AFS) - ICIS-05-2004-3998, FORMAL ENFORCEMENT ACTION, ICIS-, ENFORCEMENT/COMPLIANCE ACTIVITY OIL CONTROL (Facility Response Plan for oil discharge) ENFORCEMENT/COMPLIANCE ACTIVITY (Integrated Compliance Information System) - ICIS-05-1984-0082, FORMAL ENFORCEMENT ACTION, ICIS-05-1979-0022, ICIS-05-2000-0586, ICIS-05-2000-0628, (Integrated Compliance Information System) - ICIS-05-1984-0082, FORMAL ENFORCEMENT ACTION, ICIS-05-1979-0022, ICIS-05-2000-0586, ICIS-05-2000-0628, COMPLIANCE ACTIVITY (Tracking inspections of insecticide, fungicide, and rodenticide, and toxic substances) CRITERIA AND HAZARDOUS AIR POLLUTANT INVENTORY (Inventory of air pollution sources) STATE MASTER (Ohio general info) - PCS-OH0002461, National Pollutant Discharge Elimination System Permit, RCRA-OHD005057542, HAZARDOUS WASTE PROGRAM, AIR MAJOR, EPCRA, TRIS-43616SHLCM4001C, TRI REPORTER National Pollutant Discharge Elimination System MAJOR (Tracking pollutant discharge elimination systems) - permit AIR MAJOR ("Best Available" air pollution technologies tracking) HAZARDOUS WASTE BIENNIAL REPORTER (Resource Conservation and Recovery Act (tracking hazardous waste)) Large Quantity Generators, more that 1000 kg of hazardous waste/month (Resource Conservation and Recovery Act (tracking hazardous waste)) - notification TSD (Resource Conservation and Recovery Act (tracking hazardous waste)) - notification TRI REPORTER (Tracking of toxic chemicals releasing facilities) Business SIC classification: PETROLEUM REFINING Business NAICS classification: PETROLEUM REFINERIES. Organizations: BP PRDUCTS NORTH AMERICA INC (CONTACT/GENERAL)
, BP PRODUCTS NORTH AMERICA, INC. (CONTACT/GENERAL)
, BP PRODUCTS NORTH AMERICA (CONTACT/OPERATOR)
, BP OIL COMPANY (CONTACT/OWNER)
, BP PRODUCTS NORTH AMERICA INC. (CONTACT/OWNER)
, BP OIL COMPANY (CONTACT/OWNER)
Alternative names: BP AMERICA INC. TOLEDO REFY., BP AMERICA INC. TOLEDO REFY., BP OIL COMPANY, BP OIL CO. TOLEDO REFINERY, BP OIL CO., TOLEDO REFINERY, BP OIL COMPANY , TOLEDO REFINERY, BP OIL NORTH AMERICA INC. TOLEDO REFINERY, BP TOLEDO, SOHIO - TOLEDO
BP OIL CO * (3369 NAVARRE AVE in OREGON, OH)
AIR MINOR (AIRS/AFS) STATE MASTER (Ohio general info) - RCRA-OHD987020054, HAZARDOUS WASTE PROGRAM, -48-5541-905-24, EPCRA STATE MASTER (Ohio general info) - RCRA-OHD987020054, HAZARDOUS WASTE PROGRAM, AIR MAJOR Conditionally Exempt Small Quantity Generators, less than 100 kg/month of hazardous waste (Resource Conservation and Recovery Act (tracking hazardous waste)) - notification Business SIC classification: GASOLINE SERVICE STATIONS Organizations: BP OIL COMPANY (CONTACT/OWNER)
Alternative names: BP OIL COMPANY #06824, BP OIL SITE 06824
ASPHALT MATERIALS INC (940 N WYNN RD in OREGON, OH)
OIL CONTROL (Facility Response Plan for oil discharge) CRITERIA AND HAZARDOUS AIR POLLUTANT INVENTORY (Inventory of air pollution sources) STATE MASTER (Ohio general info) - PCS-OH0122319, National Pollutant Discharge Elimination System Permit, AIR MAJOR, EPCRA National Pollutant Discharge Elimination System NON-MAJOR (Tracking pollutant discharge elimination systems) - permit Conditionally Exempt Small Quantity Generators, less than 100 kg/month of hazardous waste (Resource Conservation and Recovery Act (tracking hazardous waste)) - notification TRI REPORTER (Tracking of toxic chemicals releasing facilities) Business SIC classification: ASPHALT PAVING MIXTURES AND BLOCKS; SEWERAGE SYSTEMS Organizations: ASPHALT MATERIALS, INC. (CONTACT/GENERAL)
Alternative names: ASPHALT MATERIALS, INC. OREGON, OHIO, ASPHALT MATERIALS INC.
BP OIL CO (STARR AND WHEELING in OREGON, OH)
STATE MASTER (Ohio general info) - AIR MAJOR (Resource Conservation and Recovery Act (tracking hazardous waste)) Organizations: BP OIL COMPANY (CONTACT/OWNER)
Alternative names: BP OIL SITE 06857
BP OIL CO NO 06817 * (2255 NAVARRE AVE in OREGON, OH)
STATE MASTER (Ohio general info) - -48-5541-168-5, EPCRA (Resource Conservation and Recovery Act (tracking hazardous waste)) Organizations: BP OIL COMPANY (CONTACT/OWNER)
Alternative names: BP OIL SITE 06817
CEDAR POINT DEVELOPMENT LLC (1040 WYNN RD in OREGON, OH)
STATE MASTER (Ohio general info) - PCS-OH0135470, National Pollutant Discharge Elimination System Permit National Pollutant Discharge Elimination System NON-MAJOR (Tracking pollutant discharge elimination systems) - permit Business SIC classification: GENERAL WAREHOUSING AND STORAGE Organizations: ENVIROSAFE SERVICES OF OHIO (CONTACT/OWNER)
AMERICAN ENTERPRISES (5508 NAVARRE AVE in OREGON, OH)
STATE MASTER (Ohio general info) - RCRA-OHD986984342, HAZARDOUS WASTE PROGRAM Small Quantity Generators, between 100 kg and 1000 kg of hazardous waste/month (Resource Conservation and Recovery Act (tracking hazardous waste)) - notification Organizations: JAEGER DAVE (CONTACT/OWNER)
, UNKNOWN (CONTACT/OWNER)
ARAYCO INC (1810 OAKDALE AVE in OREGON, OH)
STATE MASTER (Ohio general info) - RCRA-OHR000038018, HAZARDOUS WASTE PROGRAM Conditionally Exempt Small Quantity Generators, less than 100 kg/month of hazardous waste (Resource Conservation and Recovery Act (tracking hazardous waste)) - notification
BAKERS CLASSIC PAINT & BODY SHOP (2234 NAVARRE AVE in OREGON, OH)
STATE MASTER (Ohio general info) - RCRA-OHD986985836, HAZARDOUS WASTE PROGRAM Small Quantity Generators, between 100 kg and 1000 kg of hazardous waste/month (Resource Conservation and Recovery Act (tracking hazardous waste)) - notification Organizations: BAKER RONALD L (CONTACT/OWNER)
, UNKNOWN (CONTACT/OWNER)
BASINGER BODY SHOP (1116 MAMBRINO ST in OREGON, OH)
STATE MASTER (Ohio general info) - RCRA-OHD987050341, HAZARDOUS WASTE PROGRAM Conditionally Exempt Small Quantity Generators, less than 100 kg/month of hazardous waste (Resource Conservation and Recovery Act (tracking hazardous waste)) - notification Organizations: BASINGER HORACE B (CONTACT/OWNER)
, HORACE B BASINGER (CONTACT/OWNER)
BP OIL CO SITE 06817 * (2285 NAVARRE AND I 280 in OREGON, OH)
STATE MASTER (Ohio general info) - AIR MAJOR, RCRA-OHD987027315, HAZARDOUS WASTE PROGRAM Conditionally Exempt Small Quantity Generators, less than 100 kg/month of hazardous waste (Resource Conservation and Recovery Act (tracking hazardous waste)) - notification Organizations: BP OIL COMPANY (CONTACT/OWNER)
Alternative names: BP OIL CO *
ALLTEL - OREGON (5410 NAVARRE in OREGON, OH)
(Integrated Compliance Information System) - ICIS-HQ-2000-6004, FORMAL ENFORCEMENT ACTION
Housing units lacking complete plumbing facilities: 0.8% Housing units lacking complete kitchen facilities: 0.7%
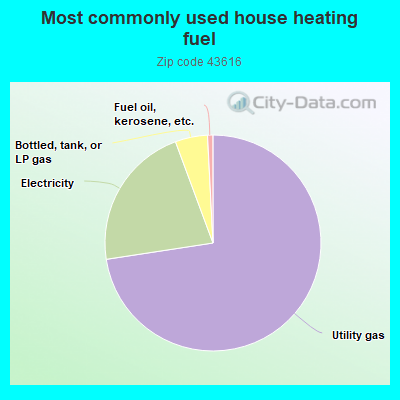
72.0%Utility gas
21.6%Electricity
4.8%Bottled, tank, or LP gas
0.8%Fuel oil, kerosene, etc.
Population in 1990: 15,713. Population change in the 1990s: +1,063 (+6.8%).
Place of birth for U.S.-born residents:
This state: 16,735
Northeast: 594
Midwest: 834
South: 863
West: 516
59% of the 43616 zip code residents lived in the same house 5 years ago. Out of people who lived in different houses, 74% lived in this county. Out of people who lived in different counties, 50% lived in Ohio.
95% of the 43616 zip code residents lived in the same house 1 year ago. Out of people who lived in different houses, 70% moved from this county. Out of people who lived in different houses, 24% moved from different county within same state. Out of people who lived in different houses, 10% moved from different state.
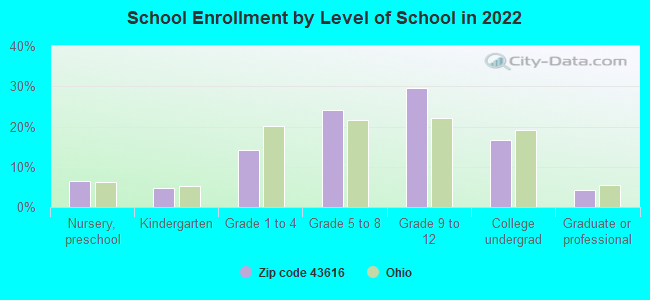
Private vs. public school enrollment:
Students in private schools in grades 1 to 8 (elementary and middle school): 78
Here:
5.2%
Ohio:
16.0%
Students in private schools in grades 9 to 12 (high school): 91
Here:
7.7%
Ohio:
13.1%
Students in private undergraduate colleges: 100
Here:
15.1%
Ohio:
22.3%
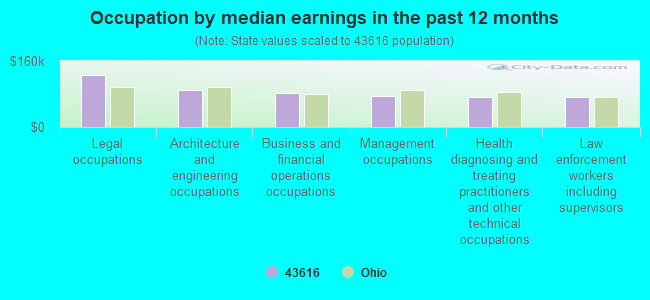
Occupation by median earnings in the past 12 months ($)
126,106Legal occupations
89,856Architecture and engineering occupations
83,038Business and financial operations occupations
75,012Management occupations
73,436Health diagnosing and treating practitioners and other technical occupations
72,643Law enforcement workers including supervisors
Companies with federal contracts located in this zip code:
E S WAGNER COMPANY (840 PATCHEN RD in OREGON, OH) : $273,560 in 3 contractsfrom 2000 to 2001
$193,943 with U.S. Army Corps of Engineers - civil program financing only for Construction of Structures and Facilities -- Other Non-Building Facilities. Taking place in IN. Signed on 2001-02-08. Completion date: 2001-09-30.
$40,106, same as above.Signed on 2000-08-22. Completion date: 2000-09-30.
$39,511 with U.S. Army Corps of Engineers - civil program financing only for Construction of Structures and Facilities -- Dams. Taking place in IN. Signed on 2000-08-22. Completion date: 2000-09-29.
TRANSPORTATION EQUIPMENT SALES (6401 SEAMAN ST in OREGON, OH; small business) : $171,580 in 16 contractsfrom 2003 to 2006
Contracts for Lease or Rental of Equipment -- Ground Effect Vehicles, Motor Vehicles, Trailers, and Cycles, Waste Treatment and Storage, Passenger Motor Charter Service by Air Force Signed by year:2000: $0; 2001: $0; 2002: $0; 2003: $52,728; 2004: $31,133; 2005: $77,236; 2006: $10,483.
Biggest contracts:
$28,971 with Air Force for Lease or Rental of Equipment -- Ground Effect Vehicles, Motor Vehicles, Trailers, and Cycles. Taking place in SC. Signed on 2005-09-30. Completion date: 2005-10-05.
$17,364 with Air Force for Lease or Rental of Equipment -- Ground Effect Vehicles, Motor Vehicles, Trailers, and Cycles. Taking place in TX. Signed on 2005-02-07. Completion date: 2005-09-30.
$14,924 with Air Force for Waste Treatment and Storage. Taking place in SC. Signed on 2004-10-01. Completion date: 2005-09-30.
$14,923 with Air Force for Passenger Motor Charter Service. Taking place in SC. Signed on 2003-10-01. Completion date: 2004-09-30.
Top industries in this zip code by the number of employees in 2005:
Health Care and Social Assistance: General Medical and Surgical Hospitals (over 1000 employees: 1 establishment, 500-999 employees: 1 establishment)
2003 - 2018 National Fire Incident Reporting System (NFIRS) incidents
Based on the data from the years 2003 - 2018 the average number of fires per year is 51. The highest number of fire incidents - 75 took place in 2003, and the least - 23 in 2017. The data has a declining trend.
When looking into fire subcategories, the most reports belonged to: Outside Fires (39.9%), and Structure Fires (23.4%).
Fire incident types reported to NFIRS in Zip Code 43616


 Nearest zip codes: 43434, 43619, 43611, 43468, 43412, 43408.


 Based on the data from the years 2003 - 2018 the average number of fires per year is 51. The highest number of fire incidents - 75 took place in 2003, and the least - 23 in 2017. The data has a declining trend.
 When looking into fire subcategories, the most reports belonged to: Outside Fires (39.9%), and Structure Fires (23.4%).