Estimated zip code population in 2022: 28,805 Zip code population in 2010: 29,090 Zip code population in 2000: 29,658
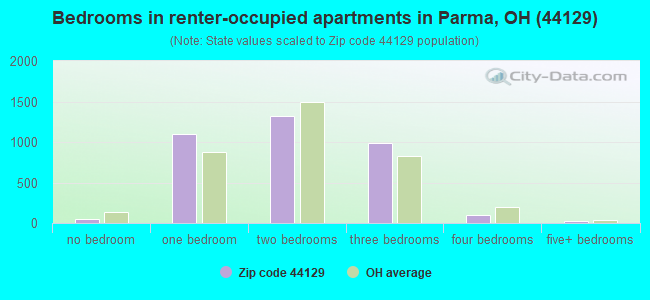
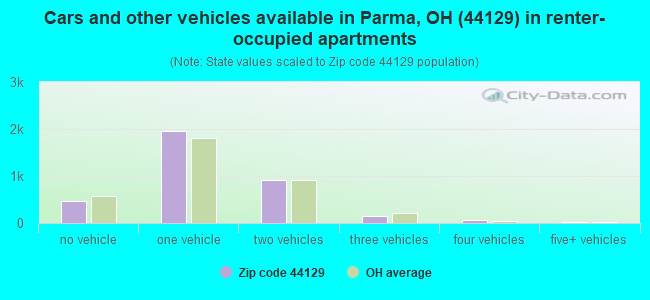
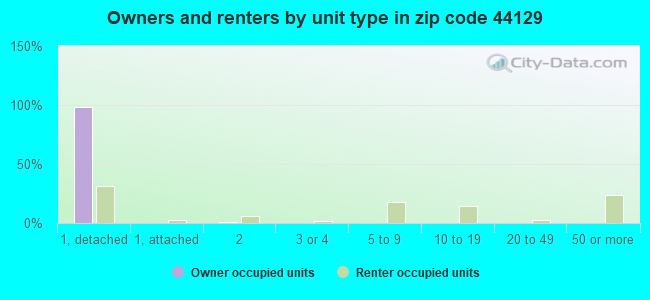
Houses and condos: 13,096 Renter-occupied apartments: 3,570
% of renters here:
29%
State:
33%
March 2022 cost of living index in zip code 44129: 94.6 (less than average, U.S. average is 100)
Land area: 5.9 sq. mi. Water area: 0.0 sq. mi.
Population density: 4,889 people per square mile
(average).
OSM Map
General Map
Google Map
MSN Map
OSM Map
General Map
Google Map
MSN Map
OSM Map
General Map
Google Map
MSN Map
OSM Map
General Map
Google Map
MSN Map
Please wait while loading the map...
Real estate property taxes paid for housing units in 2022:
This zip code:
1.9% ($3,001)
Ohio:
1.3% ($2,639)
Median real estate property taxes paid for housing units with mortgages in 2022: $3,104 (1.9%) Median real estate property taxes paid for housing units with no mortgage in 2022: $2,906 (1.9%)
Estimated median house/condo value in 2022: $156,777
44129:
$156,777
Ohio:
$204,100
According to our research of Ohio and other state lists, there were 21 registered sex offenders living in 44129 zip code as of April 27, 2024. The ratio of all residents to sex offenders in zip code 44129 is 1,385 to 1. The ratio of registered sex offenders to all residents in this zip code is much lower than the state average.
Median resident age:
This zip code:
39.8 years
Ohio median age:
39.9 years
Average household size:
This zip code:
2.3 people
Ohio:
2.4 people
Averages for the 2020 tax year for zip code 44129, filed in 2021:
Average Adjusted Gross Income (AGI) in 2020: $47,492 (Individual Income Tax Returns)
Here:
$47,492
State:
$67,288
Salary/wage: $43,470 (reported on 83.0% of returns)
Here:
$43,470
State:
$55,628
(% of AGI for various income ranges: 1181.5% for AGIs below $25k, 3650.2% for AGIs $25k-50k, 6554.3% for AGIs $50k-75k, 9963.1% for AGIs $75k-100k, 15836.8% for AGIs $100k-200k, 49613.3% for AGIs over 200k)
Taxable interest for individuals: $1,156 (reported on 24.1% of returns)
This zip code:
$1,156
Ohio:
$1,518
(% of AGI for various income ranges: 17.9% for AGIs below $25k, 23.7% for AGIs $25k-50k, 31.9% for AGIs $50k-75k, 74.5% for AGIs $75k-100k, 119.9% for AGIs $100k-200k, 1416.7% for AGIs over 200k)
Ordinary dividends: $2,742 (reported on 14.1% of returns)
Here:
$2,742
State:
$7,167
(% of AGI for various income ranges: 15.7% for AGIs below $25k, 22.0% for AGIs $25k-50k, 45.2% for AGIs $50k-75k, 104.0% for AGIs $75k-100k, 253.4% for AGIs $100k-200k, 2120.0% for AGIs over 200k)
Net capital gain/loss in AGI: +$5,263 (reported on 11.3% of returns)
Here:
+$5,263
State:
+$18,919
(% of AGI for various income ranges: 9.0% for AGIs below $25k, 17.6% for AGIs $25k-50k, 46.7% for AGIs $50k-75k, 96.7% for AGIs $75k-100k, 422.7% for AGIs $100k-200k, 10030.0% for AGIs over 200k)
Profit/loss from business: +$9,652 (reported on 11.7% of returns)
Here:
+$9,652
State:
+$13,744
(% of AGI for various income ranges: 105.6% for AGIs below $25k, 110.0% for AGIs $25k-50k, 116.4% for AGIs $50k-75k, 245.8% for AGIs $75k-100k, 361.0% for AGIs $100k-200k, 5666.7% for AGIs over 200k)
Taxable individual retirement arrangement distribution: $14,182 (reported on 8.9% of returns)
44129:
$14,182
Ohio:
$18,876
(% of AGI for various income ranges: 70.0% for AGIs below $25k, 103.0% for AGIs $25k-50k, 163.8% for AGIs $50k-75k, 309.9% for AGIs $75k-100k, 669.2% for AGIs $100k-200k, 4746.7% for AGIs over 200k)
Total itemized deductions: $27,758 (reported on 2.8% of returns)
Here:
$27,758
State:
$33,869
(% of AGI for various income ranges: 17.6% for AGIs below $25k, 41.2% for AGIs $25k-50k, 107.3% for AGIs $50k-75k, 259.2% for AGIs $75k-100k, 436.5% for AGIs $100k-200k, 5090.0% for AGIs over 200k)
Charity contributions: $6,519 (reported on 2.0% of returns)
Here:
$6,519
State:
$14,577
(% of AGI for various income ranges: 5.7% for AGIs $25k-50k, 14.7% for AGIs $50k-75k, 43.3% for AGIs $75k-100k, 70.4% for AGIs $100k-200k, 1736.7% for AGIs over 200k)
Taxes paid: $6,481 (reported on 2.7% of returns)
44129:
$6,481
State:
$7,681
(% of AGI for various income ranges: 1.7% for AGIs below $25k, 6.3% for AGIs $25k-50k, 29.5% for AGIs $50k-75k, 73.0% for AGIs $75k-100k, 106.0% for AGIs $100k-200k, 863.3% for AGIs over 200k)
Earned income credit: $2,173 (reported on 15.1% of returns)
Here:
$2,173
State:
$2,304
(% of AGI for various income ranges: 80.2% for AGIs below $25k, 57.2% for AGIs $25k-50k, 1.0% for AGIs $50k-75k)
Percentage of individuals using paid preparers for their 2020 taxes: 93.2%
Here:
93%
State:
94%
(% for various income ranges: 92.4% for AGIs below $25k, 93.9% for AGIs $25k-50k, 94.4% for AGIs $50k-75k, 91.7% for AGIs $75k-100k, 92.1% for AGIs $100k-200k, 100.0% for AGIs over 200k)
Averages for the 2012 tax year for zip code 44129, filed in 2013:
Average Adjusted Gross Income (AGI) in 2012: $41,281 (Individual Income Tax Returns)
Here:
$41,281
State:
$54,926
Salary/wage: $38,321 (reported on 85.3% of returns)
Here:
$38,321
State:
$45,869
(% of AGI for various income ranges: 73.7% for AGIs below $25k, 80.7% for AGIs $25k-50k, 82.6% for AGIs $50k-75k, 82.2% for AGIs $75k-100k, 79.2% for AGIs $100k-200k, 52.0% for AGIs over 200k)
Taxable interest for individuals: $1,025 (reported on 32.9% of returns)
This zip code:
$1,025
Ohio:
$1,297
(% of AGI for various income ranges: 1.4% for AGIs below $25k, 0.7% for AGIs $25k-50k, 0.7% for AGIs $50k-75k, 0.6% for AGIs $75k-100k, 0.7% for AGIs $100k-200k, 1.8% for AGIs over 200k)
Ordinary dividends: $2,278 (reported on 16.6% of returns)
Here:
$2,278
State:
$5,821
(% of AGI for various income ranges: 1.1% for AGIs below $25k, 0.7% for AGIs $25k-50k, 0.6% for AGIs $50k-75k, 0.7% for AGIs $75k-100k, 1.3% for AGIs $100k-200k, 2.6% for AGIs over 200k)
Net capital gain/loss in AGI: +$3,042 (reported on 10.2% of returns)
Here:
+$3,042
State:
+$11,232
(% of AGI for various income ranges: 0.1% for AGIs $25k-50k, 0.1% for AGIs $50k-75k, 0.3% for AGIs $75k-100k, 0.7% for AGIs $100k-200k, 13.1% for AGIs over 200k)
Profit/loss from business: +$9,180 (reported on 10.2% of returns)
Here:
+$9,180
State:
+$12,773
(% of AGI for various income ranges: 6.1% for AGIs below $25k, 2.2% for AGIs $25k-50k, 1.6% for AGIs $50k-75k, 1.6% for AGIs $75k-100k, 1.6% for AGIs $100k-200k, 1.1% for AGIs over 200k)
Taxable individual retirement arrangement distribution: $10,981 (reported on 10.4% of returns)
44129:
$10,981
Ohio:
$14,511
(% of AGI for various income ranges: 4.3% for AGIs below $25k, 2.6% for AGIs $25k-50k, 2.0% for AGIs $50k-75k, 2.3% for AGIs $75k-100k, 4.1% for AGIs $100k-200k)
Self-employment retirement plans: $10,700 (reported on 0.2% of returns)
44129:
$10,700
Ohio:
$20,257
(% of AGI for various income ranges: 0.2% for AGIs $50k-75k)
Total itemized deductions: $14,875 (22% of AGI, reported on 29.6% of returns)
Here:
$14,875
State:
$21,278
Here:
21.7% of AGI
State:
18.8% of AGI
(% of AGI for various income ranges: 6.9% for AGIs below $25k, 9.3% for AGIs $25k-50k, 11.0% for AGIs $50k-75k, 12.1% for AGIs $75k-100k, 13.3% for AGIs $100k-200k, 12.5% for AGIs over 200k)
Charity contributions: $1,883 (reported on 22.5% of returns)
Here:
$1,883
State:
$3,943
(% of AGI for various income ranges: 0.5% for AGIs below $25k, 0.8% for AGIs $25k-50k, 1.0% for AGIs $50k-75k, 1.2% for AGIs $75k-100k, 1.6% for AGIs $100k-200k, 1.6% for AGIs over 200k)
Taxes paid: $6,532 (reported on 29.5% of returns)
44129:
$6,532
State:
$9,568
(% of AGI for various income ranges: 1.7% for AGIs below $25k, 3.4% for AGIs $25k-50k, 4.7% for AGIs $50k-75k, 5.7% for AGIs $75k-100k, 7.0% for AGIs $100k-200k, 7.4% for AGIs over 200k)
Earned income credit: $2,094 (reported on 15.8% of returns)
Here:
$2,094
State:
$2,285
(% of AGI for various income ranges: 4.9% for AGIs below $25k, 0.8% for AGIs $25k-50k)
Percentage of individuals using paid preparers for their 2012 taxes: 49.7%
Here:
50%
State:
51%
(% for various income ranges: 45.4% for AGIs below $25k, 51.7% for AGIs $25k-50k, 53.4% for AGIs $50k-75k, 53.2% for AGIs $75k-100k, 51.9% for AGIs $100k-200k, 71.4% for AGIs over 200k)
Averages for the 2004 tax year for zip code 44129, filed in 2005:
Average Adjusted Gross Income (AGI) in 2004: $35,975 (Individual Income Tax Returns)
Here:
$35,975
State:
$44,480
Salary/wage: $34,570 (reported on 84.8% of returns)
Here:
$34,570
State:
$39,198
(% of AGI for various income ranges: 83.5% for AGIs below $10k, 68.7% for AGIs $10k-25k, 83.2% for AGIs $25k-50k, 85.3% for AGIs $50k-75k, 86.2% for AGIs $75k-100k, 73.1% for AGIs over 100k)
Taxable interest for individuals: $1,427 (reported on 51.1% of returns)
This zip code:
$1,427
Ohio:
$1,532
(% of AGI for various income ranges: 6.8% for AGIs below $10k, 4.3% for AGIs $10k-25k, 1.6% for AGIs $25k-50k, 1.4% for AGIs $50k-75k, 1.2% for AGIs $75k-100k, 2.7% for AGIs over 100k)
Taxable dividends: $1,571 (reported on 22.8% of returns)
Here:
$1,571
State:
$3,496
(% of AGI for various income ranges: 2.8% for AGIs below $10k, 1.6% for AGIs $10k-25k, 0.7% for AGIs $25k-50k, 0.7% for AGIs $50k-75k, 0.8% for AGIs $75k-100k, 1.8% for AGIs over 100k)
Net capital gain/loss: +$1,864 (reported on 14.6% of returns)
Here:
+$1,864
State:
+$8,582
(% of AGI for various income ranges: -2.1% for AGIs below $10k, 0.0% for AGIs $10k-25k, 0.2% for AGIs $25k-50k, 0.6% for AGIs $50k-75k, 0.9% for AGIs $75k-100k, 4.2% for AGIs over 100k)
Profit/loss from business: +$7,138 (reported on 9.3% of returns)
Here:
+$7,138
State:
+$10,813
(% of AGI for various income ranges: 6.7% for AGIs below $10k, 4.0% for AGIs $10k-25k, 1.7% for AGIs $25k-50k, 1.3% for AGIs $50k-75k, 0.9% for AGIs $75k-100k, 1.7% for AGIs over 100k)
IRA payment deduction: $2,688 (reported on 2.3% of returns)
44129:
$2,688
Ohio:
$2,794
(% of AGI for various income ranges: 0.3% for AGIs below $10k, 0.3% for AGIs $10k-25k, 0.2% for AGIs $25k-50k, 0.1% for AGIs $50k-75k, 0.1% for AGIs $75k-100k, 0.1% for AGIs over 100k)
Self-employed pension: $6,564 (reported on 0.3% of returns)
Here:
$6,564
Ohio:
$13,981
(% of AGI for various income ranges: 0.1% for AGIs $10k-25k, 0.0% for AGIs $50k-75k, 0.2% for AGIs $75k-100k)
Total itemized deductions: $12,877 (23% of AGI, reported on 36.6% of returns)
Here:
$12,877
State:
$17,503
Here:
22.8% of AGI
State:
20.8% of AGI
(% of AGI for various income ranges: 9.5% for AGIs below $10k, 7.7% for AGIs $10k-25k, 12.5% for AGIs $25k-50k, 15.0% for AGIs $50k-75k, 15.1% for AGIs $75k-100k, 14.1% for AGIs over 100k)
Charity contributions deductions: $1,462 (2% of AGI, reported on 30.5% of returns)
Here:
$1,462
State:
$3,087
Here:
2.5% of AGI
State:
3.4% of AGI
(% of AGI for various income ranges: 0.4% for AGIs below $10k, 0.6% for AGIs $10k-25k, 1.1% for AGIs $25k-50k, 1.4% for AGIs $50k-75k, 1.5% for AGIs $75k-100k, 1.9% for AGIs over 100k)
Total tax: $3,937 (reported on 79.1% of returns)
44129:
$3,937
State:
$6,781
(% of AGI for various income ranges: 2.3% for AGIs below $10k, 4.5% for AGIs $10k-25k, 7.3% for AGIs $25k-50k, 8.9% for AGIs $50k-75k, 10.2% for AGIs $75k-100k, 15.6% for AGIs over 100k)
Earned income credit: $1,470 (reported on 10.3% of returns)
Here:
$1,470
State:
$1,696
Percentage of individuals using paid preparers for their 2004 taxes: 52.6%
Here:
53%
State:
55%
(% for various income ranges: 44.2% for AGIs below $10k, 54.7% for AGIs $10k-25k, 54.8% for AGIs $25k-50k, 54.2% for AGIs $50k-75k, 52.0% for AGIs $75k-100k, 54.2% for AGIs over 100k)
Likely homosexual households (counted as self-reported same-sex unmarried-partner households)
Lesbian couples: 0.1% of all households
Gay men: 0.1% of all households
Household received Food Stamps/SNAP in the past 12 months: 1,664 Household did not receive Food Stamps/SNAP in the past 12 months: 10,700
Women who had a birth in the past 12 months: 164 (69 now married, 92 unmarried) Women who did not have a birth in the past 12 months: 6,307 (2,315 now married, 3,993 unmarried)
Housing units in zip code 44129 with a mortgage: 5,179 (382 second mortgage, 4 home equity loan, 345 both second mortgage and home equity loan) Houses without a mortgage: 206
Median monthly owner costs for units with a mortgage: $1,189 Median monthly owner costs for units without a mortgage: $540
Residents with income below the poverty level in 2022:
This zip code:
10.6%
Whole state:
13.4%
Residents with income below 50% of the poverty level in 2022:
This zip code:
5.3%
Whole state:
7.0%
Median number of rooms in houses and condos:
Here:
6.4
State:
6.7
Median number of rooms in apartments:
Here:
4.3
State:
4.4
Notable locations in this zip code not listed on our city pages
Notable locations in zip code 44129: Fern Hill Picnic Area (A), Ridgewood Country Club (B), Parma Police Station (C), Parma Municipal Court (D), Parma Fire Department Station 3 Headquarters (E), Parma Fire Department Station 1 (F), Saint Charles Parish Hall (G), Parma Ridge Branch Library (H), Parma Regional Library (I), Parma City Hall (J), Parmatown Towers (K). Display/hide their locations on the map
Shopping Centers: Parmatown Shopping Center (1), Brookridge Shopping Center (2), Pearl-Brook Shopping Center (3), Parmatown Mall Shopping Center (4), Ridge-Day Shopping Center (5). Display/hide their locations on the map
Churches in zip code 44129 include: Saint Charles Catholic Church (A), Ridgewood United Methodist Church (B), Bethany Evangelical Lutheran Church (C), First Baptist Church (D), Kingdom Hall of Jehovahs Witnesses (E), Living Word Foursquare Gospel Church of Parma (F), Parma Assembly of God Church (G), Ridge Road Evangelical Community Church (H). Display/hide their locations on the map
Parks in zip code 44129 include: Sandy Hook Park (1), Royalview Park (2), Selwick Park (3), Ridgewood Lake Park (4), Marlborough Park (5), Byers Field (6), Gerald Park (7), Regency Park (8). Display/hide their locations on the map
Tourist attraction (not listed on the city page) : Aladdin Castle (Amusement & Theme Parks; Parmatown Shp Centre).
2,850 married couples with children.
1,384 single-parent households (266 men, 1,118 women).
84.0% of residents of 44129 zip code speak English at home.
5.9% of residents speak Spanish at home (68% very well, 24% well, 8% not well).
7.9% of residents speak other Indo-European language at home (41% very well, 37% well, 12% not well, 10% not at all).
1.0% of residents speak Asian or Pacific Island language at home (77% very well, 5% well, 18% not well).
1.7% of residents speak other language at home (53% very well, 33% well, 9% not well, 5% not at all).
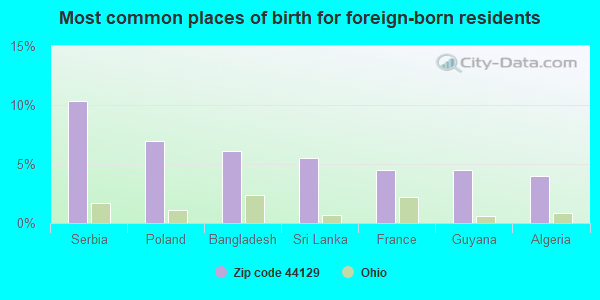
Foreign born population: 3,012 (10.5%) (59.8% of them are naturalized citizens)
Facilities with environmental interests located in this zip code:
BP AMOCO CO 22413 (6585 RIDGE RD in PARMA, OH)
AIR MINOR (AIRS/AFS) STATE MASTER (Ohio general info) - AIR MAJOR, -18-5541-168-10, EPCRA, RCRA-OHD987026481, HAZARDOUS WASTE PROGRAM Conditionally Exempt Small Quantity Generators, less than 100 kg/month of hazardous waste (Resource Conservation and Recovery Act (tracking hazardous waste)) - notification Business SIC classification: GASOLINE SERVICE STATIONS Organizations: BP OIL CO (CONTACT/OWNER)
, BP OIL COMPANY (CONTACT/OWNER)
Alternative names: BP OIL CO 04878, BP OIL COMPANY, NO. 04878, BP OIL CO SITE 04878, BP OIL COMPANY, NO. 04878
AMERITECH (7205 SOUTHINGTON DR in PARMA, OH)
STATE MASTER (Ohio general info) - -18-4811-227-43, EPCRA (Resource Conservation and Recovery Act (tracking hazardous waste)) Organizations: OHIO BELL TELEPHONE COMPANY (CONTACT/OWNER)
Alternative names: OHIO BELL TEL CO PARMA 885
BOB GILLINGHAM FORD INC (8383 BROOKPARK RD in PARMA, OH)
STATE MASTER (Ohio general info) - RCRA-OHD017758350, HAZARDOUS WASTE PROGRAM Small Quantity Generators, between 100 kg and 1000 kg of hazardous waste/month (Resource Conservation and Recovery Act (tracking hazardous waste)) - notification Organizations: FORD MOTOR COMPANY (CONTACT/OWNER)
, FORD MOTOR CO (CONTACT/OWNER)
Alternative names: GILLINGHAM BOB FORD INC
AMOCO FASTCHECK * (5796 PEARL RD in PARMA, OH)
STATE MASTER (Ohio general info) - -18-5541-943-10, EPCRA, RCRA-OHR000031245, HAZARDOUS WASTE PROGRAM, -1318458148, AIR MAJOR Conditionally Exempt Small Quantity Generators, less than 100 kg/month of hazardous waste (Resource Conservation and Recovery Act (tracking hazardous waste)) - notification Organizations: THE LYDEN CO (CONTACT/OWNER)
, LYDEN COMPANY (CONTACT/OWNER)
Alternative names: PARMA AMOCO
AXELROD CHRYSLER PLYMOUTH INC (6767 BROOKPARK RD in PARMA, OH)
STATE MASTER (Ohio general info) - EPCRA, RCRA-OHD010846806, HAZARDOUS WASTE PROGRAM Conditionally Exempt Small Quantity Generators, less than 100 kg/month of hazardous waste (Resource Conservation and Recovery Act (tracking hazardous waste)) - notification Organizations: PHIL AXELROD (CONTACT/OWNER)
BFI COLLISION CENTER INC (7115 BROOKPARK RD in PARMA, OH)
(Integrated Compliance Information System) - ICIS-HQ-1977-0027, FORMAL ENFORCEMENT ACTION Conditionally Exempt Small Quantity Generators, less than 100 kg/month of hazardous waste (Resource Conservation and Recovery Act (tracking hazardous waste)) - notification Organizations: GANLEY MAZDA VOLKSWAGON (CONTACT/OWNER)
BOSCH POWER TOOL CORP (5291 COMMERCE PKWY in PARMA, OH)
STATE MASTER (Ohio general info) - RCRA-OHD987036175, HAZARDOUS WASTE PROGRAM Small Quantity Generators, between 100 kg and 1000 kg of hazardous waste/month (Resource Conservation and Recovery Act (tracking hazardous waste)) - notification Organizations: BOSCH ROBERT POWER TOOL CORP (CONTACT/OWNER)
, ROBERT BOSCH POWER TOOL CORP (CONTACT/OWNER)
BP OIL CO (5804 RIDGE RD in PARMA, OH)
(Resource Conservation and Recovery Act (tracking hazardous waste))
B&B WRECKING AND EXCAV INC (5788 RIDGE RD in PARMA, OH)
COMPLIANCE ACTIVITY (Tracking inspections of insecticide, fungicide, and rodenticide, and toxic substances)
Housing units lacking complete plumbing facilities: 0.9% Housing units lacking complete kitchen facilities: 1.6%
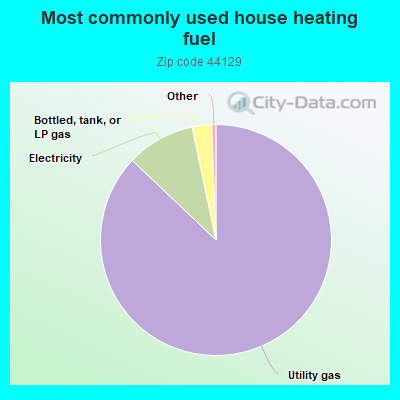
87.1%Utility gas
9.6%Electricity
2.7%Bottled, tank, or LP gas
Population in 1990: 30,370.
Place of birth for U.S.-born residents:
This state: 21,716
Northeast: 1,076
Midwest: 679
South: 1,298
West: 269
64% of the 44129 zip code residents lived in the same house 5 years ago. Out of people who lived in different houses, 80% lived in this county. Out of people who lived in different counties, 50% lived in Ohio.
88% of the 44129 zip code residents lived in the same house 1 year ago. Out of people who lived in different houses, 70% moved from this county. Out of people who lived in different houses, 9% moved from different county within same state. Out of people who lived in different houses, 14% moved from different state. Out of people who lived in different houses, 4% moved from abroad.
Private vs. public school enrollment:
Students in private schools in grades 1 to 8 (elementary and middle school): 407
Here:
20.6%
Ohio:
16.0%
Students in private schools in grades 9 to 12 (high school): 264
Here:
18.3%
Ohio:
13.1%
Students in private undergraduate colleges: 371
Here:
28.2%
Ohio:
22.3%
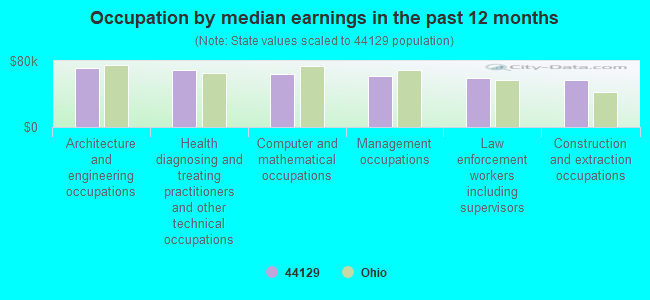
Occupation by median earnings in the past 12 months ($)
71,184Architecture and engineering occupations
69,218Health diagnosing and treating practitioners and other technical occupations
64,644Computer and mathematical occupations
62,098Management occupations
59,661Law enforcement workers including supervisors
56,551Construction and extraction occupations
Companies with federal contracts located in this zip code:
GREAT LAKES SALES & ASSOCIATES (6809 NIGHT VISTA DR in CLEVELAND, OH; small business) : $682,064 in 83 contractsfrom 2004 to 2006
Contracts for Semiconductor Devices and Associated Hardware, Microcircuits, Electronic, Relays and Solenoids, Switches, and moreby Defense Logistics Agency Signed by year:2000: $0; 2001: $0; 2002: $0; 2003: $0; 2004: $66,178; 2005: $421,411; 2006: $194,475.
Biggest contracts:
$55,935 with Defense Logistics Agency for Semiconductor Devices and Associated Hardware. Signed on 2005-06-10. Completion date: 2005-12-27.
$32,660, same as above.Signed on 2005-05-14. Completion date: 2005-09-11.
$31,721, same as above.Signed on 2005-11-07. Completion date: 2006-01-06.
$26,280 with Defense Logistics Agency for Microcircuits, Electronic. Signed on 2004-12-17. Completion date: 2005-02-25.
ROBERT JASON JADGCHEW (6502 THOREAU DR in PARMA, OH; small business) : $276,069 in 8 contractsfrom 2002 to 2005
Contracts for Other Medical Services by Navy Signed by year:2000: $0; 2001: $0; 2002: $89,400; 2003: $1,812; 2004: $58,757; 2005: $126,100; 2006: $0.
Biggest contracts:
$66,064 with Navy for Other Medical Services. Taking place in CA. Signed on 2005-10-01. Completion date: 2006-09-30.
$58,376, same as above.Signed on 2005-02-05. Completion date: 2005-09-30.
$58,376, same as above.Signed on 2004-09-12. Completion date: 2004-09-30.
$54,200, same as above.Signed on 2002-10-01. Completion date: 2003-09-30.
GREAT LAKES SALES & ASSOC INC (6809 NIGHT VISTA DR in PARMA, OH; small business) : $86,127 in 6 contractsfrom 2002 to 2005
Contracts for Semiconductor Devices and Associated Hardware, Microcircuits, Electronic by Defense Logistics Agency Signed by year:2000: $0; 2001: $0; 2002: $56,645; 2003: $0; 2004: $17,850; 2005: $11,632; 2006: $0.
Biggest contracts:
$29,450 with Defense Logistics Agency for Semiconductor Devices and Associated Hardware. Signed on 2002-01-04. Completion date: 2002-03-05.
$27,195 with Defense Logistics Agency for Microcircuits, Electronic. Signed on 2002-02-22. Completion date: 2002-07-22.
$8,925 with Defense Logistics Agency for Semiconductor Devices and Associated Hardware. Signed on 2004-12-22. Completion date: 2005-02-08.
$8,925, same as above.Signed on 2004-12-22. Completion date: 2005-02-08.
KJB ELECTRONICS INC (6402 WESTMINSTER DR in CLEVELAND, OH; small business)
$5,600 with Navy for Maintenance, Repair or Alteration of Real Property -- Other Non-Building Facilities. Signed on 2005-08-09. Completion date: 2005-08-23.
Top industries in this zip code by the number of employees in 2005:
Health Care and Social Assistance: General Medical and Surgical Hospitals (over 1000 employees: 1 establishment)
2002 - 2018 National Fire Incident Reporting System (NFIRS) incidents
Based on the data from the years 2002 - 2018 the average number of fires per year is 82. The highest number of reported fires - 128 took place in 2007, and the least - 29 in 2002. The data has a rising trend.
When looking into fire subcategories, the most reports belonged to: Structure Fires (44.0%), and Outside Fires (40.0%).
Fire incident types reported to NFIRS in Zip Code 44129

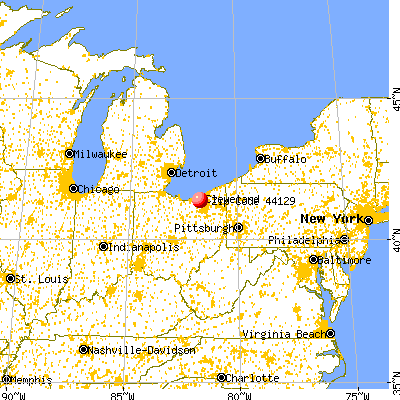


 Nearest zip codes: 44134, 44144, 44130, 44109, 44133, 44131.


 Based on the data from the years 2002 - 2018 the average number of fires per year is 82. The highest number of reported fires - 128 took place in 2007, and the least - 29 in 2002. The data has a rising trend.
 When looking into fire subcategories, the most reports belonged to: Structure Fires (44.0%), and Outside Fires (40.0%).