Estimated zip code population in 2022: 9,028
Zip code population in 2010: 10,204
Zip code population in 2000: 12,076
Houses and condos: 4,284
Renter-occupied apartments: 1,684
% of renters here:
48%State:
33%
March 2022 cost of living index in zip code 44502: 88.5
(less than average, U.S. average is 100)
Land area: 5.6
sq. mi.
Water area: 0.1
sq. mi.
Population density: 1,611 people per square mile (low).
OSM Map
General Map
Google Map
MSN Map
OSM Map
General Map
Google Map
MSN Map
OSM Map
General Map
Google Map
MSN Map
OSM Map
General Map
Google Map
MSN Map
Please wait while loading the map...
Real estate property taxes paid for housing units in 2022:
This zip code:
1.5% ($554)Ohio:
1.3% ($2,639)
Median real estate property taxes paid for housing units with mortgages in 2022: $681 (1.5%)
Median real estate property taxes paid for housing units with no mortgage in 2022: $497 (1.5%)
Profiles of local businesses
Business Search - 14 Million verified businesses
Males: 4,329 Females: 4,698
For population 25 years and over in 44502:
High school or higher: 83.9%Bachelor's degree or higher: 9.8%Graduate or professional degree: 3.1%Unemployed: 7.9%Mean travel time to work (commute): 18.8 minutes
For population 15 years and over in 44502:
Never married: 52.2%Now married: 27.4%Separated: 2.2%Widowed: 6.3%Divorced: 11.9%
Zip code 44502 compared to state average:
Median household income below state average. Median house value significantly below state average. Unemployed percentage above state average. Black race population percentage significantly above state average. Hispanic race population percentage above state average. Median age below state average. Length of stay since moving in significantly above state average. House age above state average. Percentage of population with a bachelor's degree or higher significantly below state average. 3,810 42.2% White 3,425 38.0% Black 858 9.5% Hispanic or Latino 792 8.8% Two or more races 67 0.7% Asian 66 0.7% Some other race 3 0.03% Native Hawaiian and Other 1 0.01% American Indian
Data:
Median household income ($)
Median household income (% change since 2000)
Household income diversity
Ratio of average income to average house value (%)
Ratio of average income to average rent
Median household income ($) - White
Median household income ($) - Black or African American
Median household income ($) - Asian
Median household income ($) - Hispanic or Latino
Median household income ($) - American Indian and Alaska Native
Median household income ($) - Multirace
Median household income ($) - Other Race
Median household income for houses/condos with a mortgage ($)
Median household income for apartments without a mortgage ($)
Races - White alone (%)
Races - White alone (% change since 2000)
Races - Black alone (%)
Races - Black alone (% change since 2000)
Races - American Indian alone (%)
Races - American Indian alone (% change since 2000)
Races - Asian alone (%)
Races - Asian alone (% change since 2000)
Races - Hispanic (%)
Races - Hispanic (% change since 2000)
Races - Native Hawaiian and Other Pacific Islander alone (%)
Races - Native Hawaiian and Other Pacific Islander alone (% change since 2000)
Races - Two or more races (%)
Races - Two or more races (% change since 2000)
Races - Other race alone (%)
Races - Other race alone (% change since 2000)
Racial diversity
Unemployment (%)
Unemployment (% change since 2000)
Unemployment (%) - White
Unemployment (%) - Black or African American
Unemployment (%) - Asian
Unemployment (%) - Hispanic or Latino
Unemployment (%) - American Indian and Alaska Native
Unemployment (%) - Multirace
Unemployment (%) - Other Race
Population density (people per square mile)
Population - Males (%)
Population - Females (%)
Population - Males (%) - White
Population - Males (%) - Black or African American
Population - Males (%) - Asian
Population - Males (%) - Hispanic or Latino
Population - Males (%) - American Indian and Alaska Native
Population - Males (%) - Multirace
Population - Males (%) - Other Race
Population - Females (%) - White
Population - Females (%) - Black or African American
Population - Females (%) - Asian
Population - Females (%) - Hispanic or Latino
Population - Females (%) - American Indian and Alaska Native
Population - Females (%) - Multirace
Population - Females (%) - Other Race
Coronavirus confirmed cases (Apr 27, 2024)
Deaths caused by coronavirus (Apr 27, 2024)
Coronavirus confirmed cases (per 100k population) (Apr 27, 2024)
Deaths caused by coronavirus (per 100k population) (Apr 27, 2024)
Daily increase in number of cases (Apr 27, 2024)
Weekly increase in number of cases (Apr 27, 2024)
Cases doubled (in days) (Apr 27, 2024)
Hospitalized patients (Apr 18, 2022)
Negative test results (Apr 18, 2022)
Total test results (Apr 18, 2022)
COVID Vaccine doses distributed (per 100k population) (Sep 19, 2023)
COVID Vaccine doses administered (per 100k population) (Sep 19, 2023)
COVID Vaccine doses distributed (Sep 19, 2023)
COVID Vaccine doses administered (Sep 19, 2023)
Likely homosexual households (%)
Likely homosexual households (% change since 2000)
Likely homosexual households - Lesbian couples (%)
Likely homosexual households - Lesbian couples (% change since 2000)
Likely homosexual households - Gay men (%)
Likely homosexual households - Gay men (% change since 2000)
Cost of living index
Median gross rent ($)
Median contract rent ($)
Median monthly housing costs ($)
Median house or condo value ($)
Median house or condo value ($ change since 2000)
Mean house or condo value by units in structure - 1, detached ($)
Mean house or condo value by units in structure - 1, attached ($)
Mean house or condo value by units in structure - 2 ($)
Mean house or condo value by units in structure by units in structure - 3 or 4 ($)
Mean house or condo value by units in structure - 5 or more ($)
Mean house or condo value by units in structure - Boat, RV, van, etc. ($)
Mean house or condo value by units in structure - Mobile home ($)
Median house or condo value ($) - White
Median house or condo value ($) - Black or African American
Median house or condo value ($) - Asian
Median house or condo value ($) - Hispanic or Latino
Median house or condo value ($) - American Indian and Alaska Native
Median house or condo value ($) - Multirace
Median house or condo value ($) - Other Race
Median resident age
Resident age diversity
Median resident age - Males
Median resident age - Females
Median resident age - White
Median resident age - Black or African American
Median resident age - Asian
Median resident age - Hispanic or Latino
Median resident age - American Indian and Alaska Native
Median resident age - Multirace
Median resident age - Other Race
Median resident age - Males - White
Median resident age - Males - Black or African American
Median resident age - Males - Asian
Median resident age - Males - Hispanic or Latino
Median resident age - Males - American Indian and Alaska Native
Median resident age - Males - Multirace
Median resident age - Males - Other Race
Median resident age - Females - White
Median resident age - Females - Black or African American
Median resident age - Females - Asian
Median resident age - Females - Hispanic or Latino
Median resident age - Females - American Indian and Alaska Native
Median resident age - Females - Multirace
Median resident age - Females - Other Race
Commute - mean travel time to work (minutes)
Travel time to work - Less than 5 minutes (%)
Travel time to work - Less than 5 minutes (% change since 2000)
Travel time to work - 5 to 9 minutes (%)
Travel time to work - 5 to 9 minutes (% change since 2000)
Travel time to work - 10 to 19 minutes (%)
Travel time to work - 10 to 19 minutes (% change since 2000)
Travel time to work - 20 to 29 minutes (%)
Travel time to work - 20 to 29 minutes (% change since 2000)
Travel time to work - 30 to 39 minutes (%)
Travel time to work - 30 to 39 minutes (% change since 2000)
Travel time to work - 40 to 59 minutes (%)
Travel time to work - 40 to 59 minutes (% change since 2000)
Travel time to work - 60 to 89 minutes (%)
Travel time to work - 60 to 89 minutes (% change since 2000)
Travel time to work - 90 or more minutes (%)
Travel time to work - 90 or more minutes (% change since 2000)
Marital status - Never married (%)
Marital status - Now married (%)
Marital status - Separated (%)
Marital status - Widowed (%)
Marital status - Divorced (%)
Median family income ($)
Median family income (% change since 2000)
Median non-family income ($)
Median non-family income (% change since 2000)
Median per capita income ($)
Median per capita income (% change since 2000)
Median family income ($) - White
Median family income ($) - Black or African American
Median family income ($) - Asian
Median family income ($) - Hispanic or Latino
Median family income ($) - American Indian and Alaska Native
Median family income ($) - Multirace
Median family income ($) - Other Race
Median year house/condo built
Median year apartment built
Year house built - Built 2005 or later (%)
Year house built - Built 2000 to 2004 (%)
Year house built - Built 1990 to 1999 (%)
Year house built - Built 1980 to 1989 (%)
Year house built - Built 1970 to 1979 (%)
Year house built - Built 1960 to 1969 (%)
Year house built - Built 1950 to 1959 (%)
Year house built - Built 1940 to 1949 (%)
Year house built - Built 1939 or earlier (%)
Average household size
Household density (households per square mile)
Average household size - White
Average household size - Black or African American
Average household size - Asian
Average household size - Hispanic or Latino
Average household size - American Indian and Alaska Native
Average household size - Multirace
Average household size - Other Race
Occupied housing units (%)
Vacant housing units (%)
Owner occupied housing units (%)
Renter occupied housing units (%)
Vacancy status - For rent (%)
Vacancy status - For sale only (%)
Vacancy status - Rented or sold, not occupied (%)
Vacancy status - For seasonal, recreational, or occasional use (%)
Vacancy status - For migrant workers (%)
Vacancy status - Other vacant (%)
Residents with income below the poverty level (%)
Residents with income below 50% of the poverty level (%)
Children below poverty level (%)
Poor families by family type - Married-couple family (%)
Poor families by family type - Male, no wife present (%)
Poor families by family type - Female, no husband present (%)
Poverty status for native-born residents (%)
Poverty status for foreign-born residents (%)
Poverty among high school graduates not in families (%)
Poverty among people who did not graduate high school not in families (%)
Residents with income below the poverty level (%) - White
Residents with income below the poverty level (%) - Black or African American
Residents with income below the poverty level (%) - Asian
Residents with income below the poverty level (%) - Hispanic or Latino
Residents with income below the poverty level (%) - American Indian and Alaska Native
Residents with income below the poverty level (%) - Multirace
Residents with income below the poverty level (%) - Other Race
Air pollution - Air Quality Index (AQI)
Air pollution - CO
Air pollution - NO2
Air pollution - SO2
Air pollution - Ozone
Air pollution - PM10
Air pollution - PM25
Air pollution - Pb
Crime - Murders per 100,000 population
Crime - Rapes per 100,000 population
Crime - Robberies per 100,000 population
Crime - Assaults per 100,000 population
Crime - Burglaries per 100,000 population
Crime - Thefts per 100,000 population
Crime - Auto thefts per 100,000 population
Crime - Arson per 100,000 population
Crime - City-data.com crime index
Crime - Violent crime index
Crime - Property crime index
Crime - Murders per 100,000 population (5 year average)
Crime - Rapes per 100,000 population (5 year average)
Crime - Robberies per 100,000 population (5 year average)
Crime - Assaults per 100,000 population (5 year average)
Crime - Burglaries per 100,000 population (5 year average)
Crime - Thefts per 100,000 population (5 year average)
Crime - Auto thefts per 100,000 population (5 year average)
Crime - Arson per 100,000 population (5 year average)
Crime - City-data.com crime index (5 year average)
Crime - Violent crime index (5 year average)
Crime - Property crime index (5 year average)
1996 Presidential Elections Results (%) - Democratic Party (Clinton)
1996 Presidential Elections Results (%) - Republican Party (Dole)
1996 Presidential Elections Results (%) - Other
2000 Presidential Elections Results (%) - Democratic Party (Gore)
2000 Presidential Elections Results (%) - Republican Party (Bush)
2000 Presidential Elections Results (%) - Other
2004 Presidential Elections Results (%) - Democratic Party (Kerry)
2004 Presidential Elections Results (%) - Republican Party (Bush)
2004 Presidential Elections Results (%) - Other
2008 Presidential Elections Results (%) - Democratic Party (Obama)
2008 Presidential Elections Results (%) - Republican Party (McCain)
2008 Presidential Elections Results (%) - Other
2012 Presidential Elections Results (%) - Democratic Party (Obama)
2012 Presidential Elections Results (%) - Republican Party (Romney)
2012 Presidential Elections Results (%) - Other
2016 Presidential Elections Results (%) - Democratic Party (Clinton)
2016 Presidential Elections Results (%) - Republican Party (Trump)
2016 Presidential Elections Results (%) - Other
2020 Presidential Elections Results (%) - Democratic Party (Biden)
2020 Presidential Elections Results (%) - Republican Party (Trump)
2020 Presidential Elections Results (%) - Other
Ancestries Reported - Arab (%)
Ancestries Reported - Czech (%)
Ancestries Reported - Danish (%)
Ancestries Reported - Dutch (%)
Ancestries Reported - English (%)
Ancestries Reported - French (%)
Ancestries Reported - French Canadian (%)
Ancestries Reported - German (%)
Ancestries Reported - Greek (%)
Ancestries Reported - Hungarian (%)
Ancestries Reported - Irish (%)
Ancestries Reported - Italian (%)
Ancestries Reported - Lithuanian (%)
Ancestries Reported - Norwegian (%)
Ancestries Reported - Polish (%)
Ancestries Reported - Portuguese (%)
Ancestries Reported - Russian (%)
Ancestries Reported - Scotch-Irish (%)
Ancestries Reported - Scottish (%)
Ancestries Reported - Slovak (%)
Ancestries Reported - Subsaharan African (%)
Ancestries Reported - Swedish (%)
Ancestries Reported - Swiss (%)
Ancestries Reported - Ukrainian (%)
Ancestries Reported - United States (%)
Ancestries Reported - Welsh (%)
Ancestries Reported - West Indian (%)
Ancestries Reported - Other (%)
Educational Attainment - No schooling completed (%)
Educational Attainment - Less than high school (%)
Educational Attainment - High school or equivalent (%)
Educational Attainment - Less than 1 year of college (%)
Educational Attainment - 1 or more years of college (%)
Educational Attainment - Associate degree (%)
Educational Attainment - Bachelor's degree (%)
Educational Attainment - Master's degree (%)
Educational Attainment - Professional school degree (%)
Educational Attainment - Doctorate degree (%)
School Enrollment - Nursery, preschool (%)
School Enrollment - Kindergarten (%)
School Enrollment - Grade 1 to 4 (%)
School Enrollment - Grade 5 to 8 (%)
School Enrollment - Grade 9 to 12 (%)
School Enrollment - College undergrad (%)
School Enrollment - Graduate or professional (%)
School Enrollment - Not enrolled in school (%)
School enrollment - Public schools (%)
School enrollment - Private schools (%)
School enrollment - Not enrolled (%)
Median number of rooms in houses and condos
Median number of rooms in apartments
Housing units lacking complete plumbing facilities (%)
Housing units lacking complete kitchen facilities (%)
Density of houses
Urban houses (%)
Rural houses (%)
Households with people 60 years and over (%)
Households with people 65 years and over (%)
Households with people 75 years and over (%)
Households with one or more nonrelatives (%)
Households with no nonrelatives (%)
Population in households (%)
Family households (%)
Nonfamily households (%)
Population in families (%)
Family households with own children (%)
Median number of bedrooms in owner occupied houses
Mean number of bedrooms in owner occupied houses
Median number of bedrooms in renter occupied houses
Mean number of bedrooms in renter occupied houses
Median number of vehichles in owner occupied houses
Mean number of vehichles in owner occupied houses
Median number of vehichles in renter occupied houses
Mean number of vehichles in renter occupied houses
Mortgage status - with mortgage (%)
Mortgage status - with second mortgage (%)
Mortgage status - with home equity loan (%)
Mortgage status - with both second mortgage and home equity loan (%)
Mortgage status - without a mortgage (%)
Average family size
Average family size - White
Average family size - Black or African American
Average family size - Asian
Average family size - Hispanic or Latino
Average family size - American Indian and Alaska Native
Average family size - Multirace
Average family size - Other Race
Geographical mobility - Same house 1 year ago (%)
Geographical mobility - Moved within same county (%)
Geographical mobility - Moved from different county within same state (%)
Geographical mobility - Moved from different state (%)
Geographical mobility - Moved from abroad (%)
Place of birth - Born in state of residence (%)
Place of birth - Born in other state (%)
Place of birth - Native, outside of US (%)
Place of birth - Foreign born (%)
Housing units in structures - 1, detached (%)
Housing units in structures - 1, attached (%)
Housing units in structures - 2 (%)
Housing units in structures - 3 or 4 (%)
Housing units in structures - 5 to 9 (%)
Housing units in structures - 10 to 19 (%)
Housing units in structures - 20 to 49 (%)
Housing units in structures - 50 or more (%)
Housing units in structures - Mobile home (%)
Housing units in structures - Boat, RV, van, etc. (%)
House/condo owner moved in on average (years ago)
Renter moved in on average (years ago)
Year householder moved into unit - Moved in 1999 to March 2000 (%)
Year householder moved into unit - Moved in 1995 to 1998 (%)
Year householder moved into unit - Moved in 1990 to 1994 (%)
Year householder moved into unit - Moved in 1980 to 1989 (%)
Year householder moved into unit - Moved in 1970 to 1979 (%)
Year householder moved into unit - Moved in 1969 or earlier (%)
Means of transportation to work - Drove car alone (%)
Means of transportation to work - Carpooled (%)
Means of transportation to work - Public transportation (%)
Means of transportation to work - Bus or trolley bus (%)
Means of transportation to work - Streetcar or trolley car (%)
Means of transportation to work - Subway or elevated (%)
Means of transportation to work - Railroad (%)
Means of transportation to work - Ferryboat (%)
Means of transportation to work - Taxicab (%)
Means of transportation to work - Motorcycle (%)
Means of transportation to work - Bicycle (%)
Means of transportation to work - Walked (%)
Means of transportation to work - Other means (%)
Working at home (%)
Industry diversity
Most Common Industries - Agriculture, forestry, fishing and hunting, and mining (%)
Most Common Industries - Agriculture, forestry, fishing and hunting (%)
Most Common Industries - Mining, quarrying, and oil and gas extraction (%)
Most Common Industries - Construction (%)
Most Common Industries - Manufacturing (%)
Most Common Industries - Wholesale trade (%)
Most Common Industries - Retail trade (%)
Most Common Industries - Transportation and warehousing, and utilities (%)
Most Common Industries - Transportation and warehousing (%)
Most Common Industries - Utilities (%)
Most Common Industries - Information (%)
Most Common Industries - Finance and insurance, and real estate and rental and leasing (%)
Most Common Industries - Finance and insurance (%)
Most Common Industries - Real estate and rental and leasing (%)
Most Common Industries - Professional, scientific, and management, and administrative and waste management services (%)
Most Common Industries - Professional, scientific, and technical services (%)
Most Common Industries - Management of companies and enterprises (%)
Most Common Industries - Administrative and support and waste management services (%)
Most Common Industries - Educational services, and health care and social assistance (%)
Most Common Industries - Educational services (%)
Most Common Industries - Health care and social assistance (%)
Most Common Industries - Arts, entertainment, and recreation, and accommodation and food services (%)
Most Common Industries - Arts, entertainment, and recreation (%)
Most Common Industries - Accommodation and food services (%)
Most Common Industries - Other services, except public administration (%)
Most Common Industries - Public administration (%)
Occupation diversity
Most Common Occupations - Management, business, science, and arts occupations (%)
Most Common Occupations - Management, business, and financial occupations (%)
Most Common Occupations - Management occupations (%)
Most Common Occupations - Business and financial operations occupations (%)
Most Common Occupations - Computer, engineering, and science occupations (%)
Most Common Occupations - Computer and mathematical occupations (%)
Most Common Occupations - Architecture and engineering occupations (%)
Most Common Occupations - Life, physical, and social science occupations (%)
Most Common Occupations - Education, legal, community service, arts, and media occupations (%)
Most Common Occupations - Community and social service occupations (%)
Most Common Occupations - Legal occupations (%)
Most Common Occupations - Education, training, and library occupations (%)
Most Common Occupations - Arts, design, entertainment, sports, and media occupations (%)
Most Common Occupations - Healthcare practitioners and technical occupations (%)
Most Common Occupations - Health diagnosing and treating practitioners and other technical occupations (%)
Most Common Occupations - Health technologists and technicians (%)
Most Common Occupations - Service occupations (%)
Most Common Occupations - Healthcare support occupations (%)
Most Common Occupations - Protective service occupations (%)
Most Common Occupations - Fire fighting and prevention, and other protective service workers including supervisors (%)
Most Common Occupations - Law enforcement workers including supervisors (%)
Most Common Occupations - Food preparation and serving related occupations (%)
Most Common Occupations - Building and grounds cleaning and maintenance occupations (%)
Most Common Occupations - Personal care and service occupations (%)
Most Common Occupations - Sales and office occupations (%)
Most Common Occupations - Sales and related occupations (%)
Most Common Occupations - Office and administrative support occupations (%)
Most Common Occupations - Natural resources, construction, and maintenance occupations (%)
Most Common Occupations - Farming, fishing, and forestry occupations (%)
Most Common Occupations - Construction and extraction occupations (%)
Most Common Occupations - Installation, maintenance, and repair occupations (%)
Most Common Occupations - Production, transportation, and material moving occupations (%)
Most Common Occupations - Production occupations (%)
Most Common Occupations - Transportation occupations (%)
Most Common Occupations - Material moving occupations (%)
People in Group quarters - Institutionalized population (%)
People in Group quarters - Correctional institutions (%)
People in Group quarters - Federal prisons and detention centers (%)
People in Group quarters - Halfway houses (%)
People in Group quarters - Local jails and other confinement facilities (including police lockups) (%)
People in Group quarters - Military disciplinary barracks (%)
People in Group quarters - State prisons (%)
People in Group quarters - Other types of correctional institutions (%)
People in Group quarters - Nursing homes (%)
People in Group quarters - Hospitals/wards, hospices, and schools for the handicapped (%)
People in Group quarters - Hospitals/wards and hospices for chronically ill (%)
People in Group quarters - Hospices or homes for chronically ill (%)
People in Group quarters - Military hospitals or wards for chronically ill (%)
People in Group quarters - Other hospitals or wards for chronically ill (%)
People in Group quarters - Hospitals or wards for drug/alcohol abuse (%)
People in Group quarters - Mental (Psychiatric) hospitals or wards (%)
People in Group quarters - Schools, hospitals, or wards for the mentally retarded (%)
People in Group quarters - Schools, hospitals, or wards for the physically handicapped (%)
People in Group quarters - Institutions for the deaf (%)
People in Group quarters - Institutions for the blind (%)
People in Group quarters - Orthopedic wards and institutions for the physically handicapped (%)
People in Group quarters - Wards in general hospitals for patients who have no usual home elsewhere (%)
People in Group quarters - Wards in military hospitals for patients who have no usual home elsewhere (%)
People in Group quarters - Juvenile institutions (%)
People in Group quarters - Long-term care (%)
People in Group quarters - Homes for abused, dependent, and neglected children (%)
People in Group quarters - Residential treatment centers for emotionally disturbed children (%)
People in Group quarters - Training schools for juvenile delinquents (%)
People in Group quarters - Short-term care, detention or diagnostic centers for delinquent children (%)
People in Group quarters - Type of juvenile institution unknown (%)
People in Group quarters - Noninstitutionalized population (%)
People in Group quarters - College dormitories (includes college quarters off campus) (%)
People in Group quarters - Military quarters (%)
People in Group quarters - On base (%)
People in Group quarters - Barracks, unaccompanied personnel housing (UPH), (Enlisted/Officer), ;and similar group living quarters for military personnel (%)
People in Group quarters - Transient quarters for temporary residents (%)
People in Group quarters - Military ships (%)
People in Group quarters - Group homes (%)
People in Group quarters - Homes or halfway houses for drug/alcohol abuse (%)
People in Group quarters - Homes for the mentally ill (%)
People in Group quarters - Homes for the mentally retarded (%)
People in Group quarters - Homes for the physically handicapped (%)
People in Group quarters - Other group homes (%)
People in Group quarters - Religious group quarters (%)
People in Group quarters - Dormitories (%)
People in Group quarters - Agriculture workers' dormitories on farms (%)
People in Group quarters - Job Corps and vocational training facilities (%)
People in Group quarters - Other workers' dormitories (%)
People in Group quarters - Crews of maritime vessels (%)
People in Group quarters - Other nonhousehold living situations (%)
People in Group quarters - Other noninstitutional group quarters (%)
Residents speaking English at home (%)
Residents speaking English at home - Born in the United States (%)
Residents speaking English at home - Native, born elsewhere (%)
Residents speaking English at home - Foreign born (%)
Residents speaking Spanish at home (%)
Residents speaking Spanish at home - Born in the United States (%)
Residents speaking Spanish at home - Native, born elsewhere (%)
Residents speaking Spanish at home - Foreign born (%)
Residents speaking other language at home (%)
Residents speaking other language at home - Born in the United States (%)
Residents speaking other language at home - Native, born elsewhere (%)
Residents speaking other language at home - Foreign born (%)
Class of Workers - Employee of private company (%)
Class of Workers - Self-employed in own incorporated business (%)
Class of Workers - Private not-for-profit wage and salary workers (%)
Class of Workers - Local government workers (%)
Class of Workers - State government workers (%)
Class of Workers - Federal government workers (%)
Class of Workers - Self-employed workers in own not incorporated business and Unpaid family workers (%)
House heating fuel used in houses and condos - Utility gas (%)
House heating fuel used in houses and condos - Bottled, tank, or LP gas (%)
House heating fuel used in houses and condos - Electricity (%)
House heating fuel used in houses and condos - Fuel oil, kerosene, etc. (%)
House heating fuel used in houses and condos - Coal or coke (%)
House heating fuel used in houses and condos - Wood (%)
House heating fuel used in houses and condos - Solar energy (%)
House heating fuel used in houses and condos - Other fuel (%)
House heating fuel used in houses and condos - No fuel used (%)
House heating fuel used in apartments - Utility gas (%)
House heating fuel used in apartments - Bottled, tank, or LP gas (%)
House heating fuel used in apartments - Electricity (%)
House heating fuel used in apartments - Fuel oil, kerosene, etc. (%)
House heating fuel used in apartments - Coal or coke (%)
House heating fuel used in apartments - Wood (%)
House heating fuel used in apartments - Solar energy (%)
House heating fuel used in apartments - Other fuel (%)
House heating fuel used in apartments - No fuel used (%)
Armed forces status - In Armed Forces (%)
Armed forces status - Civilian (%)
Armed forces status - Civilian - Veteran (%)
Armed forces status - Civilian - Nonveteran (%)
Fatal accidents locations in years 2005-2021
Fatal accidents locations in 2005
Fatal accidents locations in 2006
Fatal accidents locations in 2007
Fatal accidents locations in 2008
Fatal accidents locations in 2009
Fatal accidents locations in 2010
Fatal accidents locations in 2011
Fatal accidents locations in 2012
Fatal accidents locations in 2013
Fatal accidents locations in 2014
Fatal accidents locations in 2015
Fatal accidents locations in 2016
Fatal accidents locations in 2017
Fatal accidents locations in 2018
Fatal accidents locations in 2019
Fatal accidents locations in 2020
Fatal accidents locations in 2021
Alcohol use - People drinking some alcohol every month (%)
Alcohol use - People not drinking at all (%)
Alcohol use - Average days/month drinking alcohol
Alcohol use - Average drinks/week
Alcohol use - Average days/year people drink much
Audiometry - Average condition of hearing (%)
Audiometry - People that can hear a whisper from across a quiet room (%)
Audiometry - People that can hear normal voice from across a quiet room (%)
Audiometry - Ears ringing, roaring, buzzing (%)
Audiometry - Had a job exposure to loud noise (%)
Audiometry - Had off-work exposure to loud noise (%)
Blood Pressure & Cholesterol - Has high blood pressure (%)
Blood Pressure & Cholesterol - Checking blood pressure at home (%)
Blood Pressure & Cholesterol - Frequently checking blood cholesterol (%)
Blood Pressure & Cholesterol - Has high cholesterol level (%)
Consumer Behavior - Money monthly spent on food at supermarket/grocery store
Consumer Behavior - Money monthly spent on food at other stores
Consumer Behavior - Money monthly spent on eating out
Consumer Behavior - Money monthly spent on carryout/delivered foods
Consumer Behavior - Income spent on food at supermarket/grocery store (%)
Consumer Behavior - Income spent on food at other stores (%)
Consumer Behavior - Income spent on eating out (%)
Consumer Behavior - Income spent on carryout/delivered foods (%)
Current Health Status - General health condition (%)
Current Health Status - Blood donors (%)
Current Health Status - Has blood ever tested for HIV virus (%)
Current Health Status - Left-handed people (%)
Dermatology - People using sunscreen (%)
Diabetes - Diabetics (%)
Diabetes - Had a blood test for high blood sugar (%)
Diabetes - People taking insulin (%)
Diet Behavior & Nutrition - Diet health (%)
Diet Behavior & Nutrition - Milk product consumption (# of products/month)
Diet Behavior & Nutrition - Meals not home prepared (#/week)
Diet Behavior & Nutrition - Meals from fast food or pizza place (#/week)
Diet Behavior & Nutrition - Ready-to-eat foods (#/month)
Diet Behavior & Nutrition - Frozen meals/pizza (#/month)
Drug Use - People that ever used marijuana or hashish (%)
Drug Use - Ever used hard drugs (%)
Drug Use - Ever used any form of cocaine (%)
Drug Use - Ever used heroin (%)
Drug Use - Ever used methamphetamine (%)
Health Insurance - People covered by health insurance (%)
Kidney Conditions-Urology - Avg. # of times urinating at night
Medical Conditions - People with asthma (%)
Medical Conditions - People with anemia (%)
Medical Conditions - People with psoriasis (%)
Medical Conditions - People with overweight (%)
Medical Conditions - Elderly people having difficulties in thinking or remembering (%)
Medical Conditions - People who ever received blood transfusion (%)
Medical Conditions - People having trouble seeing even with glass/contacts (%)
Medical Conditions - People with arthritis (%)
Medical Conditions - People with gout (%)
Medical Conditions - People with congestive heart failure (%)
Medical Conditions - People with coronary heart disease (%)
Medical Conditions - People with angina pectoris (%)
Medical Conditions - People who ever had heart attack (%)
Medical Conditions - People who ever had stroke (%)
Medical Conditions - People with emphysema (%)
Medical Conditions - People with thyroid problem (%)
Medical Conditions - People with chronic bronchitis (%)
Medical Conditions - People with any liver condition (%)
Medical Conditions - People who ever had cancer or malignancy (%)
Mental Health - People who have little interest in doing things (%)
Mental Health - People feeling down, depressed, or hopeless (%)
Mental Health - People who have trouble sleeping or sleeping too much (%)
Mental Health - People feeling tired or having little energy (%)
Mental Health - People with poor appetite or overeating (%)
Mental Health - People feeling bad about themself (%)
Mental Health - People who have trouble concentrating on things (%)
Mental Health - People moving or speaking slowly or too fast (%)
Mental Health - People having thoughts they would be better off dead (%)
Oral Health - Average years since last visit a dentist
Oral Health - People embarrassed because of mouth (%)
Oral Health - People with gum disease (%)
Oral Health - General health of teeth and gums (%)
Oral Health - Average days a week using dental floss/device
Oral Health - Average days a week using mouthwash for dental problem
Oral Health - Average number of teeth
Pesticide Use - Households using pesticides to control insects (%)
Pesticide Use - Households using pesticides to kill weeds (%)
Physical Activity - People doing vigorous-intensity work activities (%)
Physical Activity - People doing moderate-intensity work activities (%)
Physical Activity - People walking or bicycling (%)
Physical Activity - People doing vigorous-intensity recreational activities (%)
Physical Activity - People doing moderate-intensity recreational activities (%)
Physical Activity - Average hours a day doing sedentary activities
Physical Activity - Average hours a day watching TV or videos
Physical Activity - Average hours a day using computer
Physical Functioning - People having limitations keeping them from working (%)
Physical Functioning - People limited in amount of work they can do (%)
Physical Functioning - People that need special equipment to walk (%)
Physical Functioning - People experiencing confusion/memory problems (%)
Physical Functioning - People requiring special healthcare equipment (%)
Prescription Medications - Average number of prescription medicines taking
Preventive Aspirin Use - Adults 40+ taking low-dose aspirin (%)
Reproductive Health - Vaginal deliveries (%)
Reproductive Health - Cesarean deliveries (%)
Reproductive Health - Deliveries resulted in a live birth (%)
Reproductive Health - Pregnancies resulted in a delivery (%)
Reproductive Health - Women breastfeeding newborns (%)
Reproductive Health - Women that had a hysterectomy (%)
Reproductive Health - Women that had both ovaries removed (%)
Reproductive Health - Women that have ever taken birth control pills (%)
Reproductive Health - Women taking birth control pills (%)
Reproductive Health - Women that have ever used Depo-Provera or injectables (%)
Reproductive Health - Women that have ever used female hormones (%)
Sexual Behavior - People 18+ that ever had sex (vaginal, anal, or oral) (%)
Sexual Behavior - Males 18+ that ever had vaginal sex with a woman (%)
Sexual Behavior - Males 18+ that ever performed oral sex on a woman (%)
Sexual Behavior - Males 18+ that ever had anal sex with a woman (%)
Sexual Behavior - Males 18+ that ever had any sex with a man (%)
Sexual Behavior - Females 18+ that ever had vaginal sex with a man (%)
Sexual Behavior - Females 18+ that ever performed oral sex on a man (%)
Sexual Behavior - Females 18+ that ever had anal sex with a man (%)
Sexual Behavior - Females 18+ that ever had any kind of sex with a woman (%)
Sexual Behavior - Average age people first had sex
Sexual Behavior - Average number of female sex partners in lifetime (males 18+)
Sexual Behavior - Average number of female vaginal sex partners in lifetime (males 18+)
Sexual Behavior - Average age people first performed oral sex on a woman (18+)
Sexual Behavior - Average number of woman performed oral sex on in lifetime (18+)
Sexual Behavior - Average number of male sex partners in lifetime (males 18+)
Sexual Behavior - Average number of male anal sex partners in lifetime (males 18+)
Sexual Behavior - Average age people first performed oral sex on a man (18+)
Sexual Behavior - Average number of male oral sex partners in lifetime (18+)
Sexual Behavior - People using protection when performing oral sex (%)
Sexual Behavior - Average number of times people have vaginal or anal sex a year
Sexual Behavior - People having sex without condom (%)
Sexual Behavior - Average number of male sex partners in lifetime (females 18+)
Sexual Behavior - Average number of male vaginal sex partners in lifetime (females 18+)
Sexual Behavior - Average number of female sex partners in lifetime (females 18+)
Sexual Behavior - Circumcised males 18+ (%)
Sleep Disorders - Average hours sleeping at night
Sleep Disorders - People that has trouble sleeping (%)
Smoking-Cigarette Use - People smoking cigarettes (%)
Taste & Smell - People 40+ having problems with smell (%)
Taste & Smell - People 40+ having problems with taste (%)
Taste & Smell - People 40+ that ever had wisdom teeth removed (%)
Taste & Smell - People 40+ that ever had tonsils teeth removed (%)
Taste & Smell - People 40+ that ever had a loss of consciousness because of a head injury (%)
Taste & Smell - People 40+ that ever had a broken nose or other serious injury to face or skull (%)
Taste & Smell - People 40+ that ever had two or more sinus infections (%)
Weight - Average height (inches)
Weight - Average weight (pounds)
Weight - Average BMI
Weight - People that are obese (%)
Weight - People that ever were obese (%)
Weight - People trying to lose weight (%)
100%
urban population.
Estimated median house/condo value in 2022: $37,190
44502:
$37,190Ohio:
$204,100
Median resident age: This zip code:
31.9 yearsOhio median age:
39.9 years
Average household size: This zip code:
2.4 peopleOhio:
2.4 people
Averages for the 2020 tax year for zip code 44502, filed in 2021:
Average Adjusted Gross Income (AGI) in 2020: $25,864 (Individual Income Tax Returns) Here:
$25,864State:
$67,288
Salary/wage: $23,234 (reported on 83.2% of returns )Here:
$23,234State:
$55,628
(% of AGI for various income ranges: 1038.6% for AGIs below $25k , 3193.8% for AGIs $25k-50k , 6267.4% for AGIs $50k-75k , 9706.7% for AGIs $75k-100k , 17585.0% for AGIs $100k-200k ) Taxable interest for individuals: $406 (reported on 8.4% of returns )This zip code:
$406Ohio:
$1,518
(% of AGI for various income ranges: 3.0% for AGIs below $25k , 2.5% for AGIs $25k-50k , 7.9% for AGIs $50k-75k , 53.3% for AGIs $75k-100k ) Ordinary dividends: $1,240 (reported on 4.1% of returns )(% of AGI for various income ranges: 2.8% for AGIs below $25k , 2.4% for AGIs $25k-50k , 26.8% for AGIs $50k-75k , 101.7% for AGIs $75k-100k ) Net capital gain/loss in AGI: +$1,500 (reported on 3.2% of returns )Here:
+$1,500State:
+$18,919
(% of AGI for various income ranges: 6.9% for AGIs $25k-50k , 191.7% for AGIs $75k-100k ) Profit/loss from business: +$5,463 (reported on 14.6% of returns )Here:
+$5,463State:
+$13,744
(% of AGI for various income ranges: 116.3% for AGIs below $25k , 66.9% for AGIs $25k-50k , 102.1% for AGIs $50k-75k ) Taxable individual retirement arrangement distribution: $6,070 (reported on 2.7% of returns )(% of AGI for various income ranges: 10.4% for AGIs below $25k , 42.3% for AGIs $25k-50k ) Earned income credit: $2,719 (reported on 43.2% of returns )(% of AGI for various income ranges: 172.9% for AGIs below $25k , 125.1% for AGIs $25k-50k ) Percentage of individuals using paid preparers for their 2020 taxes: 95.1%(% for various income ranges: 94.9% for AGIs below $25k , 96.6% for AGIs $25k-50k , 92.3% for AGIs $50k-75k , 88.9% for AGIs $75k-100k , 100.0% for AGIs $100k-200k )
Averages for the 2012 tax year for zip code 44502, filed in 2013:
Average Adjusted Gross Income (AGI) in 2012: $22,650 (Individual Income Tax Returns) Here:
$22,650State:
$54,926
Salary/wage: $20,882 (reported on 83.7% of returns )Here:
$20,882State:
$45,869
(% of AGI for various income ranges: 75.0% for AGIs below $25k , 83.5% for AGIs $25k-50k , 79.8% for AGIs $50k-75k , 108.3% for AGIs $75k-100k ) Taxable interest for individuals: $634 (reported on 12.2% of returns )This zip code:
$634Ohio:
$1,297
(% of AGI for various income ranges: 0.4% for AGIs below $25k , 0.2% for AGIs $25k-50k , 0.6% for AGIs $50k-75k , 0.4% for AGIs $75k-100k ) Ordinary dividends: $1,500 (reported on 6.1% of returns )(% of AGI for various income ranges: 0.6% for AGIs below $25k , 0.3% for AGIs $25k-50k , 0.6% for AGIs $50k-75k ) Profit/loss from business: +$7,521 (reported on 14.6% of returns )Here:
+$7,521State:
+$12,773
(% of AGI for various income ranges: 11.6% for AGIs below $25k , 1.0% for AGIs $25k-50k , 0.6% for AGIs $50k-75k ) Taxable individual retirement arrangement distribution: $6,456 (reported on 4.4% of returns )(% of AGI for various income ranges: 1.1% for AGIs below $25k , 1.2% for AGIs $25k-50k , 3.1% for AGIs $50k-75k ) Total itemized deductions: $13,679 (26% of AGI, reported on 5.2% of returns )Here:
$13,679State:
$21,278
Here:
26.1% of AGIState:
18.8% of AGI
(% of AGI for various income ranges: 2.1% for AGIs below $25k , 2.7% for AGIs $25k-50k , 5.1% for AGIs $50k-75k , 9.3% for AGIs $75k-100k ) Charity contributions: $2,917 (reported on 3.3% of returns )(% of AGI for various income ranges: 0.5% for AGIs $25k-50k , 0.8% for AGIs $50k-75k , 1.8% for AGIs $75k-100k ) Taxes paid: $3,317 (reported on 5.0% of returns )(% of AGI for various income ranges: 0.2% for AGIs below $25k , 0.6% for AGIs $25k-50k , 1.5% for AGIs $50k-75k , 3.4% for AGIs $75k-100k ) Earned income credit: $2,781 (reported on 44.8% of returns )(% of AGI for various income ranges: 13.0% for AGIs below $25k , 1.6% for AGIs $25k-50k ) Percentage of individuals using paid preparers for their 2012 taxes: 47.2%(% for various income ranges: 44.6% for AGIs below $25k , 53.0% for AGIs $25k-50k , 50.0% for AGIs $50k-75k , 57.1% for AGIs $75k-100k , 66.7% for AGIs $100k-200k )
Averages for the 2004 tax year for zip code 44502, filed in 2005:
Average Adjusted Gross Income (AGI) in 2004: $22,208 (Individual Income Tax Returns) Here:
$22,208State:
$44,480
Salary/wage: $21,064 (reported on 86.5% of returns )Here:
$21,064State:
$39,198
(% of AGI for various income ranges: 82.1% for AGIs below $10k , 79.5% for AGIs $10k-25k , 84.9% for AGIs $25k-50k , 89.0% for AGIs $50k-75k , 88.9% for AGIs $75k-100k , 44.7% for AGIs over 100k ) Taxable interest for individuals: $1,317 (reported on 24.5% of returns )This zip code:
$1,317Ohio:
$1,532
(% of AGI for various income ranges: 2.2% for AGIs below $10k , 1.8% for AGIs $10k-25k , 1.3% for AGIs $25k-50k , 1.3% for AGIs $50k-75k , 0.1% for AGIs $75k-100k , 1.4% for AGIs over 100k ) Taxable dividends: $985 (reported on 11.2% of returns )(% of AGI for various income ranges: 1.4% for AGIs below $10k , 0.3% for AGIs $10k-25k , 0.6% for AGIs $25k-50k , 0.2% for AGIs $50k-75k , 0.1% for AGIs $75k-100k , 0.7% for AGIs over 100k ) Net capital gain/loss: +$916 (reported on 5.8% of returns )(% of AGI for various income ranges: -0.6% for AGIs below $10k , 0.1% for AGIs $10k-25k , 0.4% for AGIs $25k-50k , 0.3% for AGIs $50k-75k , 0.6% for AGIs over 100k ) Profit/loss from business: +$6,089 (reported on 7.9% of returns )Here:
+$6,089State:
+$10,813
(% of AGI for various income ranges: 5.9% for AGIs below $10k , 4.0% for AGIs $10k-25k , 1.5% for AGIs $25k-50k , 0.1% for AGIs $50k-75k ) IRA payment deduction: $1,698 (reported on 1.2% of returns )Total itemized deductions: $11,133 (23% of AGI, reported on 9.2% of returns )Here:
$11,133State:
$17,503
Here:
23.2% of AGIState:
20.8% of AGI
(% of AGI for various income ranges: 2.3% for AGIs below $10k , 1.6% for AGIs $10k-25k , 5.3% for AGIs $25k-50k , 6.5% for AGIs $50k-75k , 7.8% for AGIs $75k-100k , 11.4% for AGIs over 100k ) Charity contributions deductions: $2,341 (5% of AGI, reported on 7.2% of returns )Here:
4.5% of AGIState:
3.4% of AGI
(% of AGI for various income ranges: 0.3% for AGIs $10k-25k , 0.9% for AGIs $25k-50k , 1.1% for AGIs $50k-75k , 1.3% for AGIs $75k-100k , 2.1% for AGIs over 100k ) Total tax: $2,496 (reported on 59.0% of returns )(% of AGI for various income ranges: 1.6% for AGIs below $10k , 3.4% for AGIs $10k-25k , 6.7% for AGIs $25k-50k , 9.6% for AGIs $50k-75k , 10.9% for AGIs $75k-100k , 19.0% for AGIs over 100k ) Earned income credit: $1,978 (reported on 34.7% of returns )Percentage of individuals using paid preparers for their 2004 taxes: 57.1%(% for various income ranges: 54.3% for AGIs below $10k , 58.2% for AGIs $10k-25k , 57.3% for AGIs $25k-50k , 58.4% for AGIs $50k-75k , 66.7% for AGIs $75k-100k , 74.1% for AGIs over 100k )
Estimated median household income in 2022: This zip code:
$31,652Ohio:
$65,720
Nearest zip codes: 44506 ,
44507 ,
44503 ,
44504 ,
44405 ,
44505 .
Youngstown Zip Code Map
Percentage of family households: This zip code:
41.8%Ohio:
43.3%
Percentage of households with unmarried partners: This zip code:
11.8%Ohio:
44.6%
No gay or lesbian households reported
Household received Food Stamps/SNAP in the past 12 months: 1,347Household did not receive Food Stamps/SNAP in the past 12 months: 2,222
Women who had a birth in the past 12 months: 112 (30 now married , 79 unmarried) Women who did not have a birth in the past 12 months: 2,058 (398 now married , 1,662 unmarried)
Housing units in zip code 44502 with a mortgage: 538 (57
second mortgage , 56
both second mortgage and home equity loan )
Houses without a mortgage: 9
Median monthly owner costs for units with a mortgage: $775
Median monthly owner costs for units without a mortgage: $328
Residents with income below the poverty level in 2022:
This zip code:
41.0%Whole state:
13.4%
Residents with income below 50% of the poverty level in 2022:
This zip code:
16.5%Whole state:
7.0%
Median number of rooms in houses and condos: Median number of rooms in apartments: Notable locations in this zip code not listed on our city pages
Click to draw/clear zip code borders Notable locations in zip code 44502: (A) , City of Youngstown Fire Department Station 9 (B) , City of Youngstown Fire Department Station 7 (C) , William F Maag Library (D) , McDonough Museum of Art (E) , Hopper Research Library (F) , Ward Beecher Hall (G) , Meshel Hall (H) , Kilcawley Center (I) , Jones Hall (J) , Fedor Hall (K) , DeBartolo Hall (L) , Dana Hall (M) , Cushwa Hall (N) , Coffelt Hall (O) , Bliss Hall (P) , Beeghly Center (Q) , Butler Institute of American Art (R) . Display/hide their locations on the map
Churches in zip code 44502 include: (A) , First Christian Church (B) , Final Call to Islam Church (C) , Fields Memorial Church (D) , Faith Tabernacle (E) , Ebenezer Church of God in Christ (F) , Church of Jesus Christ (G) , Apostolic Faith Temple (H) , American Muslim Mission Center (I) . Display/hide their locations on the map
Cemeteries: (1) , Jewish Federation Cemetery (2) . Display/hide their locations on the map
Reservoir: (A) . Display/hide its location on the map
Creek: (A) . Display/hide its location on the map
Parks in zip code 44502 include: (1) , Pemberton Park (2) , Homestead Park (3) , Gibson Park (4) , Buckeye Park (5) , Volney Rogers Field (6) , Wick Avenue Historic District (7) , Pine Hollow Park (8) , Arlington Avenue Historic District (9) . Display/hide their locations on the map
Year house built (houses)
0 2020 or later11 2010 to 2019107 2000 to 2009116 1990 to 1999112 1980 to 1989261 1970 to 1979304 1960 to 19691,079 1950 to 1959501 1940 to 19491,700 1939 or earlier
Zip code 44502 household income distribution in 2022 640 Less than $10,000299 $10,000 to $14,999305 $15,000 to $19,999166 $20,000 to $24,999342 $25,000 to $29,999132 $30,000 to $34,999304 $35,000 to $39,999231 $40,000 to $44,99998 $45,000 to $49,999236 $50,000 to $59,999314 $60,000 to $74,999309 $75,000 to $99,99965 $100,000 to $124,99958 $125,000 to $149,99972 $150,000 to $199,99912 $200,000 or moreEstimate of home value of owner-occupied houses/condos in 2022 in zip code 44502 131 Less than $10,000143 $10,000 to $14,999123 $15,000 to $19,999241 $20,000 to $24,999115 $25,000 to $29,999261 $30,000 to $34,99975 $35,000 to $39,999188 $40,000 to $49,999139 $50,000 to $59,99939 $60,000 to $69,99934 $70,000 to $79,99963 $80,000 to $89,99923 $90,000 to $99,99931 $125,000 to $149,99922 $150,000 to $174,99916 $175,000 to $199,99928 $200,000 to $249,99919 $250,000 to $299,9995 $300,000 to $399,9997 $400,000 to $499,99928 $500,000 to $749,999Rent paid by renters in 2022 in zip code 44502 7 $100 to $14934 $150 to $19930 $200 to $24922 $250 to $29934 $300 to $34930 $350 to $39931 $400 to $44984 $450 to $499260 $500 to $549267 $550 to $599198 $600 to $649178 $650 to $699124 $700 to $74986 $750 to $799101 $800 to $89917 $900 to $9994 $1,000 to $1,24912 $1,250 to $1,49999 No cash rent
Median gross rent in 2022: $873.
Estimated median house (or condo) value in 2022 for: White Non-Hispanic householders: $37,813Black or African American householders: $26,178Asian householders: $1,038,829Some other race householders: $38,644Two or more races householders: $63,680Hispanic or Latino householders: $43,215Estimated median house or condo value in 2022: $37,190
44502:
$37,190Ohio:
$204,100
Lower value quartile - upper value quartile: $23,158 - $60,546
Mean price in 2022: Detached houses: $172,894Here:
$172,894State:
$254,366
Townhouses or other attached units: $173,222Here:
$173,222State:
$225,733
In 2-unit structures: $157,188Here:
$157,188State:
$144,384
In 3-to-4-unit structures: $133,041Here:
$133,041State:
$203,002
In 5-or-more-unit structures: $270,541Here:
$270,541State:
$211,593
Mobile homes: $39,259Here:
$39,259State:
$62,719
Housing units in structures:
One, detached: 3,904One, attached: 9Two: 583 or 4: 215 to 9: 6510 to 19: 2020 to 49: 14450 or more: 26Mobile homes: 18Unemployment : 7.9%
Means of transportation to work in zip code 44502 65.5% 2,108 Drove a car alone9.8% 316 Carpooled3.7% 120 Bus or trolley bus2.7% 88 Taxi0.2% 7 Motorcycle0.4% 14 Bicycle3.4% 111 Walked4.5% 144 Other means9.8% 316 Worked at homeTravel time to work (commute) in zip code 44502 85 Less than 5 minutes260 5 to 9 minutes768 10 to 14 minutes710 15 to 19 minutes515 20 to 24 minutes193 25 to 29 minutes145 30 to 34 minutes61 35 to 39 minutes30 45 to 59 minutes69 60 to 89 minutes34 90 or more minutes
Percentage of zip code residents living and working in this county: 77.8%
Household type by relationship:
Households: 9,028
Male householders: 1,415 (675 living alone ), Female householders: 2,133 (664 living alone )816 spouses (772 opposite-sex spouses ), 528 unmarried partners , (486 opposite-sex unmarried partners ), 2,778 children (2,461 natural , 15 adopted , 292 stepchildren ), 226 grandchildren , 148 brothers or sisters , 56 parents , 0 foster children , 82 other relatives , 233 non-relatives In group quarters: 596 (-1 institutionalized population )
Size of family households: 830 2-persons , 455 3-persons , 353 4-persons , 172 5-persons , 108 6-persons , 43 7-or-more-persons
Size of nonfamily households: 1,338 1-person , 225 2-persons , 12 3-persons
607 married couples with children. single-parent households (136 men , 1,296 women ).
90.0% of residents of 44502 zip code speak English at home. of residents speak Spanish at home (57% very well, 15% well, 22% not well, 6% not at all ).of residents speak other Indo-European language at home (52% very well, 39% well, 8% not well ).of residents speak Asian or Pacific Island language at home (100% well ).of residents speak other language at home (82% very well, 18% well ).
Foreign born population: 388 (4.3%)
(39.0%
of them are naturalized citizens )
This zip code:
4.3%Whole state:
5.0%
21% Honduras 8% El Salvador 7% Israel 7% Nepal 6% St. Vincent and the Grenadines 6% Malaysia 5% Kazakhstan 11% American 4% German 3% Irish 3% African 3% English 2% Italian 1% Polish
Year of entry for the foreign-born population
445 2010 or later 7 2000 to 2009 53 1990 to 1999 212 Before 1990
There are
124 Medical Specialists in Zip Code 44502 .
Facilities with environmental interests located in this zip code:
BOARDMAN JUNIOR HIGH SCHOOL (7777 GLENWOOD AVE in YOUNGSTOWN, OH)
(Geographic Names Information System) (National Center for Education Statistics) - STATE ID-003061 STATE MASTER (Ohio general info) - AIR MAJOR Small Quantity Generators, between 100 kg and 1000 kg of hazardous waste/month (Resource Conservation and Recovery Act (tracking hazardous waste)) - notification Organizations: BOARDMAN LOCAL SCHOOL (CONTACT/OWNER)
, BOARDMAN LOCAL SD (SCHOOL DISTRICT)
Alternative names: BOARDMAN HIGH SCHOOL
BAKER PLASTICS INC (858 MAHONING AVE in YOUNGSTOWN, OH)
STATE MASTER (Ohio general info) - RCRA-OHD004169470, HAZARDOUS WASTE PROGRAM (Resource Conservation and Recovery Act (tracking hazardous waste))
BENNETT BRAKE (803 W RAYEN AVENUE in YOUNGSTOWN, OH)
AIR MINOR (AIRS/AFS) STATE MASTER (Ohio general info) - AIR MAJOR Business SIC classification: MOTOR VEHICLE PARTS AND ACCESSORIES
BFI WASTE SYSTEMS INC (530 GLENWOOD AVE in YOUNGSTOWN, OH)
STATE MASTER (Ohio general info) - EPCRA, RCRA-OHT400011763, HAZARDOUS WASTE PROGRAM, AIR MAJOR Small Quantity Generators, between 100 kg and 1000 kg of hazardous waste/month (Resource Conservation and Recovery Act (tracking hazardous waste)) - notification Organizations: YOUNGSTOWN BFI WASTE SYSTEMS INC (CONTACT/OWNER)
Alternative names: YOUNGSTOWN BFI WASTE SYSTEMS I
ADT 83 (412 BELMONT AVENUE in YOUNGSTOWN, OH)
(Integrated Compliance Information System) - ICIS-HQ-2002-6000, FORMAL ENFORCEMENT ACTION
BENU CORP (216 ALEXANDER ST in YOUNGSTOWN, OH)
Large Quantity Generators, more that 1000 kg of hazardous waste/month (Resource Conservation and Recovery Act (tracking hazardous waste)) - notification Organizations: FRANGOS LARRY (CONTACT/OWNER)
BIG M WAREHOUSE (1225 POLAND AVE in YOUNGSTOWN, OH)
TRANSPORTER (Resource Conservation and Recovery Act (tracking hazardous waste)) Organizations: MCMILLEN KENNETH (CONTACT/OWNER)
BOBS AUTO BODY (820 MAHONING AVE in YOUNGSTOWN, OH)
Small Quantity Generators, between 100 kg and 1000 kg of hazardous waste/month (Resource Conservation and Recovery Act (tracking hazardous waste)) - notification Organizations: FLAMISCH BOB (CONTACT/OWNER)
BIG G CONSTRUCTION INC (551 MAHONING AVE in YOUNGSTOWN, OH)
Conditionally Exempt Small Quantity Generators, less than 100 kg/month of hazardous waste (Resource Conservation and Recovery Act (tracking hazardous waste)) - notification Organizations: TYSON GREGORY C (CONTACT/OWNER)
BJ ALAN CO INC (555 W FEDERAL ST in YOUNGSTOWN, OH)
COMPLIANCE ACTIVITY (Tracking inspections of insecticide, fungicide, and rodenticide, and toxic substances)
BOYAS EXCAVATING INC. AT LTV STEEL CO. (1898 POLAND AVE. in YOUNGSTOWN, OH)
COMPLIANCE ACTIVITY (Tracking inspections of insecticide, fungicide, and rodenticide, and toxic substances)
Housing units lacking complete plumbing facilities: 7.2%
Housing units lacking complete kitchen facilities: 7.6%
87.6% Utility gas 12.3% Electricity
Population in 1990: 13,671.
Place of birth for U.S.-born residents:
This state: 6,754Northeast: 721Midwest: 143South: 516West: 211
63% of the 44502 zip code residents lived in the same house 5 years ago.
Out of people who lived in different houses, 71% lived in this county.
Out of people who lived in different counties, 50% lived in Ohio.
89% of the 44502 zip code residents lived in the same house 1 year ago.
Out of people who lived in different houses, 61% moved from this county.
Out of people who lived in different houses, 15% moved from different county within same state.
Out of people who lived in different houses, 14% moved from different state.
Out of people who lived in different houses, 9% moved from abroad.
Private vs. public school enrollment:
Students in private schools in grades 1 to 8 (elementary and middle school): 222
Students in private schools in grades 9 to 12 (high school): 147
Students in private undergraduate colleges: 28
Occupation by median earnings in the past 12 months ($)
46,207 Life, physical, and social science occupations 44,199 Production occupations 37,523 Community and social service occupations 34,909 Health diagnosing and treating practitioners and other technical occupations 33,734 Transportation occupations 27,684 Education, training, and library occupations
Companies with federal contracts located in this zip code:
ABCON, INC (1103 E BOSTON STE B in YOUNGSTOWN, OH; small business) in 105 contracts from 2000 to 2006
Contracts for Maintenance, Repair or Alteration of Real Property -- Other Administrative Facilities and Service Buildings, Construction of Structures and Facilities -- Miscellaneous Buildings, Maintenance, Repair or Alteration of Real Property -- Dams by Army, U.S. Army Corps of Engineers - civil program financing onlySigned by year: 2000: $60,000; 2001: $174,001; 2002: $272,747; 2003: $903,714; 2004: $4,190,732; 2005: $2,178,209; 2006: $2,042,204.
Biggest contracts: with Army for Maintenance, Repair or Alteration of Real Property -- Other Administrative Facilities and Service Buildings. Taking place in WV. Signed on 2006-01-19. Completion date: 2006-08-31.
with U.S. Army Corps of Engineers - civil program financing only for Maintenance, Repair or Alteration of Real Property -- Other Administrative Facilities and Service Buildings. Taking place in PA. Signed on 2004-06-16. Completion date: 2004-09-30.
with Army for Maintenance, Repair or Alteration of Real Property -- Other Administrative Facilities and Service Buildings. Taking place in PA. Signed on 2004-06-16. Completion date: 2004-09-30.
with U.S. Army Corps of Engineers - civil program financing only for Maintenance, Repair or Alteration of Real Property -- Other Administrative Facilities and Service Buildings. Taking place in PA. Signed on 2004-03-03. Completion date: 2003-11-15.
YOUNGSTOWN ELECTRIC SERVICE IN (948 POLAND AVE in YOUNGSTOWN, OH; small business)
$15,584 with Air Force for Maintenance, Repair or Alteration of Real Property -- Water Supply Facilities. Signed on 2000-09-11. Completion date: 2000-11-09.
Top industries in this zip code by the number of employees in 2005:
Wholesale Trade: Other Grocery and Related Products Merchant Wholesalers (100-249 employees: 2 establishments, 50-99 employees: 1 establishment, 10-19 employees: 1 establishment, 1-4 employees: 1 establishment)Health Care and Social Assistance: Offices of Physicians (except Mental Health Specialists) (100-249: 1, 20-49: 1, 10-19: 1, 1-4: 1)Accommodation and Food Services: Limited-Service Restaurants (50-99: 1, 20-49: 3, 5-9: 4, 1-4: 2)Wholesale Trade: Industrial Supplies Merchant Wholesalers (100-249: 1, 5-9: 2, 1-4: 1)Wholesale Trade: Recyclable Material Merchant Wholesalers (100-249: 1, 10-19: 1)Wholesale Trade: Toy and Hobby Goods and Supplies Merchant Wholesalers (100-249: 1, 10-19: 1)Utilities: Electric Power Distribution (100-249: 1, 5-9: 1, 1-4: 1)Administrative and Support and Waste Management and Remediation Services: Temporary Help Services (100-249: 1, 1-4: 1)Utilities: Natural Gas Distribution (100-249: 1)Health Care and Social Assistance: Ambulance Services (100-249: 1)
People in group quarters in 2010:
650 people in college/university student housing
94 people in nursing facilities/skilled-nursing facilities
31 people in other noninstitutional facilities
21 people in group homes intended for adults
10 people in group homes for juveniles (non-correctional)
10 people in residential treatment centers for adults
5 people in emergency and transitional shelters (with sleeping facilities) for people experiencing homelessness
People in group quarters in 2000:
251 people in college dormitories (includes college quarters off campus)
175 people in short-term care, detention or diagnostic centers for delinquent children
90 people in nursing homes
36 people in other noninstitutional group quarters
15 people in homes for the mentally retarded
13 people in homes or halfway houses for drug/alcohol abuse
Fatal accident statistics in 2014:
Fatal accident count: 4Vehicles involved in fatal accidents: 5Fatal accidents caused by drunken drivers: 1Fatalities: 4Persons involved in fatal accidents: 6Pedestrians involved in fatal accidents: 1
Fatal accident statistics in 2013:
Fatal accident count: 2Vehicles involved in fatal accidents: 3Fatal accidents caused by drunken drivers: 2Fatalities: 2Persons involved in fatal accidents: 5Pedestrians involved in fatal accidents: 0
Home Mortgage Disclosure Act Aggregated Statistics For Year 2009(Based on 9 full and 6 partial tracts) A) FHA, FSA/RHS & VA B) Conventional C) Refinancings D) Home Improvement Loans F) Non-occupant Loans on Number Average Value Number Average Value Number Average Value Number Average Value Number Average Value
LOANS ORIGINATED 26 $38,903 22 $25,887 62 $36,820 13 $8,847 29 $33,744 APPLICATIONS APPROVED, NOT ACCEPTED 1 $20,220 4 $32,400 16 $38,664 7 $10,023 4 $34,455 APPLICATIONS DENIED 12 $35,642 7 $30,623 124 $42,595 36 $19,170 14 $19,532 APPLICATIONS WITHDRAWN 2 $32,040 0 $0 16 $43,025 7 $19,601 2 $34,145 FILES CLOSED FOR INCOMPLETENESS 2 $63,170 2 $29,935 11 $58,928 1 $28,080 0 $0
Aggregated Statistics For Year 2008(Based on 9 full and 6 partial tracts) A) FHA, FSA/RHS & VA B) Conventional C) Refinancings D) Home Improvement Loans F) Non-occupant Loans on G) Loans On Manufactured Number Average Value Number Average Value Number Average Value Number Average Value Number Average Value Number Average Value
LOANS ORIGINATED 24 $42,222 63 $31,088 77 $38,412 20 $15,726 56 $31,470 0 $0 APPLICATIONS APPROVED, NOT ACCEPTED 2 $24,950 10 $33,091 28 $41,474 7 $5,040 6 $33,572 0 $0 APPLICATIONS DENIED 18 $53,525 34 $34,645 213 $44,466 74 $8,869 47 $34,038 4 $6,408 APPLICATIONS WITHDRAWN 0 $0 4 $45,432 45 $48,865 5 $46,228 3 $43,167 0 $0 FILES CLOSED FOR INCOMPLETENESS 0 $0 6 $50,502 9 $53,902 3 $21,957 5 $53,526 0 $0
Aggregated Statistics For Year 2007(Based on 9 full and 8 partial tracts) A) FHA, FSA/RHS & VA B) Conventional C) Refinancings D) Home Improvement Loans E) Loans on Dwellings For 5+ Families F) Non-occupant Loans on G) Loans On Manufactured Number Average Value Number Average Value Number Average Value Number Average Value Number Average Value Number Average Value Number Average Value
LOANS ORIGINATED 10 $54,519 124 $43,275 131 $38,467 31 $15,829 4 $710,505 77 $32,872 0 $0 APPLICATIONS APPROVED, NOT ACCEPTED 0 $0 19 $42,034 49 $46,449 15 $13,055 0 $0 18 $41,481 2 $18,960 APPLICATIONS DENIED 15 $53,429 77 $46,781 332 $52,320 124 $18,006 0 $0 42 $35,396 0 $0 APPLICATIONS WITHDRAWN 2 $69,970 21 $62,919 56 $51,020 7 $28,570 0 $0 17 $37,941 0 $0 FILES CLOSED FOR INCOMPLETENESS 0 $0 9 $52,672 13 $64,548 4 $9,482 0 $0 2 $44,905 0 $0
Aggregated Statistics For Year 2006(Based on 9 full and 10 partial tracts) A) FHA, FSA/RHS & VA B) Conventional C) Refinancings D) Home Improvement Loans E) Loans on Dwellings For 5+ Families F) Non-occupant Loans on Number Average Value Number Average Value Number Average Value Number Average Value Number Average Value Number Average Value
LOANS ORIGINATED 9 $57,369 246 $44,326 214 $42,322 77 $20,240 1 $529,860 144 $36,889 APPLICATIONS APPROVED, NOT ACCEPTED 0 $0 54 $45,517 68 $46,690 21 $19,691 0 $0 30 $58,499 APPLICATIONS DENIED 1 $29,760 177 $50,214 360 $53,252 151 $25,124 0 $0 91 $57,045 APPLICATIONS WITHDRAWN 0 $0 49 $46,368 150 $53,319 31 $29,140 0 $0 30 $40,252 FILES CLOSED FOR INCOMPLETENESS 0 $0 11 $52,862 34 $49,809 0 $0 0 $0 4 $25,368
Aggregated Statistics For Year 2005(Based on 9 full and 8 partial tracts) A) FHA, FSA/RHS & VA B) Conventional C) Refinancings D) Home Improvement Loans E) Loans on Dwellings For 5+ Families F) Non-occupant Loans on G) Loans On Manufactured Number Average Value Number Average Value Number Average Value Number Average Value Number Average Value Number Average Value Number Average Value
LOANS ORIGINATED 12 $41,346 333 $44,235 318 $45,309 76 $26,488 0 $0 216 $38,549 0 $0 APPLICATIONS APPROVED, NOT ACCEPTED 2 $38,950 61 $45,919 143 $51,655 18 $14,444 1 $208,900 37 $39,447 0 $0 APPLICATIONS DENIED 1 $13,480 135 $44,006 533 $49,566 157 $23,206 2 $59,875 103 $39,835 2 $43,945 APPLICATIONS WITHDRAWN 0 $0 68 $52,829 180 $57,793 44 $96,641 0 $0 42 $44,998 0 $0 FILES CLOSED FOR INCOMPLETENESS 2 $36,620 12 $39,538 27 $58,489 2 $29,960 0 $0 4 $34,455 0 $0
Aggregated Statistics For Year 2004(Based on 9 full and 10 partial tracts) A) FHA, FSA/RHS & VA B) Conventional C) Refinancings D) Home Improvement Loans E) Loans on Dwellings For 5+ Families F) Non-occupant Loans on G) Loans On Manufactured Number Average Value Number Average Value Number Average Value Number Average Value Number Average Value Number Average Value Number Average Value
LOANS ORIGINATED 27 $47,742 256 $41,035 379 $42,439 68 $23,156 2 $299,610 174 $35,517 0 $0 APPLICATIONS APPROVED, NOT ACCEPTED 2 $27,940 58 $48,214 143 $49,194 13 $54,797 0 $0 31 $40,023 0 $0 APPLICATIONS DENIED 12 $42,588 125 $42,930 449 $46,145 145 $18,573 0 $0 86 $41,515 2 $1,995 APPLICATIONS WITHDRAWN 6 $34,603 57 $49,485 151 $50,905 22 $23,550 0 $0 26 $35,420 0 $0 FILES CLOSED FOR INCOMPLETENESS 0 $0 4 $29,442 44 $58,977 6 $19,245 0 $0 2 $51,000 0 $0
Aggregated Statistics For Year 2003(Based on 9 full and 10 partial tracts) A) FHA, FSA/RHS & VA B) Conventional C) Refinancings D) Home Improvement Loans F) Non-occupant Loans on Number Average Value Number Average Value Number Average Value Number Average Value Number Average Value
LOANS ORIGINATED 52 $45,666 216 $36,028 368 $40,848 65 $15,751 183 $31,217 APPLICATIONS APPROVED, NOT ACCEPTED 4 $43,938 52 $40,068 154 $46,086 8 $27,261 16 $30,945 APPLICATIONS DENIED 8 $42,838 82 $43,901 433 $47,147 104 $9,787 42 $33,476 APPLICATIONS WITHDRAWN 2 $39,915 26 $44,624 146 $55,250 5 $31,504 11 $32,586 FILES CLOSED FOR INCOMPLETENESS 0 $0 12 $38,798 36 $50,432 4 $17,078 5 $31,518
Aggregated Statistics For Year 2002(Based on 9 full and 8 partial tracts) A) FHA, FSA/RHS & VA B) Conventional C) Refinancings D) Home Improvement Loans F) Non-occupant Loans on Number Average Value Number Average Value Number Average Value Number Average Value Number Average Value
LOANS ORIGINATED 43 $42,056 178 $34,463 357 $40,816 56 $18,314 135 $31,446 APPLICATIONS APPROVED, NOT ACCEPTED 2 $47,605 27 $34,995 145 $42,412 9 $10,773 12 $30,540 APPLICATIONS DENIED 14 $38,957 68 $38,015 566 $43,105 128 $10,040 54 $33,684 APPLICATIONS WITHDRAWN 8 $49,934 35 $43,364 159 $46,399 16 $21,544 26 $31,324 FILES CLOSED FOR INCOMPLETENESS 2 $48,935 7 $31,353 47 $43,467 0 $0 5 $33,244
Aggregated Statistics For Year 2001(Based on 9 full and 8 partial tracts) A) FHA, FSA/RHS & VA B) Conventional C) Refinancings D) Home Improvement Loans E) Loans on Dwellings For 5+ Families F) Non-occupant Loans on Number Average Value Number Average Value Number Average Value Number Average Value Number Average Value Number Average Value
LOANS ORIGINATED 95 $41,365 152 $34,054 301 $37,796 76 $12,435 1 $42,000 71 $26,366 APPLICATIONS APPROVED, NOT ACCEPTED 6 $28,957 30 $34,461 137 $40,318 26 $10,414 0 $0 19 $31,780 APPLICATIONS DENIED 8 $52,202 81 $34,727 574 $41,012 181 $11,084 0 $0 55 $28,117 APPLICATIONS WITHDRAWN 12 $38,379 36 $36,550 272 $40,344 34 $14,331 0 $0 19 $43,009 FILES CLOSED FOR INCOMPLETENESS 2 $29,885 1 $26,560 36 $44,148 2 $18,310 0 $0 6 $46,392
Aggregated Statistics For Year 2000(Based on 9 full and 10 partial tracts) A) FHA, FSA/RHS & VA B) Conventional C) Refinancings D) Home Improvement Loans E) Loans on Dwellings For 5+ Families F) Non-occupant Loans on Number Average Value Number Average Value Number Average Value Number Average Value Number Average Value Number Average Value
LOANS ORIGINATED 87 $40,008 192 $30,809 277 $36,575 109 $11,893 0 $0 82 $30,675 APPLICATIONS APPROVED, NOT ACCEPTED 1 $26,960 18 $33,010 114 $39,793 41 $13,068 0 $0 3 $31,383 APPLICATIONS DENIED 7 $63,261 63 $36,654 465 $36,484 202 $11,684 2 $1,596,640 25 $31,951 APPLICATIONS WITHDRAWN 2 $38,950 29 $32,371 188 $35,459 39 $18,227 0 $0 30 $29,192 FILES CLOSED FOR INCOMPLETENESS 1 $53,350 23 $37,622 49 $37,451 1 $12,360 0 $0 5 $24,508
Aggregated Statistics For Year 1999(Based on 5 full and 6 partial tracts) A) FHA, FSA/RHS & VA B) Conventional C) Refinancings D) Home Improvement Loans E) Loans on Dwellings For 5+ Families F) Non-occupant Loans on Number Average Value Number Average Value Number Average Value Number Average Value Number Average Value Number Average Value
LOANS ORIGINATED 17 $43,944 117 $32,801 247 $35,088 70 $11,047 1 $4,334,730 56 $27,206 APPLICATIONS APPROVED, NOT ACCEPTED 0 $0 18 $41,933 73 $41,068 21 $13,267 0 $0 8 $33,195 APPLICATIONS DENIED 4 $33,845 66 $32,379 224 $35,303 96 $9,254 0 $0 22 $24,229 APPLICATIONS WITHDRAWN 4 $35,025 14 $26,364 103 $35,608 7 $12,529 0 $0 9 $32,062 FILES CLOSED FOR INCOMPLETENESS 2 $27,220 9 $29,067 40 $37,020 2 $32,040 0 $0 10 $42,748
Private Mortgage Insurance Companies Aggregated Statistics For Year 2009(Based on 2 full tracts) A) Conventional C) Non-occupant Loans on Number Average Value Number Average Value
LOANS ORIGINATED 2 $26,000 2 $26,000 APPLICATIONS APPROVED, NOT ACCEPTED 0 $0 0 $0 APPLICATIONS DENIED 0 $0 0 $0 APPLICATIONS WITHDRAWN 0 $0 0 $0 FILES CLOSED FOR INCOMPLETENESS 0 $0 0 $0
Aggregated Statistics For Year 2007(Based on 7 full and 6 partial tracts) A) Conventional B) Refinancings C) Non-occupant Loans on Number Average Value Number Average Value Number Average Value
LOANS ORIGINATED 56 $43,746 15 $51,581 21 $25,540 APPLICATIONS APPROVED, NOT ACCEPTED 11 $49,762 5 $40,736 7 $31,369 APPLICATIONS DENIED 2 $12,975 0 $0 2 $12,975 APPLICATIONS WITHDRAWN 2 $27,465 3 $54,333 0 $0 FILES CLOSED FOR INCOMPLETENESS 0 $0 0 $0 0 $0
Aggregated Statistics For Year 2006(Based on 7 full and 4 partial tracts) A) Conventional B) Refinancings C) Non-occupant Loans on Number Average Value Number Average Value Number Average Value
LOANS ORIGINATED 44 $38,288 21 $51,010 19 $39,069 APPLICATIONS APPROVED, NOT ACCEPTED 6 $31,708 3 $28,310 2 $30,210 APPLICATIONS DENIED 2 $49,000 0 $0 0 $0 APPLICATIONS WITHDRAWN 4 $71,632 0 $0 2 $60,870 FILES CLOSED FOR INCOMPLETENESS 0 $0 0 $0 0 $0
Aggregated Statistics For Year 2005(Based on 6 full and 8 partial tracts) A) Conventional B) Refinancings C) Non-occupant Loans on Number Average Value Number Average Value Number Average Value
LOANS ORIGINATED 59 $32,585 19 $64,565 44 $29,578 APPLICATIONS APPROVED, NOT ACCEPTED 11 $40,935 8 $61,878 7 $37,516 APPLICATIONS DENIED 0 $0 0 $0 0 $0 APPLICATIONS WITHDRAWN 0 $0 2 $71,890 0 $0 FILES CLOSED FOR INCOMPLETENESS 0 $0 0 $0 0 $0
Aggregated Statistics For Year 2004(Based on 8 full and 8 partial tracts) A) Conventional B) Refinancings C) Non-occupant Loans on Number Average Value Number Average Value Number Average Value
LOANS ORIGINATED 55 $39,295 23 $56,673 8 $38,729 APPLICATIONS APPROVED, NOT ACCEPTED 9 $45,208 11 $62,273 4 $39,438 APPLICATIONS DENIED 3 $40,763 0 $0 0 $0 APPLICATIONS WITHDRAWN 0 $0 4 $119,612 2 $51,000 FILES CLOSED FOR INCOMPLETENESS 2 $47,940 0 $0 2 $47,940
Aggregated Statistics For Year 2002(Based on 9 full and 8 partial tracts) A) Conventional B) Refinancings C) Non-occupant Loans on Number Average Value Number Average Value Number Average Value
LOANS ORIGINATED 67 $41,021 43 $47,978 21 $30,522 APPLICATIONS APPROVED, NOT ACCEPTED 13 $49,553 11 $61,731 5 $25,804 APPLICATIONS DENIED 2 $43,910 2 $127,000 2 $127,000 APPLICATIONS WITHDRAWN 4 $57,452 9 $36,443 2 $52,890 FILES CLOSED FOR INCOMPLETENESS 1 $27,050 4 $52,265 1 $27,050
Aggregated Statistics For Year 2001(Based on 6 full and 6 partial tracts) A) Conventional B) Refinancings C) Non-occupant Loans on Number Average Value Number Average Value Number Average Value
LOANS ORIGINATED 48 $37,096 19 $48,112 7 $31,293 APPLICATIONS APPROVED, NOT ACCEPTED 6 $46,863 7 $47,947 2 $33,815 APPLICATIONS DENIED 0 $0 4 $46,532 0 $0 APPLICATIONS WITHDRAWN 2 $59,000 0 $0 0 $0 FILES CLOSED FOR INCOMPLETENESS 0 $0 0 $0 0 $0
Aggregated Statistics For Year 2000(Based on 7 full and 10 partial tracts) A) Conventional B) Refinancings C) Non-occupant Loans on Number Average Value Number Average Value Number Average Value
LOANS ORIGINATED 56 $35,252 23 $38,710 5 $26,490 APPLICATIONS APPROVED, NOT ACCEPTED 12 $36,733 5 $45,042 0 $0 APPLICATIONS DENIED 8 $29,079 0 $0 6 $25,135 APPLICATIONS WITHDRAWN 6 $82,642 0 $0 0 $0 FILES CLOSED FOR INCOMPLETENESS 0 $0 0 $0 0 $0
Aggregated Statistics For Year 1999(Based on 4 full and 4 partial tracts) A) Conventional B) Refinancings C) Non-occupant Loans on Number Average Value Number Average Value Number Average Value
LOANS ORIGINATED 20 $44,397 6 $42,083 4 $27,505 APPLICATIONS APPROVED, NOT ACCEPTED 4 $37,998 0 $0 0 $0 APPLICATIONS DENIED 2 $29,665 0 $0 1 $24,910 APPLICATIONS WITHDRAWN 0 $0 0 $0 0 $0 FILES CLOSED FOR INCOMPLETENESS 1 $29,700 0 $0 0 $0
2003 - 2018 National Fire Incident Reporting System (NFIRS) incidents See full 2006 National Fire Incident Reporting System statistics for zip code 44502, Ohio
Most common first names in zip code 44502 among deceased individuals Name Count Lived (average)
John 384 74.4 years Mary 317 79.1 years Joseph 198 74.1 years William 175 70.8 years James 156 70.2 years Anna 143 81.3 years George 134 71.7 years Frank 121 74.6 years Helen 109 79.0 years Charles 102 74.0 years
Most common last names in zip code 44502 among deceased individuals Last name Count Lived (average)
Williams 51 69.8 years Jones 46 70.3 years Smith 45 68.9 years Thomas 43 68.3 years Johnson 36 70.0 years Davis 35 73.8 years Miller 33 71.6 years Brown 29 72.5 years Moore 25 71.5 years Jackson 24 71.7 years
Businesses in zip code 44502
Name Count Name Count
GNC 1 Taco Bell 1 KFC 1 U-Haul 1 McDonald's 2 UPS 1 Rite Aid 1 Walgreens 1 Subway 1
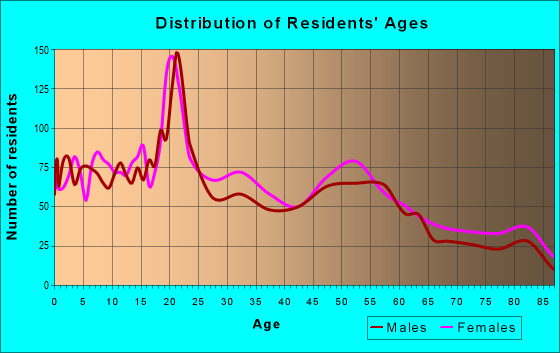
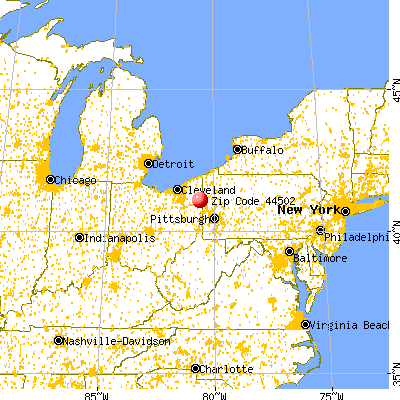


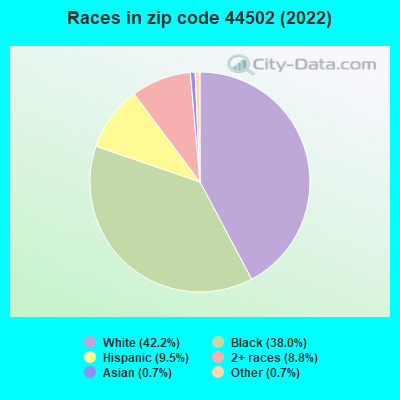


 Nearest zip codes: 44506, 44507, 44503, 44504, 44405, 44505.
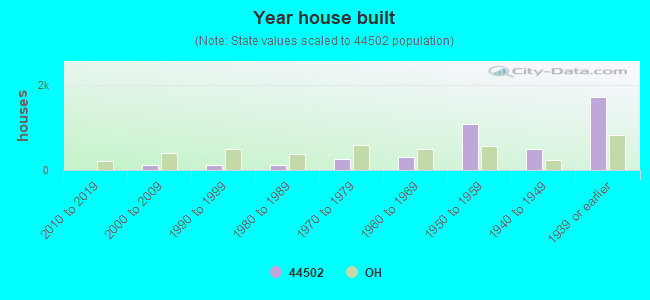
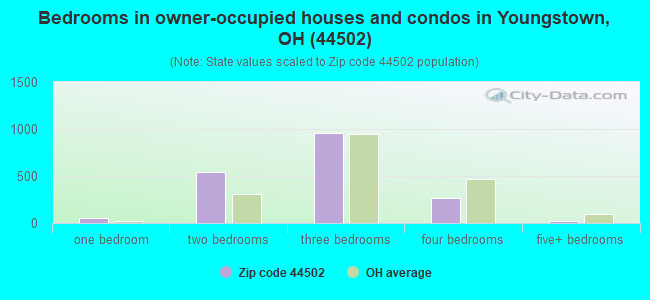
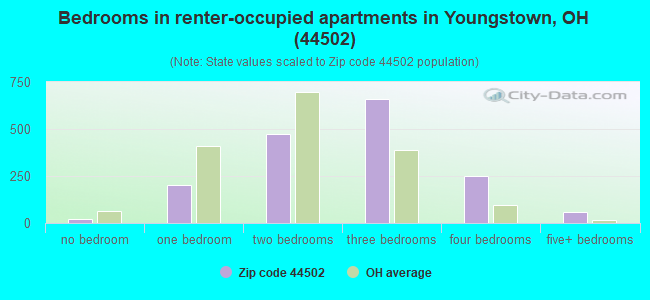
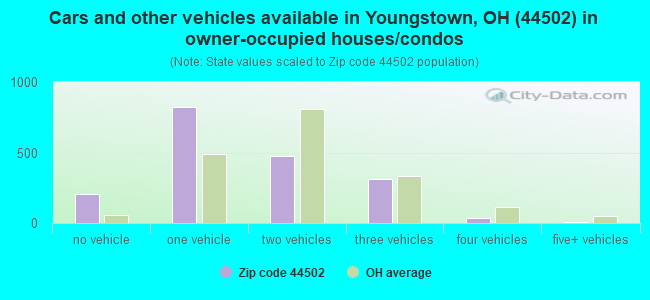
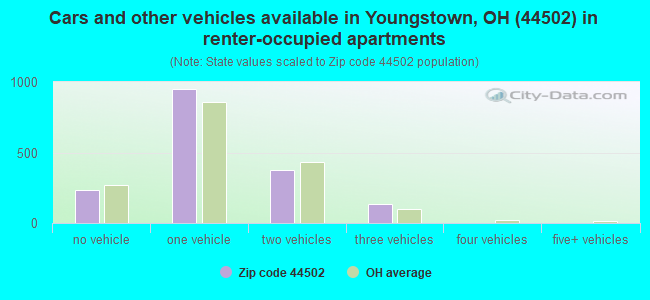


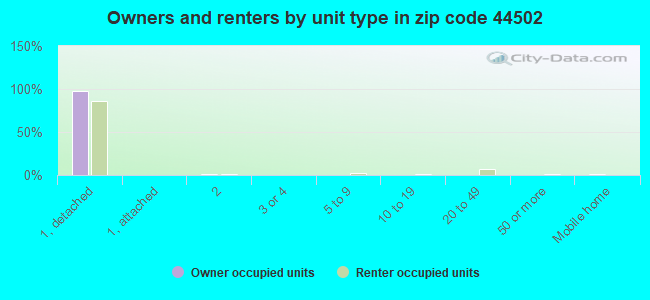
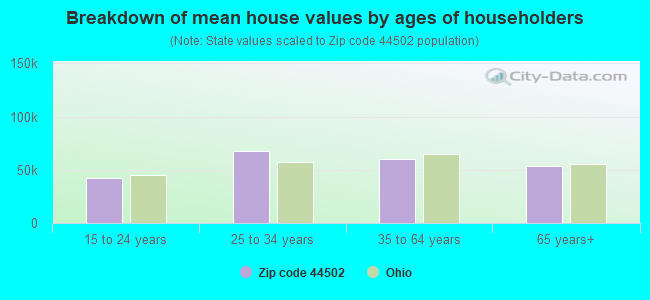


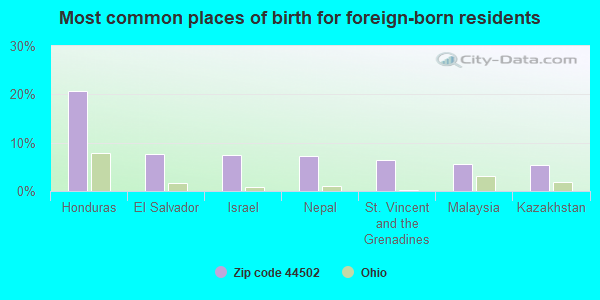
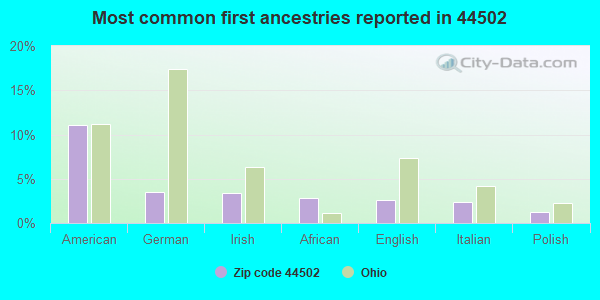
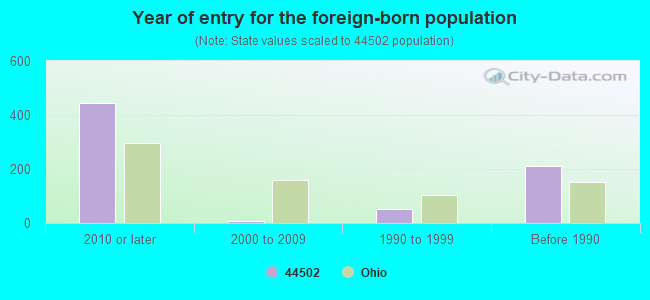


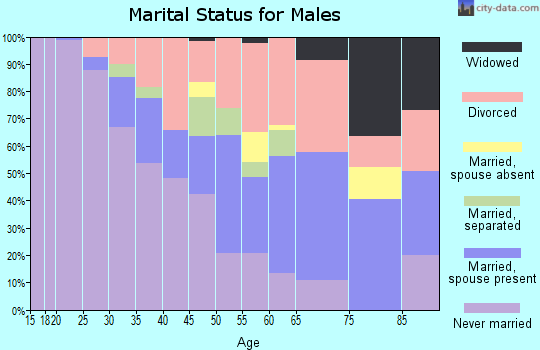
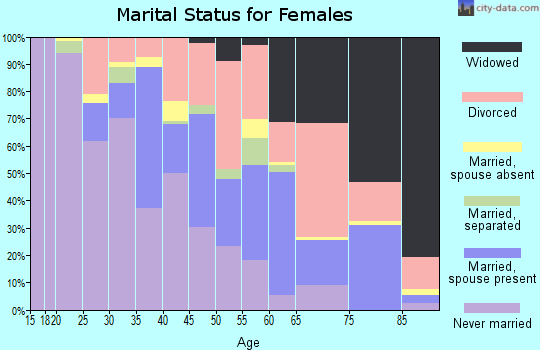
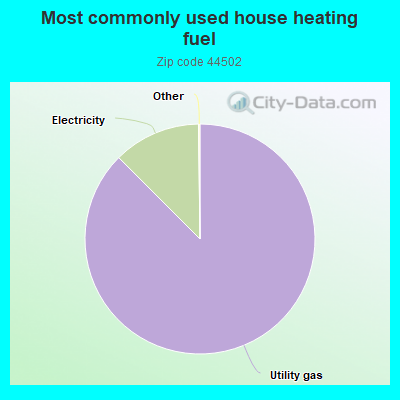
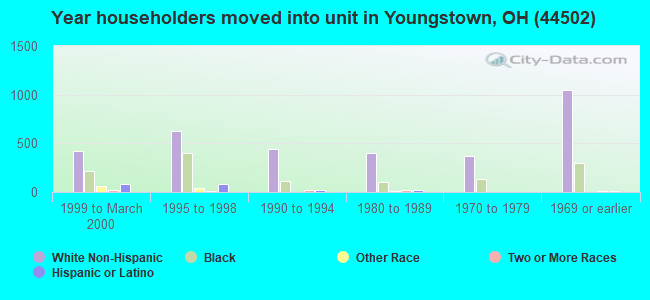
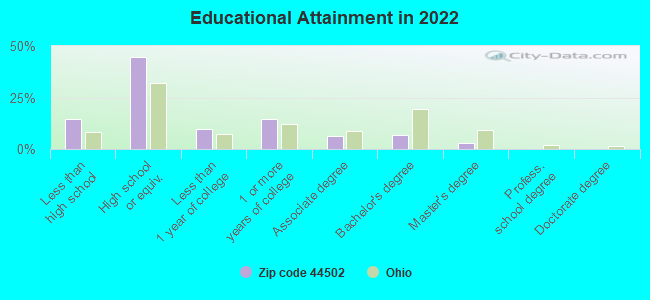
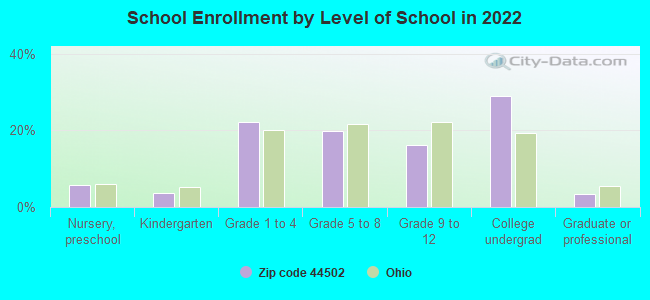
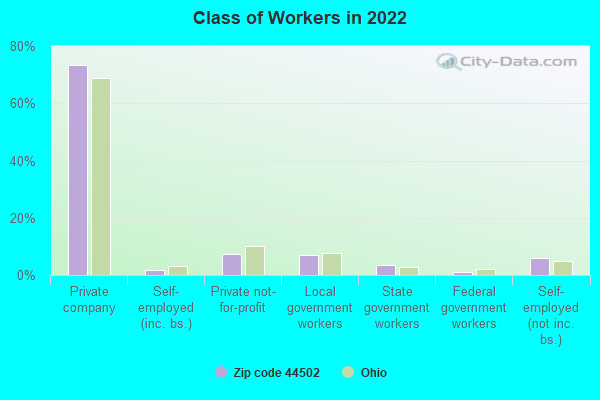
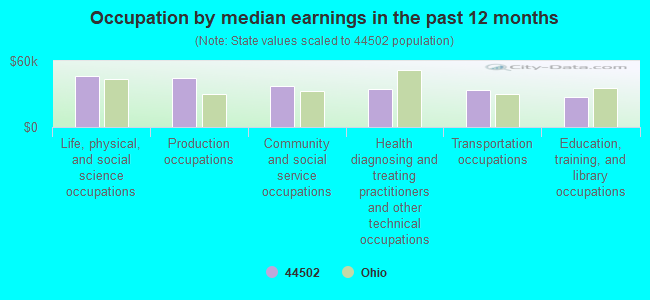
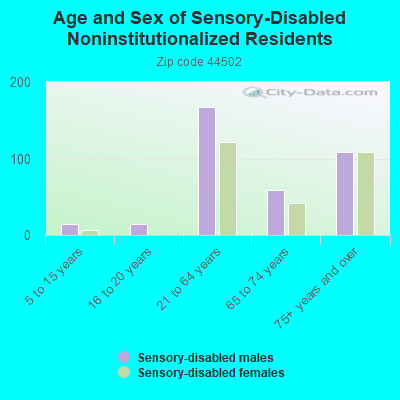
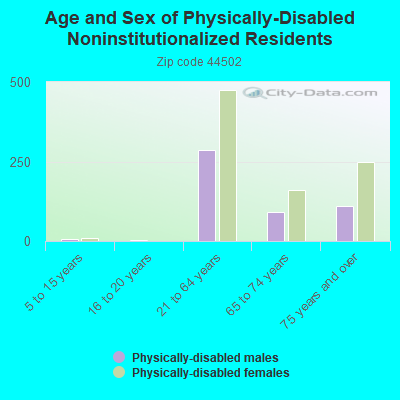
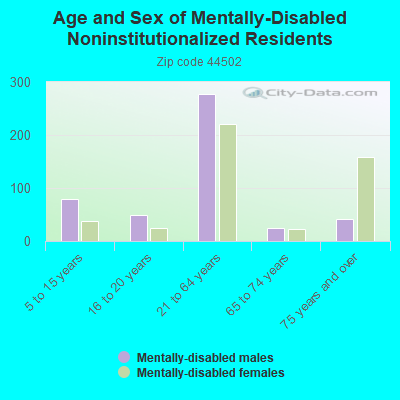
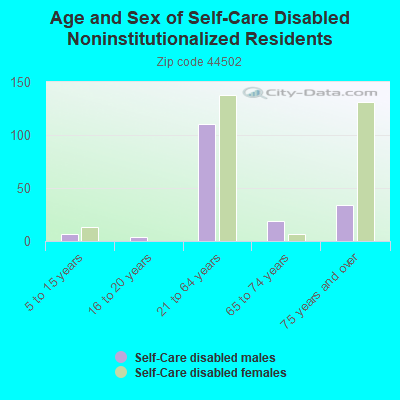
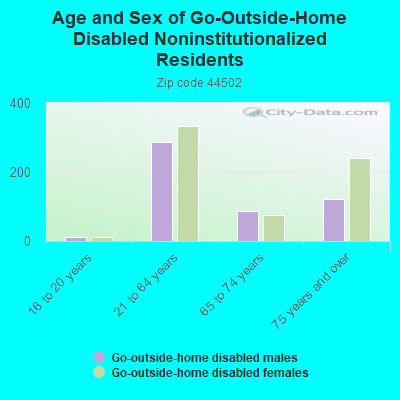
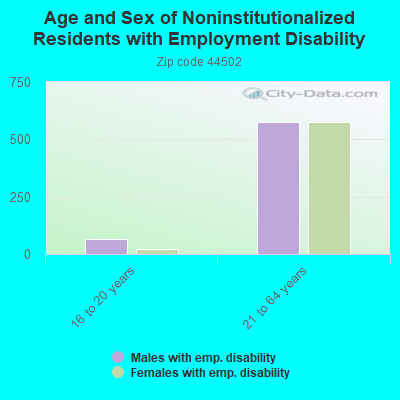
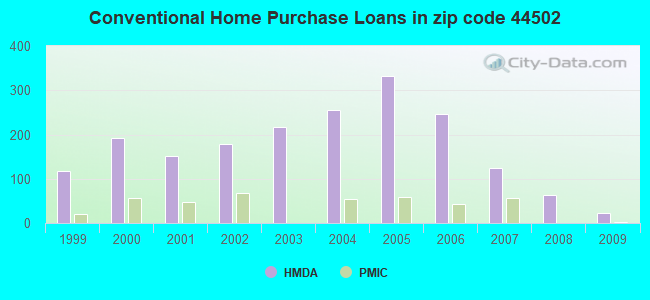
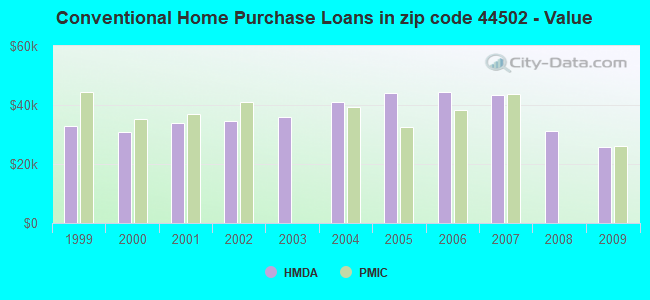
 Based on the data from the years 2003 - 2018 the average number of fire incidents per year is 234. The highest number of fires - 551 took place in 2006, and the least - 84 in 2017. The data has a decreasing trend.
 When looking into fire subcategories, the most incidents belonged to: Structure Fires (42.6%), and Outside Fires (31.1%).