Estimated zip code population in 2022: 11,026
Zip code population in 2010: 11,975
Zip code population in 2000: 13,573
Houses and condos: 5,682
Renter-occupied apartments: 1,960
% of renters here:
38%State:
33%
March 2022 cost of living index in zip code 44509: 88.5
(less than average, U.S. average is 100)
Land area: 5.5
sq. mi.
Water area: 0.1
sq. mi.
Population density: 2,020 people per square mile (low).
OSM Map
General Map
Google Map
MSN Map
OSM Map
General Map
Google Map
MSN Map
OSM Map
General Map
Google Map
MSN Map
OSM Map
General Map
Google Map
MSN Map
Please wait while loading the map...
Real estate property taxes paid for housing units in 2022:
This zip code:
1.6% ($943)Ohio:
1.3% ($2,639)
Median real estate property taxes paid for housing units with mortgages in 2022: $1,201 (1.9%)
Median real estate property taxes paid for housing units with no mortgage in 2022: $731 (1.4%)
Business Search - 14 Million verified businesses
Males: 5,284 Females: 5,741
For population 25 years and over in 44509:
High school or higher: 83.5%Bachelor's degree or higher: 15.9%Graduate or professional degree: 5.2%Unemployed: 7.3%Mean travel time to work (commute): 21.3 minutes
For population 15 years and over in 44509:
Never married: 41.2%Now married: 33.1%Separated: 2.4%Widowed: 8.7%Divorced: 14.5%
Zip code 44509 compared to state average:
Median household income below state average. Median house value significantly below state average. Unemployed percentage above state average. Black race population percentage above state average. Hispanic race population percentage above state average. Length of stay since moving in significantly above state average. House age above state average. Percentage of population with a bachelor's degree or higher below state average. 6,577 59.7% White 2,855 25.9% Black 1,062 9.6% Hispanic or Latino 363 3.3% Two or more races 84 0.8% Some other race 57 0.5% American Indian 24 0.2% Asian
Data:
Median household income ($)
Median household income (% change since 2000)
Household income diversity
Ratio of average income to average house value (%)
Ratio of average income to average rent
Median household income ($) - White
Median household income ($) - Black or African American
Median household income ($) - Asian
Median household income ($) - Hispanic or Latino
Median household income ($) - American Indian and Alaska Native
Median household income ($) - Multirace
Median household income ($) - Other Race
Median household income for houses/condos with a mortgage ($)
Median household income for apartments without a mortgage ($)
Races - White alone (%)
Races - White alone (% change since 2000)
Races - Black alone (%)
Races - Black alone (% change since 2000)
Races - American Indian alone (%)
Races - American Indian alone (% change since 2000)
Races - Asian alone (%)
Races - Asian alone (% change since 2000)
Races - Hispanic (%)
Races - Hispanic (% change since 2000)
Races - Native Hawaiian and Other Pacific Islander alone (%)
Races - Native Hawaiian and Other Pacific Islander alone (% change since 2000)
Races - Two or more races (%)
Races - Two or more races (% change since 2000)
Races - Other race alone (%)
Races - Other race alone (% change since 2000)
Racial diversity
Unemployment (%)
Unemployment (% change since 2000)
Unemployment (%) - White
Unemployment (%) - Black or African American
Unemployment (%) - Asian
Unemployment (%) - Hispanic or Latino
Unemployment (%) - American Indian and Alaska Native
Unemployment (%) - Multirace
Unemployment (%) - Other Race
Population density (people per square mile)
Population - Males (%)
Population - Females (%)
Population - Males (%) - White
Population - Males (%) - Black or African American
Population - Males (%) - Asian
Population - Males (%) - Hispanic or Latino
Population - Males (%) - American Indian and Alaska Native
Population - Males (%) - Multirace
Population - Males (%) - Other Race
Population - Females (%) - White
Population - Females (%) - Black or African American
Population - Females (%) - Asian
Population - Females (%) - Hispanic or Latino
Population - Females (%) - American Indian and Alaska Native
Population - Females (%) - Multirace
Population - Females (%) - Other Race
Coronavirus confirmed cases (May 04, 2024)
Deaths caused by coronavirus (May 04, 2024)
Coronavirus confirmed cases (per 100k population) (May 04, 2024)
Deaths caused by coronavirus (per 100k population) (May 04, 2024)
Daily increase in number of cases (May 04, 2024)
Weekly increase in number of cases (May 04, 2024)
Cases doubled (in days) (May 04, 2024)
Hospitalized patients (Apr 18, 2022)
Negative test results (Apr 18, 2022)
Total test results (Apr 18, 2022)
COVID Vaccine doses distributed (per 100k population) (Sep 19, 2023)
COVID Vaccine doses administered (per 100k population) (Sep 19, 2023)
COVID Vaccine doses distributed (Sep 19, 2023)
COVID Vaccine doses administered (Sep 19, 2023)
Likely homosexual households (%)
Likely homosexual households (% change since 2000)
Likely homosexual households - Lesbian couples (%)
Likely homosexual households - Lesbian couples (% change since 2000)
Likely homosexual households - Gay men (%)
Likely homosexual households - Gay men (% change since 2000)
Cost of living index
Median gross rent ($)
Median contract rent ($)
Median monthly housing costs ($)
Median house or condo value ($)
Median house or condo value ($ change since 2000)
Mean house or condo value by units in structure - 1, detached ($)
Mean house or condo value by units in structure - 1, attached ($)
Mean house or condo value by units in structure - 2 ($)
Mean house or condo value by units in structure by units in structure - 3 or 4 ($)
Mean house or condo value by units in structure - 5 or more ($)
Mean house or condo value by units in structure - Boat, RV, van, etc. ($)
Mean house or condo value by units in structure - Mobile home ($)
Median house or condo value ($) - White
Median house or condo value ($) - Black or African American
Median house or condo value ($) - Asian
Median house or condo value ($) - Hispanic or Latino
Median house or condo value ($) - American Indian and Alaska Native
Median house or condo value ($) - Multirace
Median house or condo value ($) - Other Race
Median resident age
Resident age diversity
Median resident age - Males
Median resident age - Females
Median resident age - White
Median resident age - Black or African American
Median resident age - Asian
Median resident age - Hispanic or Latino
Median resident age - American Indian and Alaska Native
Median resident age - Multirace
Median resident age - Other Race
Median resident age - Males - White
Median resident age - Males - Black or African American
Median resident age - Males - Asian
Median resident age - Males - Hispanic or Latino
Median resident age - Males - American Indian and Alaska Native
Median resident age - Males - Multirace
Median resident age - Males - Other Race
Median resident age - Females - White
Median resident age - Females - Black or African American
Median resident age - Females - Asian
Median resident age - Females - Hispanic or Latino
Median resident age - Females - American Indian and Alaska Native
Median resident age - Females - Multirace
Median resident age - Females - Other Race
Commute - mean travel time to work (minutes)
Travel time to work - Less than 5 minutes (%)
Travel time to work - Less than 5 minutes (% change since 2000)
Travel time to work - 5 to 9 minutes (%)
Travel time to work - 5 to 9 minutes (% change since 2000)
Travel time to work - 10 to 19 minutes (%)
Travel time to work - 10 to 19 minutes (% change since 2000)
Travel time to work - 20 to 29 minutes (%)
Travel time to work - 20 to 29 minutes (% change since 2000)
Travel time to work - 30 to 39 minutes (%)
Travel time to work - 30 to 39 minutes (% change since 2000)
Travel time to work - 40 to 59 minutes (%)
Travel time to work - 40 to 59 minutes (% change since 2000)
Travel time to work - 60 to 89 minutes (%)
Travel time to work - 60 to 89 minutes (% change since 2000)
Travel time to work - 90 or more minutes (%)
Travel time to work - 90 or more minutes (% change since 2000)
Marital status - Never married (%)
Marital status - Now married (%)
Marital status - Separated (%)
Marital status - Widowed (%)
Marital status - Divorced (%)
Median family income ($)
Median family income (% change since 2000)
Median non-family income ($)
Median non-family income (% change since 2000)
Median per capita income ($)
Median per capita income (% change since 2000)
Median family income ($) - White
Median family income ($) - Black or African American
Median family income ($) - Asian
Median family income ($) - Hispanic or Latino
Median family income ($) - American Indian and Alaska Native
Median family income ($) - Multirace
Median family income ($) - Other Race
Median year house/condo built
Median year apartment built
Year house built - Built 2005 or later (%)
Year house built - Built 2000 to 2004 (%)
Year house built - Built 1990 to 1999 (%)
Year house built - Built 1980 to 1989 (%)
Year house built - Built 1970 to 1979 (%)
Year house built - Built 1960 to 1969 (%)
Year house built - Built 1950 to 1959 (%)
Year house built - Built 1940 to 1949 (%)
Year house built - Built 1939 or earlier (%)
Average household size
Household density (households per square mile)
Average household size - White
Average household size - Black or African American
Average household size - Asian
Average household size - Hispanic or Latino
Average household size - American Indian and Alaska Native
Average household size - Multirace
Average household size - Other Race
Occupied housing units (%)
Vacant housing units (%)
Owner occupied housing units (%)
Renter occupied housing units (%)
Vacancy status - For rent (%)
Vacancy status - For sale only (%)
Vacancy status - Rented or sold, not occupied (%)
Vacancy status - For seasonal, recreational, or occasional use (%)
Vacancy status - For migrant workers (%)
Vacancy status - Other vacant (%)
Residents with income below the poverty level (%)
Residents with income below 50% of the poverty level (%)
Children below poverty level (%)
Poor families by family type - Married-couple family (%)
Poor families by family type - Male, no wife present (%)
Poor families by family type - Female, no husband present (%)
Poverty status for native-born residents (%)
Poverty status for foreign-born residents (%)
Poverty among high school graduates not in families (%)
Poverty among people who did not graduate high school not in families (%)
Residents with income below the poverty level (%) - White
Residents with income below the poverty level (%) - Black or African American
Residents with income below the poverty level (%) - Asian
Residents with income below the poverty level (%) - Hispanic or Latino
Residents with income below the poverty level (%) - American Indian and Alaska Native
Residents with income below the poverty level (%) - Multirace
Residents with income below the poverty level (%) - Other Race
Air pollution - Air Quality Index (AQI)
Air pollution - CO
Air pollution - NO2
Air pollution - SO2
Air pollution - Ozone
Air pollution - PM10
Air pollution - PM25
Air pollution - Pb
Crime - Murders per 100,000 population
Crime - Rapes per 100,000 population
Crime - Robberies per 100,000 population
Crime - Assaults per 100,000 population
Crime - Burglaries per 100,000 population
Crime - Thefts per 100,000 population
Crime - Auto thefts per 100,000 population
Crime - Arson per 100,000 population
Crime - City-data.com crime index
Crime - Violent crime index
Crime - Property crime index
Crime - Murders per 100,000 population (5 year average)
Crime - Rapes per 100,000 population (5 year average)
Crime - Robberies per 100,000 population (5 year average)
Crime - Assaults per 100,000 population (5 year average)
Crime - Burglaries per 100,000 population (5 year average)
Crime - Thefts per 100,000 population (5 year average)
Crime - Auto thefts per 100,000 population (5 year average)
Crime - Arson per 100,000 population (5 year average)
Crime - City-data.com crime index (5 year average)
Crime - Violent crime index (5 year average)
Crime - Property crime index (5 year average)
1996 Presidential Elections Results (%) - Democratic Party (Clinton)
1996 Presidential Elections Results (%) - Republican Party (Dole)
1996 Presidential Elections Results (%) - Other
2000 Presidential Elections Results (%) - Democratic Party (Gore)
2000 Presidential Elections Results (%) - Republican Party (Bush)
2000 Presidential Elections Results (%) - Other
2004 Presidential Elections Results (%) - Democratic Party (Kerry)
2004 Presidential Elections Results (%) - Republican Party (Bush)
2004 Presidential Elections Results (%) - Other
2008 Presidential Elections Results (%) - Democratic Party (Obama)
2008 Presidential Elections Results (%) - Republican Party (McCain)
2008 Presidential Elections Results (%) - Other
2012 Presidential Elections Results (%) - Democratic Party (Obama)
2012 Presidential Elections Results (%) - Republican Party (Romney)
2012 Presidential Elections Results (%) - Other
2016 Presidential Elections Results (%) - Democratic Party (Clinton)
2016 Presidential Elections Results (%) - Republican Party (Trump)
2016 Presidential Elections Results (%) - Other
2020 Presidential Elections Results (%) - Democratic Party (Biden)
2020 Presidential Elections Results (%) - Republican Party (Trump)
2020 Presidential Elections Results (%) - Other
Ancestries Reported - Arab (%)
Ancestries Reported - Czech (%)
Ancestries Reported - Danish (%)
Ancestries Reported - Dutch (%)
Ancestries Reported - English (%)
Ancestries Reported - French (%)
Ancestries Reported - French Canadian (%)
Ancestries Reported - German (%)
Ancestries Reported - Greek (%)
Ancestries Reported - Hungarian (%)
Ancestries Reported - Irish (%)
Ancestries Reported - Italian (%)
Ancestries Reported - Lithuanian (%)
Ancestries Reported - Norwegian (%)
Ancestries Reported - Polish (%)
Ancestries Reported - Portuguese (%)
Ancestries Reported - Russian (%)
Ancestries Reported - Scotch-Irish (%)
Ancestries Reported - Scottish (%)
Ancestries Reported - Slovak (%)
Ancestries Reported - Subsaharan African (%)
Ancestries Reported - Swedish (%)
Ancestries Reported - Swiss (%)
Ancestries Reported - Ukrainian (%)
Ancestries Reported - United States (%)
Ancestries Reported - Welsh (%)
Ancestries Reported - West Indian (%)
Ancestries Reported - Other (%)
Educational Attainment - No schooling completed (%)
Educational Attainment - Less than high school (%)
Educational Attainment - High school or equivalent (%)
Educational Attainment - Less than 1 year of college (%)
Educational Attainment - 1 or more years of college (%)
Educational Attainment - Associate degree (%)
Educational Attainment - Bachelor's degree (%)
Educational Attainment - Master's degree (%)
Educational Attainment - Professional school degree (%)
Educational Attainment - Doctorate degree (%)
School Enrollment - Nursery, preschool (%)
School Enrollment - Kindergarten (%)
School Enrollment - Grade 1 to 4 (%)
School Enrollment - Grade 5 to 8 (%)
School Enrollment - Grade 9 to 12 (%)
School Enrollment - College undergrad (%)
School Enrollment - Graduate or professional (%)
School Enrollment - Not enrolled in school (%)
School enrollment - Public schools (%)
School enrollment - Private schools (%)
School enrollment - Not enrolled (%)
Median number of rooms in houses and condos
Median number of rooms in apartments
Housing units lacking complete plumbing facilities (%)
Housing units lacking complete kitchen facilities (%)
Density of houses
Urban houses (%)
Rural houses (%)
Households with people 60 years and over (%)
Households with people 65 years and over (%)
Households with people 75 years and over (%)
Households with one or more nonrelatives (%)
Households with no nonrelatives (%)
Population in households (%)
Family households (%)
Nonfamily households (%)
Population in families (%)
Family households with own children (%)
Median number of bedrooms in owner occupied houses
Mean number of bedrooms in owner occupied houses
Median number of bedrooms in renter occupied houses
Mean number of bedrooms in renter occupied houses
Median number of vehichles in owner occupied houses
Mean number of vehichles in owner occupied houses
Median number of vehichles in renter occupied houses
Mean number of vehichles in renter occupied houses
Mortgage status - with mortgage (%)
Mortgage status - with second mortgage (%)
Mortgage status - with home equity loan (%)
Mortgage status - with both second mortgage and home equity loan (%)
Mortgage status - without a mortgage (%)
Average family size
Average family size - White
Average family size - Black or African American
Average family size - Asian
Average family size - Hispanic or Latino
Average family size - American Indian and Alaska Native
Average family size - Multirace
Average family size - Other Race
Geographical mobility - Same house 1 year ago (%)
Geographical mobility - Moved within same county (%)
Geographical mobility - Moved from different county within same state (%)
Geographical mobility - Moved from different state (%)
Geographical mobility - Moved from abroad (%)
Place of birth - Born in state of residence (%)
Place of birth - Born in other state (%)
Place of birth - Native, outside of US (%)
Place of birth - Foreign born (%)
Housing units in structures - 1, detached (%)
Housing units in structures - 1, attached (%)
Housing units in structures - 2 (%)
Housing units in structures - 3 or 4 (%)
Housing units in structures - 5 to 9 (%)
Housing units in structures - 10 to 19 (%)
Housing units in structures - 20 to 49 (%)
Housing units in structures - 50 or more (%)
Housing units in structures - Mobile home (%)
Housing units in structures - Boat, RV, van, etc. (%)
House/condo owner moved in on average (years ago)
Renter moved in on average (years ago)
Year householder moved into unit - Moved in 1999 to March 2000 (%)
Year householder moved into unit - Moved in 1995 to 1998 (%)
Year householder moved into unit - Moved in 1990 to 1994 (%)
Year householder moved into unit - Moved in 1980 to 1989 (%)
Year householder moved into unit - Moved in 1970 to 1979 (%)
Year householder moved into unit - Moved in 1969 or earlier (%)
Means of transportation to work - Drove car alone (%)
Means of transportation to work - Carpooled (%)
Means of transportation to work - Public transportation (%)
Means of transportation to work - Bus or trolley bus (%)
Means of transportation to work - Streetcar or trolley car (%)
Means of transportation to work - Subway or elevated (%)
Means of transportation to work - Railroad (%)
Means of transportation to work - Ferryboat (%)
Means of transportation to work - Taxicab (%)
Means of transportation to work - Motorcycle (%)
Means of transportation to work - Bicycle (%)
Means of transportation to work - Walked (%)
Means of transportation to work - Other means (%)
Working at home (%)
Industry diversity
Most Common Industries - Agriculture, forestry, fishing and hunting, and mining (%)
Most Common Industries - Agriculture, forestry, fishing and hunting (%)
Most Common Industries - Mining, quarrying, and oil and gas extraction (%)
Most Common Industries - Construction (%)
Most Common Industries - Manufacturing (%)
Most Common Industries - Wholesale trade (%)
Most Common Industries - Retail trade (%)
Most Common Industries - Transportation and warehousing, and utilities (%)
Most Common Industries - Transportation and warehousing (%)
Most Common Industries - Utilities (%)
Most Common Industries - Information (%)
Most Common Industries - Finance and insurance, and real estate and rental and leasing (%)
Most Common Industries - Finance and insurance (%)
Most Common Industries - Real estate and rental and leasing (%)
Most Common Industries - Professional, scientific, and management, and administrative and waste management services (%)
Most Common Industries - Professional, scientific, and technical services (%)
Most Common Industries - Management of companies and enterprises (%)
Most Common Industries - Administrative and support and waste management services (%)
Most Common Industries - Educational services, and health care and social assistance (%)
Most Common Industries - Educational services (%)
Most Common Industries - Health care and social assistance (%)
Most Common Industries - Arts, entertainment, and recreation, and accommodation and food services (%)
Most Common Industries - Arts, entertainment, and recreation (%)
Most Common Industries - Accommodation and food services (%)
Most Common Industries - Other services, except public administration (%)
Most Common Industries - Public administration (%)
Occupation diversity
Most Common Occupations - Management, business, science, and arts occupations (%)
Most Common Occupations - Management, business, and financial occupations (%)
Most Common Occupations - Management occupations (%)
Most Common Occupations - Business and financial operations occupations (%)
Most Common Occupations - Computer, engineering, and science occupations (%)
Most Common Occupations - Computer and mathematical occupations (%)
Most Common Occupations - Architecture and engineering occupations (%)
Most Common Occupations - Life, physical, and social science occupations (%)
Most Common Occupations - Education, legal, community service, arts, and media occupations (%)
Most Common Occupations - Community and social service occupations (%)
Most Common Occupations - Legal occupations (%)
Most Common Occupations - Education, training, and library occupations (%)
Most Common Occupations - Arts, design, entertainment, sports, and media occupations (%)
Most Common Occupations - Healthcare practitioners and technical occupations (%)
Most Common Occupations - Health diagnosing and treating practitioners and other technical occupations (%)
Most Common Occupations - Health technologists and technicians (%)
Most Common Occupations - Service occupations (%)
Most Common Occupations - Healthcare support occupations (%)
Most Common Occupations - Protective service occupations (%)
Most Common Occupations - Fire fighting and prevention, and other protective service workers including supervisors (%)
Most Common Occupations - Law enforcement workers including supervisors (%)
Most Common Occupations - Food preparation and serving related occupations (%)
Most Common Occupations - Building and grounds cleaning and maintenance occupations (%)
Most Common Occupations - Personal care and service occupations (%)
Most Common Occupations - Sales and office occupations (%)
Most Common Occupations - Sales and related occupations (%)
Most Common Occupations - Office and administrative support occupations (%)
Most Common Occupations - Natural resources, construction, and maintenance occupations (%)
Most Common Occupations - Farming, fishing, and forestry occupations (%)
Most Common Occupations - Construction and extraction occupations (%)
Most Common Occupations - Installation, maintenance, and repair occupations (%)
Most Common Occupations - Production, transportation, and material moving occupations (%)
Most Common Occupations - Production occupations (%)
Most Common Occupations - Transportation occupations (%)
Most Common Occupations - Material moving occupations (%)
People in Group quarters - Institutionalized population (%)
People in Group quarters - Correctional institutions (%)
People in Group quarters - Federal prisons and detention centers (%)
People in Group quarters - Halfway houses (%)
People in Group quarters - Local jails and other confinement facilities (including police lockups) (%)
People in Group quarters - Military disciplinary barracks (%)
People in Group quarters - State prisons (%)
People in Group quarters - Other types of correctional institutions (%)
People in Group quarters - Nursing homes (%)
People in Group quarters - Hospitals/wards, hospices, and schools for the handicapped (%)
People in Group quarters - Hospitals/wards and hospices for chronically ill (%)
People in Group quarters - Hospices or homes for chronically ill (%)
People in Group quarters - Military hospitals or wards for chronically ill (%)
People in Group quarters - Other hospitals or wards for chronically ill (%)
People in Group quarters - Hospitals or wards for drug/alcohol abuse (%)
People in Group quarters - Mental (Psychiatric) hospitals or wards (%)
People in Group quarters - Schools, hospitals, or wards for the mentally retarded (%)
People in Group quarters - Schools, hospitals, or wards for the physically handicapped (%)
People in Group quarters - Institutions for the deaf (%)
People in Group quarters - Institutions for the blind (%)
People in Group quarters - Orthopedic wards and institutions for the physically handicapped (%)
People in Group quarters - Wards in general hospitals for patients who have no usual home elsewhere (%)
People in Group quarters - Wards in military hospitals for patients who have no usual home elsewhere (%)
People in Group quarters - Juvenile institutions (%)
People in Group quarters - Long-term care (%)
People in Group quarters - Homes for abused, dependent, and neglected children (%)
People in Group quarters - Residential treatment centers for emotionally disturbed children (%)
People in Group quarters - Training schools for juvenile delinquents (%)
People in Group quarters - Short-term care, detention or diagnostic centers for delinquent children (%)
People in Group quarters - Type of juvenile institution unknown (%)
People in Group quarters - Noninstitutionalized population (%)
People in Group quarters - College dormitories (includes college quarters off campus) (%)
People in Group quarters - Military quarters (%)
People in Group quarters - On base (%)
People in Group quarters - Barracks, unaccompanied personnel housing (UPH), (Enlisted/Officer), ;and similar group living quarters for military personnel (%)
People in Group quarters - Transient quarters for temporary residents (%)
People in Group quarters - Military ships (%)
People in Group quarters - Group homes (%)
People in Group quarters - Homes or halfway houses for drug/alcohol abuse (%)
People in Group quarters - Homes for the mentally ill (%)
People in Group quarters - Homes for the mentally retarded (%)
People in Group quarters - Homes for the physically handicapped (%)
People in Group quarters - Other group homes (%)
People in Group quarters - Religious group quarters (%)
People in Group quarters - Dormitories (%)
People in Group quarters - Agriculture workers' dormitories on farms (%)
People in Group quarters - Job Corps and vocational training facilities (%)
People in Group quarters - Other workers' dormitories (%)
People in Group quarters - Crews of maritime vessels (%)
People in Group quarters - Other nonhousehold living situations (%)
People in Group quarters - Other noninstitutional group quarters (%)
Residents speaking English at home (%)
Residents speaking English at home - Born in the United States (%)
Residents speaking English at home - Native, born elsewhere (%)
Residents speaking English at home - Foreign born (%)
Residents speaking Spanish at home (%)
Residents speaking Spanish at home - Born in the United States (%)
Residents speaking Spanish at home - Native, born elsewhere (%)
Residents speaking Spanish at home - Foreign born (%)
Residents speaking other language at home (%)
Residents speaking other language at home - Born in the United States (%)
Residents speaking other language at home - Native, born elsewhere (%)
Residents speaking other language at home - Foreign born (%)
Class of Workers - Employee of private company (%)
Class of Workers - Self-employed in own incorporated business (%)
Class of Workers - Private not-for-profit wage and salary workers (%)
Class of Workers - Local government workers (%)
Class of Workers - State government workers (%)
Class of Workers - Federal government workers (%)
Class of Workers - Self-employed workers in own not incorporated business and Unpaid family workers (%)
House heating fuel used in houses and condos - Utility gas (%)
House heating fuel used in houses and condos - Bottled, tank, or LP gas (%)
House heating fuel used in houses and condos - Electricity (%)
House heating fuel used in houses and condos - Fuel oil, kerosene, etc. (%)
House heating fuel used in houses and condos - Coal or coke (%)
House heating fuel used in houses and condos - Wood (%)
House heating fuel used in houses and condos - Solar energy (%)
House heating fuel used in houses and condos - Other fuel (%)
House heating fuel used in houses and condos - No fuel used (%)
House heating fuel used in apartments - Utility gas (%)
House heating fuel used in apartments - Bottled, tank, or LP gas (%)
House heating fuel used in apartments - Electricity (%)
House heating fuel used in apartments - Fuel oil, kerosene, etc. (%)
House heating fuel used in apartments - Coal or coke (%)
House heating fuel used in apartments - Wood (%)
House heating fuel used in apartments - Solar energy (%)
House heating fuel used in apartments - Other fuel (%)
House heating fuel used in apartments - No fuel used (%)
Armed forces status - In Armed Forces (%)
Armed forces status - Civilian (%)
Armed forces status - Civilian - Veteran (%)
Armed forces status - Civilian - Nonveteran (%)
Fatal accidents locations in years 2005-2021
Fatal accidents locations in 2005
Fatal accidents locations in 2006
Fatal accidents locations in 2007
Fatal accidents locations in 2008
Fatal accidents locations in 2009
Fatal accidents locations in 2010
Fatal accidents locations in 2011
Fatal accidents locations in 2012
Fatal accidents locations in 2013
Fatal accidents locations in 2014
Fatal accidents locations in 2015
Fatal accidents locations in 2016
Fatal accidents locations in 2017
Fatal accidents locations in 2018
Fatal accidents locations in 2019
Fatal accidents locations in 2020
Fatal accidents locations in 2021
Alcohol use - People drinking some alcohol every month (%)
Alcohol use - People not drinking at all (%)
Alcohol use - Average days/month drinking alcohol
Alcohol use - Average drinks/week
Alcohol use - Average days/year people drink much
Audiometry - Average condition of hearing (%)
Audiometry - People that can hear a whisper from across a quiet room (%)
Audiometry - People that can hear normal voice from across a quiet room (%)
Audiometry - Ears ringing, roaring, buzzing (%)
Audiometry - Had a job exposure to loud noise (%)
Audiometry - Had off-work exposure to loud noise (%)
Blood Pressure & Cholesterol - Has high blood pressure (%)
Blood Pressure & Cholesterol - Checking blood pressure at home (%)
Blood Pressure & Cholesterol - Frequently checking blood cholesterol (%)
Blood Pressure & Cholesterol - Has high cholesterol level (%)
Consumer Behavior - Money monthly spent on food at supermarket/grocery store
Consumer Behavior - Money monthly spent on food at other stores
Consumer Behavior - Money monthly spent on eating out
Consumer Behavior - Money monthly spent on carryout/delivered foods
Consumer Behavior - Income spent on food at supermarket/grocery store (%)
Consumer Behavior - Income spent on food at other stores (%)
Consumer Behavior - Income spent on eating out (%)
Consumer Behavior - Income spent on carryout/delivered foods (%)
Current Health Status - General health condition (%)
Current Health Status - Blood donors (%)
Current Health Status - Has blood ever tested for HIV virus (%)
Current Health Status - Left-handed people (%)
Dermatology - People using sunscreen (%)
Diabetes - Diabetics (%)
Diabetes - Had a blood test for high blood sugar (%)
Diabetes - People taking insulin (%)
Diet Behavior & Nutrition - Diet health (%)
Diet Behavior & Nutrition - Milk product consumption (# of products/month)
Diet Behavior & Nutrition - Meals not home prepared (#/week)
Diet Behavior & Nutrition - Meals from fast food or pizza place (#/week)
Diet Behavior & Nutrition - Ready-to-eat foods (#/month)
Diet Behavior & Nutrition - Frozen meals/pizza (#/month)
Drug Use - People that ever used marijuana or hashish (%)
Drug Use - Ever used hard drugs (%)
Drug Use - Ever used any form of cocaine (%)
Drug Use - Ever used heroin (%)
Drug Use - Ever used methamphetamine (%)
Health Insurance - People covered by health insurance (%)
Kidney Conditions-Urology - Avg. # of times urinating at night
Medical Conditions - People with asthma (%)
Medical Conditions - People with anemia (%)
Medical Conditions - People with psoriasis (%)
Medical Conditions - People with overweight (%)
Medical Conditions - Elderly people having difficulties in thinking or remembering (%)
Medical Conditions - People who ever received blood transfusion (%)
Medical Conditions - People having trouble seeing even with glass/contacts (%)
Medical Conditions - People with arthritis (%)
Medical Conditions - People with gout (%)
Medical Conditions - People with congestive heart failure (%)
Medical Conditions - People with coronary heart disease (%)
Medical Conditions - People with angina pectoris (%)
Medical Conditions - People who ever had heart attack (%)
Medical Conditions - People who ever had stroke (%)
Medical Conditions - People with emphysema (%)
Medical Conditions - People with thyroid problem (%)
Medical Conditions - People with chronic bronchitis (%)
Medical Conditions - People with any liver condition (%)
Medical Conditions - People who ever had cancer or malignancy (%)
Mental Health - People who have little interest in doing things (%)
Mental Health - People feeling down, depressed, or hopeless (%)
Mental Health - People who have trouble sleeping or sleeping too much (%)
Mental Health - People feeling tired or having little energy (%)
Mental Health - People with poor appetite or overeating (%)
Mental Health - People feeling bad about themself (%)
Mental Health - People who have trouble concentrating on things (%)
Mental Health - People moving or speaking slowly or too fast (%)
Mental Health - People having thoughts they would be better off dead (%)
Oral Health - Average years since last visit a dentist
Oral Health - People embarrassed because of mouth (%)
Oral Health - People with gum disease (%)
Oral Health - General health of teeth and gums (%)
Oral Health - Average days a week using dental floss/device
Oral Health - Average days a week using mouthwash for dental problem
Oral Health - Average number of teeth
Pesticide Use - Households using pesticides to control insects (%)
Pesticide Use - Households using pesticides to kill weeds (%)
Physical Activity - People doing vigorous-intensity work activities (%)
Physical Activity - People doing moderate-intensity work activities (%)
Physical Activity - People walking or bicycling (%)
Physical Activity - People doing vigorous-intensity recreational activities (%)
Physical Activity - People doing moderate-intensity recreational activities (%)
Physical Activity - Average hours a day doing sedentary activities
Physical Activity - Average hours a day watching TV or videos
Physical Activity - Average hours a day using computer
Physical Functioning - People having limitations keeping them from working (%)
Physical Functioning - People limited in amount of work they can do (%)
Physical Functioning - People that need special equipment to walk (%)
Physical Functioning - People experiencing confusion/memory problems (%)
Physical Functioning - People requiring special healthcare equipment (%)
Prescription Medications - Average number of prescription medicines taking
Preventive Aspirin Use - Adults 40+ taking low-dose aspirin (%)
Reproductive Health - Vaginal deliveries (%)
Reproductive Health - Cesarean deliveries (%)
Reproductive Health - Deliveries resulted in a live birth (%)
Reproductive Health - Pregnancies resulted in a delivery (%)
Reproductive Health - Women breastfeeding newborns (%)
Reproductive Health - Women that had a hysterectomy (%)
Reproductive Health - Women that had both ovaries removed (%)
Reproductive Health - Women that have ever taken birth control pills (%)
Reproductive Health - Women taking birth control pills (%)
Reproductive Health - Women that have ever used Depo-Provera or injectables (%)
Reproductive Health - Women that have ever used female hormones (%)
Sexual Behavior - People 18+ that ever had sex (vaginal, anal, or oral) (%)
Sexual Behavior - Males 18+ that ever had vaginal sex with a woman (%)
Sexual Behavior - Males 18+ that ever performed oral sex on a woman (%)
Sexual Behavior - Males 18+ that ever had anal sex with a woman (%)
Sexual Behavior - Males 18+ that ever had any sex with a man (%)
Sexual Behavior - Females 18+ that ever had vaginal sex with a man (%)
Sexual Behavior - Females 18+ that ever performed oral sex on a man (%)
Sexual Behavior - Females 18+ that ever had anal sex with a man (%)
Sexual Behavior - Females 18+ that ever had any kind of sex with a woman (%)
Sexual Behavior - Average age people first had sex
Sexual Behavior - Average number of female sex partners in lifetime (males 18+)
Sexual Behavior - Average number of female vaginal sex partners in lifetime (males 18+)
Sexual Behavior - Average age people first performed oral sex on a woman (18+)
Sexual Behavior - Average number of woman performed oral sex on in lifetime (18+)
Sexual Behavior - Average number of male sex partners in lifetime (males 18+)
Sexual Behavior - Average number of male anal sex partners in lifetime (males 18+)
Sexual Behavior - Average age people first performed oral sex on a man (18+)
Sexual Behavior - Average number of male oral sex partners in lifetime (18+)
Sexual Behavior - People using protection when performing oral sex (%)
Sexual Behavior - Average number of times people have vaginal or anal sex a year
Sexual Behavior - People having sex without condom (%)
Sexual Behavior - Average number of male sex partners in lifetime (females 18+)
Sexual Behavior - Average number of male vaginal sex partners in lifetime (females 18+)
Sexual Behavior - Average number of female sex partners in lifetime (females 18+)
Sexual Behavior - Circumcised males 18+ (%)
Sleep Disorders - Average hours sleeping at night
Sleep Disorders - People that has trouble sleeping (%)
Smoking-Cigarette Use - People smoking cigarettes (%)
Taste & Smell - People 40+ having problems with smell (%)
Taste & Smell - People 40+ having problems with taste (%)
Taste & Smell - People 40+ that ever had wisdom teeth removed (%)
Taste & Smell - People 40+ that ever had tonsils teeth removed (%)
Taste & Smell - People 40+ that ever had a loss of consciousness because of a head injury (%)
Taste & Smell - People 40+ that ever had a broken nose or other serious injury to face or skull (%)
Taste & Smell - People 40+ that ever had two or more sinus infections (%)
Weight - Average height (inches)
Weight - Average weight (pounds)
Weight - Average BMI
Weight - People that are obese (%)
Weight - People that ever were obese (%)
Weight - People trying to lose weight (%)
100%
urban population.
Estimated median house/condo value in 2022: $58,903
44509:
$58,903Ohio:
$204,100
Median resident age: This zip code:
39.2 yearsOhio median age:
39.9 years
Average household size: This zip code:
2.1 peopleOhio:
2.4 people
Averages for the 2020 tax year for zip code 44509, filed in 2021:
Average Adjusted Gross Income (AGI) in 2020: $30,581 (Individual Income Tax Returns) Here:
$30,581State:
$67,288
Salary/wage: $27,330 (reported on 80.5% of returns )Here:
$27,330State:
$55,628
(% of AGI for various income ranges: 1059.7% for AGIs below $25k , 3257.4% for AGIs $25k-50k , 6343.7% for AGIs $50k-75k , 8195.8% for AGIs $75k-100k , 14164.3% for AGIs $100k-200k ) Taxable interest for individuals: $597 (reported on 13.2% of returns )This zip code:
$597Ohio:
$1,518
(% of AGI for various income ranges: 5.7% for AGIs below $25k , 5.9% for AGIs $25k-50k , 27.9% for AGIs $50k-75k , 56.7% for AGIs $75k-100k , 22.9% for AGIs $100k-200k ) Ordinary dividends: $1,611 (reported on 7.8% of returns )(% of AGI for various income ranges: 5.7% for AGIs below $25k , 13.1% for AGIs $25k-50k , 25.5% for AGIs $50k-75k , 47.5% for AGIs $75k-100k , 240.0% for AGIs $100k-200k ) Net capital gain/loss in AGI: +$2,672 (reported on 6.1% of returns )Here:
+$2,672State:
+$18,919
(% of AGI for various income ranges: 5.4% for AGIs $25k-50k , 62.4% for AGIs $50k-75k , 131.7% for AGIs $75k-100k , 447.1% for AGIs $100k-200k ) Profit/loss from business: +$6,238 (reported on 12.8% of returns )Here:
+$6,238State:
+$13,744
(% of AGI for various income ranges: 106.6% for AGIs below $25k , 66.9% for AGIs $25k-50k , 93.4% for AGIs $50k-75k , 405.8% for AGIs $75k-100k ) Taxable individual retirement arrangement distribution: $9,496 (reported on 5.5% of returns )(% of AGI for various income ranges: 31.8% for AGIs below $25k , 41.6% for AGIs $25k-50k , 143.4% for AGIs $50k-75k , 648.3% for AGIs $75k-100k ) Total itemized deductions: $26,125 (reported on 0.8% of returns )Here:
$26,125State:
$33,869
(% of AGI for various income ranges: 275.0% for AGIs $50k-75k ) Charity contributions: $8,633 (reported on 0.6% of returns )(% of AGI for various income ranges: 68.2% for AGIs $50k-75k ) Taxes paid: $3,775 (reported on 0.8% of returns )(% of AGI for various income ranges: 39.7% for AGIs $50k-75k ) Earned income credit: $2,707 (reported on 34.5% of returns )(% of AGI for various income ranges: 160.0% for AGIs below $25k , 99.9% for AGIs $25k-50k ) Percentage of individuals using paid preparers for their 2020 taxes: 94.5%(% for various income ranges: 94.7% for AGIs below $25k , 95.3% for AGIs $25k-50k , 92.3% for AGIs $50k-75k , 94.1% for AGIs $75k-100k , 91.7% for AGIs $100k-200k )
Averages for the 2012 tax year for zip code 44509, filed in 2013:
Average Adjusted Gross Income (AGI) in 2012: $27,494 (Individual Income Tax Returns) Here:
$27,494State:
$54,926
Salary/wage: $25,555 (reported on 83.7% of returns )Here:
$25,555State:
$45,869
(% of AGI for various income ranges: 74.2% for AGIs below $25k , 81.0% for AGIs $25k-50k , 80.6% for AGIs $50k-75k , 77.1% for AGIs $75k-100k , 70.1% for AGIs $100k-200k ) Taxable interest for individuals: $786 (reported on 19.6% of returns )This zip code:
$786Ohio:
$1,297
(% of AGI for various income ranges: 0.7% for AGIs below $25k , 0.4% for AGIs $25k-50k , 0.4% for AGIs $50k-75k , 1.0% for AGIs $75k-100k , 0.8% for AGIs $100k-200k ) Ordinary dividends: $1,513 (reported on 11.1% of returns )(% of AGI for various income ranges: 0.5% for AGIs below $25k , 0.6% for AGIs $25k-50k , 0.5% for AGIs $50k-75k , 1.1% for AGIs $75k-100k , 0.6% for AGIs $100k-200k ) Profit/loss from business: +$7,692 (reported on 12.9% of returns )Here:
+$7,692State:
+$12,773
(% of AGI for various income ranges: 9.3% for AGIs below $25k , 1.3% for AGIs $25k-50k , 1.3% for AGIs $50k-75k , 3.7% for AGIs $75k-100k ) Taxable individual retirement arrangement distribution: $6,226 (reported on 7.3% of returns )(% of AGI for various income ranges: 1.6% for AGIs below $25k , 1.5% for AGIs $25k-50k , 1.6% for AGIs $50k-75k , 3.7% for AGIs $75k-100k ) Total itemized deductions: $14,222 (24% of AGI, reported on 8.6% of returns )Here:
$14,222State:
$21,278
Here:
24.2% of AGIState:
18.8% of AGI
(% of AGI for various income ranges: 2.0% for AGIs below $25k , 4.0% for AGIs $25k-50k , 5.5% for AGIs $50k-75k , 6.2% for AGIs $75k-100k , 9.5% for AGIs $100k-200k ) Charity contributions: $2,072 (reported on 6.1% of returns )(% of AGI for various income ranges: 0.1% for AGIs below $25k , 0.4% for AGIs $25k-50k , 0.6% for AGIs $50k-75k , 1.0% for AGIs $75k-100k , 1.0% for AGIs $100k-200k ) Taxes paid: $4,534 (reported on 8.6% of returns )(% of AGI for various income ranges: 0.3% for AGIs below $25k , 1.1% for AGIs $25k-50k , 1.9% for AGIs $50k-75k , 2.4% for AGIs $75k-100k , 4.3% for AGIs $100k-200k ) Earned income credit: $2,602 (reported on 34.4% of returns )(% of AGI for various income ranges: 10.6% for AGIs below $25k , 1.0% for AGIs $25k-50k ) Percentage of individuals using paid preparers for their 2012 taxes: 51.6%(% for various income ranges: 48.4% for AGIs below $25k , 53.3% for AGIs $25k-50k , 61.7% for AGIs $50k-75k , 60.0% for AGIs $75k-100k , 62.5% for AGIs $100k-200k )
Averages for the 2004 tax year for zip code 44509, filed in 2005:
Average Adjusted Gross Income (AGI) in 2004: $25,759 (Individual Income Tax Returns) Here:
$25,759State:
$44,480
Salary/wage: $24,832 (reported on 84.3% of returns )Here:
$24,832State:
$39,198
(% of AGI for various income ranges: 78.2% for AGIs below $10k , 75.4% for AGIs $10k-25k , 83.5% for AGIs $25k-50k , 85.7% for AGIs $50k-75k , 80.8% for AGIs $75k-100k , 73.8% for AGIs over 100k ) Taxable interest for individuals: $1,348 (reported on 33.3% of returns )This zip code:
$1,348Ohio:
$1,532
(% of AGI for various income ranges: 3.2% for AGIs below $10k , 2.4% for AGIs $10k-25k , 1.5% for AGIs $25k-50k , 1.1% for AGIs $50k-75k , 1.6% for AGIs $75k-100k , 1.9% for AGIs over 100k ) Taxable dividends: $1,079 (reported on 16.7% of returns )(% of AGI for various income ranges: 1.6% for AGIs below $10k , 0.7% for AGIs $10k-25k , 0.5% for AGIs $25k-50k , 0.6% for AGIs $50k-75k , 1.1% for AGIs $75k-100k , 0.7% for AGIs over 100k ) Net capital gain/loss: +$1,181 (reported on 9.4% of returns )Here:
+$1,181State:
+$8,582
(% of AGI for various income ranges: -0.6% for AGIs below $10k , 0.3% for AGIs $10k-25k , 0.3% for AGIs $25k-50k , 0.6% for AGIs $50k-75k , 0.8% for AGIs $75k-100k , 1.6% for AGIs over 100k ) Profit/loss from business: +$4,223 (reported on 9.5% of returns )Here:
+$4,223State:
+$10,813
(% of AGI for various income ranges: 5.1% for AGIs below $10k , 2.7% for AGIs $10k-25k , 1.1% for AGIs $25k-50k , 0.8% for AGIs $50k-75k , 1.0% for AGIs $75k-100k ) IRA payment deduction: $2,148 (reported on 2.1% of returns )Total itemized deductions: $11,315 (23% of AGI, reported on 13.7% of returns )Here:
$11,315State:
$17,503
Here:
23.0% of AGIState:
20.8% of AGI
(% of AGI for various income ranges: 3.8% for AGIs below $10k , 2.9% for AGIs $10k-25k , 5.4% for AGIs $25k-50k , 8.7% for AGIs $50k-75k , 9.3% for AGIs $75k-100k , 10.9% for AGIs over 100k ) Charity contributions deductions: $1,666 (3% of AGI, reported on 11.0% of returns )Here:
3.2% of AGIState:
3.4% of AGI
(% of AGI for various income ranges: 0.2% for AGIs below $10k , 0.2% for AGIs $10k-25k , 0.7% for AGIs $25k-50k , 1.0% for AGIs $50k-75k , 1.3% for AGIs $75k-100k , 1.7% for AGIs over 100k ) Total tax: $2,778 (reported on 67.5% of returns )(% of AGI for various income ranges: 1.8% for AGIs below $10k , 3.8% for AGIs $10k-25k , 6.8% for AGIs $25k-50k , 9.6% for AGIs $50k-75k , 11.5% for AGIs $75k-100k , 15.9% for AGIs over 100k ) Earned income credit: $1,732 (reported on 25.7% of returns )Percentage of individuals using paid preparers for their 2004 taxes: 53.6%(% for various income ranges: 47.8% for AGIs below $10k , 54.5% for AGIs $10k-25k , 55.1% for AGIs $25k-50k , 58.8% for AGIs $50k-75k , 57.6% for AGIs $75k-100k , 73.2% for AGIs over 100k )
Estimated median household income in 2022: This zip code:
$33,463Ohio:
$65,720
Nearest zip codes: 44510 ,
44511 ,
44504 ,
44503 ,
44507 ,
44437 .
Youngstown Zip Code Map
Percentage of family households: This zip code:
37.9%Ohio:
43.3%
Percentage of households with unmarried partners: This zip code:
11.4%Ohio:
44.6%
Likely homosexual households (counted as self-reported same-sex unmarried-partner households)
Lesbian couples: 0.1% of all households Gay men: 0.1% of all households
Household received Food Stamps/SNAP in the past 12 months: 1,830Household did not receive Food Stamps/SNAP in the past 12 months: 3,362
Women who had a birth in the past 12 months: 58 (4 now married , 52 unmarried) Women who did not have a birth in the past 12 months: 2,579 (865 now married , 1,714 unmarried)
Housing units in zip code 44509 with a mortgage: 1,394 (125
second mortgage , 5
home equity loan , 123
both second mortgage and home equity loan )
Houses without a mortgage: 267
Median monthly owner costs for units with a mortgage: $776
Median monthly owner costs for units without a mortgage: $352
Residents with income below the poverty level in 2022:
This zip code:
32.3%Whole state:
13.4%
Residents with income below 50% of the poverty level in 2022:
This zip code:
16.3%Whole state:
7.0%
Median number of rooms in houses and condos: Median number of rooms in apartments: Notable locations in this zip code not listed on our city pages
Click to draw/clear zip code borders Notable locations in zip code 44509: (A) , Riblets Corners (B) , Pellin Ambulance Service Station 3 (C) , Westside Branch Library (D) , City of Youngstown Fire Department Station 3 (E) . Display/hide their locations on the map
Shopping Center: (1) . Display/hide its location on the map
Churches in zip code 44509 include: (A) , Corner Stone Chapel (B) , Little Wonder Fire Baptized Holiness Church of God (C) , Concordia Evangelical Lutheran Church (D) , Central Church of the Nazarene (E) , Holy Ghost Church (F) , Kingdom Hall Jehovahs Witnesses (G) , Youngstown Baptist Church (H) , West Side Baptist Church (I) . Display/hide their locations on the map
Cemeteries: (1) , Calvary Cemetery (2) , Saint Marys Cemetery (3) . Display/hide their locations on the map
Lakes: (A) , Lily Pond (B) . Display/hide their locations on the map
Creek: (A) . Display/hide its location on the map
Parks in zip code 44509 include: (1) , Schenley Park (2) , Kochis Park (3) , Boris Field (4) . Display/hide their locations on the map
Year house built (houses)
0 2020 or later0 2010 to 201954 2000 to 2009186 1990 to 1999136 1980 to 1989611 1970 to 1979494 1960 to 19691,602 1950 to 1959586 1940 to 19491,886 1939 or earlier
Zip code 44509 household income distribution in 2022 788 Less than $10,000435 $10,000 to $14,999338 $15,000 to $19,999321 $20,000 to $24,999350 $25,000 to $29,999459 $30,000 to $34,999119 $35,000 to $39,999205 $40,000 to $44,999197 $45,000 to $49,999432 $50,000 to $59,999417 $60,000 to $74,999596 $75,000 to $99,999377 $100,000 to $124,99998 $125,000 to $149,99951 $150,000 to $199,99921 $200,000 or moreEstimate of home value of owner-occupied houses/condos in 2022 in zip code 44509 49 Less than $10,000135 $10,000 to $14,999142 $15,000 to $19,999181 $20,000 to $24,99949 $25,000 to $29,999298 $30,000 to $34,99996 $35,000 to $39,999454 $40,000 to $49,999285 $50,000 to $59,999344 $60,000 to $69,999285 $70,000 to $79,999167 $80,000 to $89,99944 $90,000 to $99,999134 $100,000 to $124,99980 $125,000 to $149,99950 $150,000 to $174,99917 $175,000 to $199,99912 $200,000 to $249,99982 $250,000 to $299,99913 $500,000 to $749,999Rent paid by renters in 2022 in zip code 44509 81 Less than $10045 $100 to $14912 $150 to $199116 $200 to $24983 $250 to $29979 $300 to $34926 $350 to $399196 $400 to $44993 $450 to $499218 $500 to $549190 $550 to $599112 $600 to $64986 $650 to $699217 $700 to $74981 $750 to $79925 $800 to $89951 $900 to $99971 $1,000 to $1,249129 No cash rent
Median gross rent in 2022: $718.
Estimated median house (or condo) value in 2022 for: White Non-Hispanic householders: $58,419Black or African American householders: $53,097Some other race householders: $73,537Two or more races householders: $53,460Hispanic or Latino householders: $67,127Estimated median house or condo value in 2022: $58,903
44509:
$58,903Ohio:
$204,100
Lower value quartile - upper value quartile: $37,117 - $85,304
Mean price in 2022: Detached houses: $172,894Here:
$172,894State:
$254,366
Townhouses or other attached units: $173,222Here:
$173,222State:
$225,733
In 2-unit structures: $157,188Here:
$157,188State:
$144,384
In 3-to-4-unit structures: $133,041Here:
$133,041State:
$203,002
In 5-or-more-unit structures: $270,541Here:
$270,541State:
$211,593
Mobile homes: $39,259Here:
$39,259State:
$62,719
Housing units in structures:
One, detached: 4,700One, attached: 114Two: 3183 or 4: 825 to 9: 10610 to 19: 9820 to 49: 1450 or more: 225Mobile homes: 13Unemployment : 7.3%
Means of transportation to work in zip code 44509 65.3% 3,061 Drove a car alone14.5% 682 Carpooled5.7% 266 Bus or trolley bus0.2% 9 Taxi0.2% 9 Motorcycle0.2% 8 Bicycle1.4% 68 Walked1.2% 55 Other means10.3% 484 Worked at homeTravel time to work (commute) in zip code 44509 49 Less than 5 minutes364 5 to 9 minutes1,093 10 to 14 minutes893 15 to 19 minutes614 20 to 24 minutes221 25 to 29 minutes410 30 to 34 minutes78 35 to 39 minutes39 40 to 44 minutes138 45 to 59 minutes195 60 to 89 minutes70 90 or more minutes
Percentage of zip code residents living and working in this county: 77.4%
Household type by relationship:
Households: 11,026
Male householders: 2,198 (1,043 living alone ), Female householders: 2,964 (1,099 living alone )1,362 spouses (1,313 opposite-sex spouses ), 388 unmarried partners , (383 opposite-sex unmarried partners ), 3,043 children (2,948 natural , 24 adopted , 71 stepchildren ), 365 grandchildren , 93 brothers or sisters , 153 parents , 0 foster children , 48 other relatives , 265 non-relatives In group quarters: 161 (-1 institutionalized population )
Size of family households: 1,191 2-persons , 799 3-persons , 317 4-persons , 256 5-persons , 33 6-persons , 25 7-or-more-persons
Size of nonfamily households: 2,141 1-person , 341 2-persons , 63 3-persons
996 married couples with children. single-parent households (114 men , 1,031 women ).
92.8% of residents of 44509 zip code speak English at home. of residents speak Spanish at home (68% very well, 4% well, 28% not well ).of residents speak other Indo-European language at home (50% very well, 50% well ).of residents speak Asian or Pacific Island language at home (100% very well ).of residents speak other language at home (67% very well, 33% well ).
Foreign born population: 427 (3.9%)
(33.1%
of them are naturalized citizens )
This zip code:
3.9%Whole state:
5.0%
54% Guatemala 10% Chile 7% Uruguay 6% Grenada 6% Malaysia 5% Honduras 4% Haiti 11% African 9% American 7% Italian 7% Irish 7% German 5% Slovak 5% English
Year of entry for the foreign-born population
216 2010 or later 98 2000 to 2009 47 1990 to 1999 200 Before 1990
There are
57 Medical Specialists in Zip Code 44509 .
Facilities with environmental interests located in this zip code:
ATD CORP (460 N MERIDIAN RD in YOUNGSTOWN, OH)
STATE MASTER (Ohio general info) - RCRA-OHD987023132, HAZARDOUS WASTE PROGRAM, AIR MAJOR Conditionally Exempt Small Quantity Generators, less than 100 kg/month of hazardous waste (Resource Conservation and Recovery Act (tracking hazardous waste)) - notification TSD (Resource Conservation and Recovery Act (tracking hazardous waste)) - notification Business SIC classification: FABRICATED METAL PRODUCTSOrganizations: ATD CORPORATION (CONTACT/OWNER)
AGA GAS INC (1055 NORTH MERIDIAN ROAD in YOUNGSTOWN, OH)
STATE MASTER (Ohio general info) - EPCRA TRI REPORTER (Tracking of toxic chemicals releasing facilities) Business SIC classification: CHEMICALS AND ALLIED PRODUCTSAlternative names: AGA GASS INC.
AUSTINTOWN PRODS. PLANT (280 N. MERIDIAN RD. in YOUNGSTOWN, OH)
CRITERIA AND HAZARDOUS AIR POLLUTANT INVENTORY (Inventory of air pollution sources) Business SIC classification: ELECTRICAL MACHINERY, EQUIPMENT, AND SUPPLIES
Housing units lacking complete plumbing facilities: 4.4%
Housing units lacking complete kitchen facilities: 3.1%
86.9% Utility gas 8.6% Electricity 3.9% Bottled, tank, or LP gas 0.6% No fuel used
Population in 1990: 14,399.
Place of birth for U.S.-born residents:
This state: 8,588Northeast: 715Midwest: 276South: 766West: 110
63% of the 44509 zip code residents lived in the same house 5 years ago.
Out of people who lived in different houses, 77% lived in this county.
Out of people who lived in different counties, 50% lived in Ohio.
88% of the 44509 zip code residents lived in the same house 1 year ago.
Out of people who lived in different houses, 60% moved from this county.
Out of people who lived in different houses, 26% moved from different county within same state.
Out of people who lived in different houses, 6% moved from different state.
Out of people who lived in different houses, 5% moved from abroad.
Private vs. public school enrollment:
Students in private schools in grades 1 to 8 (elementary and middle school): 177
Students in private schools in grades 9 to 12 (high school): 58
Students in private undergraduate colleges: 73
Occupation by median earnings in the past 12 months ($)
92,064 Fire fighting and prevention, and other protective service workers including supervisors 73,277 Architecture and engineering occupations 65,690 Computer and mathematical occupations 58,278 Health diagnosing and treating practitioners and other technical occupations 48,275 Community and social service occupations 45,192 Management occupations
Companies with federal contracts located in this zip code (YOUNGSTOWN, OH):
GRACE SERVICES INC (715 NORTH MERIDIAN ROAD; small business) in 25 contracts from 2000 to 2006
Contracts for Insect and Rodent Control Services, Landscaping/Groundskeeping Services, Recreation Site Maintenance Services (non-construction), Pesticides Support Services by U.S. Army Corps of Engineers - civil program financing only, ArmySigned by year: 2000: $31,285; 2001: $0; 2002: $0; 2003: $14,500; 2004: $98,140; 2005: $106,850; 2006: -$100.
Biggest contracts: with U.S. Army Corps of Engineers - civil program financing only for Insect and Rodent Control Services. Signed on 2000-03-10. Completion date: 2000-03-31.
with Army for Landscaping/Groundskeeping Services. Taking place in WV. Signed on 2005-06-01. Completion date: 2005-04-18.
with U.S. Army Corps of Engineers - civil program financing only for Landscaping/Groundskeeping Services. Taking place in WV. Signed on 2005-06-01. Completion date: 2005-04-18.
with Army for Insect and Rodent Control Services. Taking place in WV. Signed on 2004-08-30. Completion date: 2004-08-12.
QUALITY CUSTOM MOLD INC (3207 INNOVATION PLACE; small business) in 3 contracts from 2002 to 2003
$75,638 with Army for Production Jigs, Fixtures, and Templates. Signed on 2002-07-16. Completion date: 2002-12-20.
, same as above. Signed on 2003-04-30. Completion date: 2002-12-20.
, same as above. Signed on 2003-08-22. Completion date: 2002-12-20.
PARTS ROOM SUPPLY, INC (635 NORTH MERIDIAN ROAD; small business)
$74,695 with Air Force for Hose, Pipe, Tube, Lubrication, and Railing Fittings. Signed on 2001-09-28. Completion date: 2001-09-27.
JUMP STRETCH, INC (1230 N MERIDIAN RD; small business) in 2 contracts from 2005 to 2006
$23,760 with Army for Recreational and Gymnastic Equipment. Signed on 2006-03-09. Completion date: 2006-06-08.
, same as above. Signed on 2005-12-15. Completion date: 2006-01-05.
AAAA PLUMBING SOLUTION (1089 N MERIDIAN RD)
$3,000 with Defense Logistics Agency for Maintenance, Repair and Rebuilding of Equipment -- Plumbing, Heating, and Waste Disposal Equipment. Signed on 2004-11-29. Completion date: 2004-12-30.
SENSOURCE, INC (1257 SALT SPRINGS RD; small business)
$2,508 with Army for Miscellaneous Construction Equipment. Signed on 2005-10-27. Completion date: 2005-11-04.
Top industries in this zip code by the number of employees in 2005:
Health Care and Social Assistance: Nursing Care Facilities (100-249 employees: 1 establishment, 20-49 employees: 1 establishment)Accommodation and Food Services: Limited-Service Restaurants (20-49: 2, 10-19: 3, 5-9: 1, 1-4: 6)Wholesale Trade: Motor Vehicle Supplies and New Parts Merchant Wholesalers (50-99: 1, 10-19: 1, 5-9: 1, 1-4: 1)Construction: Commercial and Institutional Building Construction (50-99: 1, 10-19: 1)Information: Wired Telecommunications Carriers (20-49: 2, 1-4: 5)Educational Services: Junior Colleges (50-99: 1, 1-4: 1)
People in group quarters in 2010:
217 people in nursing facilities/skilled-nursing facilities
10 people in group homes intended for adults
10 people in residential treatment centers for adults
8 people in emergency and transitional shelters (with sleeping facilities) for people experiencing homelessness
2 people in other noninstitutional facilities
People in group quarters in 2000:
315 people in nursing homes
20 people in other nonhousehold living situations
7 people in other group homes
5 people in religious group quarters
Fatal accident statistics in 2013:
Fatal accident count: 1Vehicles involved in fatal accidents: 2Fatal accidents caused by drunken drivers: 0Fatalities: 1Persons involved in fatal accidents: 3Pedestrians involved in fatal accidents: 0
Fatal accident statistics in 2012:
Fatal accident count: 1Vehicles involved in fatal accidents: 1Fatal accidents caused by drunken drivers: 1Fatalities: 1Persons involved in fatal accidents: 1Pedestrians involved in fatal accidents: 0
Home Mortgage Disclosure Act Aggregated Statistics For Year 2009(Based on 10 full and 6 partial tracts) A) FHA, FSA/RHS & VA B) Conventional C) Refinancings D) Home Improvement Loans F) Non-occupant Loans on G) Loans On Manufactured Number Average Value Number Average Value Number Average Value Number Average Value Number Average Value Number Average Value
LOANS ORIGINATED 64 $56,615 54 $46,883 119 $56,306 15 $12,683 31 $33,730 0 $0 APPLICATIONS APPROVED, NOT ACCEPTED 4 $68,355 2 $34,660 26 $41,803 2 $14,970 8 $30,902 2 $14,970 APPLICATIONS DENIED 11 $50,245 27 $28,363 169 $46,491 51 $19,848 19 $35,392 0 $0 APPLICATIONS WITHDRAWN 11 $54,283 10 $39,019 37 $68,267 6 $21,972 7 $24,763 0 $0 FILES CLOSED FOR INCOMPLETENESS 2 $132,470 0 $0 13 $43,265 1 $41,210 2 $27,945 0 $0
Aggregated Statistics For Year 2008(Based on 10 full and 6 partial tracts) A) FHA, FSA/RHS & VA B) Conventional C) Refinancings D) Home Improvement Loans F) Non-occupant Loans on Number Average Value Number Average Value Number Average Value Number Average Value Number Average Value
LOANS ORIGINATED 55 $56,973 82 $43,025 129 $57,511 41 $15,076 44 $33,814 APPLICATIONS APPROVED, NOT ACCEPTED 2 $49,000 13 $49,858 31 $60,401 16 $17,482 12 $40,273 APPLICATIONS DENIED 16 $64,078 31 $45,920 244 $56,570 78 $21,436 37 $39,834 APPLICATIONS WITHDRAWN 8 $61,898 11 $29,225 60 $58,364 5 $8,314 15 $33,721 FILES CLOSED FOR INCOMPLETENESS 2 $38,000 10 $45,750 15 $58,565 4 $10,495 9 $50,384
Aggregated Statistics For Year 2007(Based on 10 full and 6 partial tracts) A) FHA, FSA/RHS & VA B) Conventional C) Refinancings D) Home Improvement Loans E) Loans on Dwellings For 5+ Families F) Non-occupant Loans on G) Loans On Manufactured Number Average Value Number Average Value Number Average Value Number Average Value Number Average Value Number Average Value Number Average Value
LOANS ORIGINATED 40 $53,234 232 $54,010 214 $52,515 66 $17,349 3 $1,753,453 87 $44,653 2 $1,000 APPLICATIONS APPROVED, NOT ACCEPTED 0 $0 52 $52,234 52 $55,391 17 $29,676 0 $0 16 $49,904 0 $0 APPLICATIONS DENIED 11 $54,261 132 $54,657 440 $60,134 105 $17,056 0 $0 68 $47,339 0 $0 APPLICATIONS WITHDRAWN 5 $56,074 33 $49,452 86 $67,341 13 $17,884 0 $0 16 $39,422 0 $0 FILES CLOSED FOR INCOMPLETENESS 0 $0 0 $0 32 $60,772 0 $0 0 $0 4 $39,965 0 $0
Aggregated Statistics For Year 2006(Based on 10 full and 6 partial tracts) A) FHA, FSA/RHS & VA B) Conventional C) Refinancings D) Home Improvement Loans E) Loans on Dwellings For 5+ Families F) Non-occupant Loans on Number Average Value Number Average Value Number Average Value Number Average Value Number Average Value Number Average Value
LOANS ORIGINATED 28 $57,496 433 $50,855 374 $50,791 65 $22,775 2 $87,835 149 $35,446 APPLICATIONS APPROVED, NOT ACCEPTED 2 $118,265 63 $50,701 112 $53,525 12 $18,476 0 $0 22 $42,701 APPLICATIONS DENIED 4 $52,400 222 $54,491 458 $62,219 120 $22,364 1 $1,545,270 102 $44,058 APPLICATIONS WITHDRAWN 2 $46,900 58 $54,607 247 $63,580 16 $39,549 0 $0 14 $42,415 FILES CLOSED FOR INCOMPLETENESS 0 $0 12 $61,537 46 $72,832 4 $45,902 0 $0 4 $56,472
Aggregated Statistics For Year 2005(Based on 10 full and 6 partial tracts) A) FHA, FSA/RHS & VA B) Conventional C) Refinancings D) Home Improvement Loans E) Loans on Dwellings For 5+ Families F) Non-occupant Loans on G) Loans On Manufactured Number Average Value Number Average Value Number Average Value Number Average Value Number Average Value Number Average Value Number Average Value
LOANS ORIGINATED 39 $59,970 369 $51,307 415 $52,816 86 $23,188 1 $729,200 143 $41,179 0 $0 APPLICATIONS APPROVED, NOT ACCEPTED 3 $46,987 78 $54,333 156 $51,842 18 $26,264 0 $0 28 $50,356 0 $0 APPLICATIONS DENIED 4 $75,558 184 $48,678 514 $53,395 151 $23,994 0 $0 67 $43,073 6 $57,737 APPLICATIONS WITHDRAWN 5 $78,044 58 $52,794 216 $75,224 31 $85,800 0 $0 21 $46,373 0 $0 FILES CLOSED FOR INCOMPLETENESS 0 $0 5 $41,888 32 $66,541 7 $39,263 0 $0 2 $52,890 0 $0
Aggregated Statistics For Year 2004(Based on 10 full and 6 partial tracts) A) FHA, FSA/RHS & VA B) Conventional C) Refinancings D) Home Improvement Loans E) Loans on Dwellings For 5+ Families F) Non-occupant Loans on G) Loans On Manufactured Number Average Value Number Average Value Number Average Value Number Average Value Number Average Value Number Average Value Number Average Value
LOANS ORIGINATED 63 $54,757 442 $52,866 515 $54,136 92 $18,474 4 $67,262 165 $45,965 1 $7,590 APPLICATIONS APPROVED, NOT ACCEPTED 4 $32,475 110 $47,563 160 $51,481 13 $35,315 0 $0 31 $49,494 0 $0 APPLICATIONS DENIED 3 $70,483 93 $52,469 497 $56,858 137 $19,576 0 $0 45 $46,910 3 $31,423 APPLICATIONS WITHDRAWN 5 $62,548 76 $50,799 230 $59,917 23 $23,083 0 $0 22 $39,183 2 $74,000 FILES CLOSED FOR INCOMPLETENESS 0 $0 12 $67,697 67 $70,805 10 $22,817 0 $0 4 $57,385 0 $0
Aggregated Statistics For Year 2003(Based on 10 full and 6 partial tracts) A) FHA, FSA/RHS & VA B) Conventional C) Refinancings D) Home Improvement Loans E) Loans on Dwellings For 5+ Families F) Non-occupant Loans on Number Average Value Number Average Value Number Average Value Number Average Value Number Average Value Number Average Value
LOANS ORIGINATED 103 $54,485 238 $50,525 735 $50,206 85 $22,374 3 $662,783 140 $33,194 APPLICATIONS APPROVED, NOT ACCEPTED 6 $51,007 63 $52,221 188 $52,615 10 $12,574 0 $0 13 $37,854 APPLICATIONS DENIED 7 $57,409 98 $49,098 514 $55,233 114 $14,388 0 $0 56 $49,538 APPLICATIONS WITHDRAWN 7 $57,247 34 $46,499 233 $56,896 7 $11,377 0 $0 15 $42,146 FILES CLOSED FOR INCOMPLETENESS 2 $65,875 4 $109,022 66 $54,884 6 $44,000 0 $0 2 $42,920
Aggregated Statistics For Year 2002(Based on 10 full and 6 partial tracts) A) FHA, FSA/RHS & VA B) Conventional C) Refinancings D) Home Improvement Loans E) Loans on Dwellings For 5+ Families F) Non-occupant Loans on Number Average Value Number Average Value Number Average Value Number Average Value Number Average Value Number Average Value
LOANS ORIGINATED 79 $55,727 341 $42,540 514 $49,445 87 $16,553 1 $480,390 110 $35,046 APPLICATIONS APPROVED, NOT ACCEPTED 1 $39,380 38 $39,717 174 $55,152 14 $11,476 0 $0 10 $31,405 APPLICATIONS DENIED 2 $59,685 64 $39,827 467 $50,177 82 $11,434 0 $0 23 $33,388 APPLICATIONS WITHDRAWN 7 $57,826 28 $42,608 167 $56,558 11 $16,604 0 $0 11 $31,100 FILES CLOSED FOR INCOMPLETENESS 0 $0 23 $51,010 53 $50,496 0 $0 0 $0 0 $0
Aggregated Statistics For Year 2001(Based on 10 full and 6 partial tracts) A) FHA, FSA/RHS & VA B) Conventional C) Refinancings D) Home Improvement Loans F) Non-occupant Loans on Number Average Value Number Average Value Number Average Value Number Average Value Number Average Value
LOANS ORIGINATED 125 $54,479 306 $46,274 519 $48,295 80 $12,626 72 $38,992 APPLICATIONS APPROVED, NOT ACCEPTED 10 $40,929 34 $34,353 150 $44,010 14 $10,586 16 $42,438 APPLICATIONS DENIED 6 $45,248 91 $49,533 506 $48,767 160 $11,057 20 $40,652 APPLICATIONS WITHDRAWN 6 $57,187 23 $51,649 223 $47,381 22 $23,505 7 $30,049 FILES CLOSED FOR INCOMPLETENESS 1 $37,950 6 $39,225 43 $58,973 0 $0 1 $43,750
Aggregated Statistics For Year 2000(Based on 10 full and 6 partial tracts) A) FHA, FSA/RHS & VA B) Conventional C) Refinancings D) Home Improvement Loans F) Non-occupant Loans on Number Average Value Number Average Value Number Average Value Number Average Value Number Average Value
LOANS ORIGINATED 140 $48,296 276 $41,073 372 $40,924 111 $9,920 89 $30,538 APPLICATIONS APPROVED, NOT ACCEPTED 5 $35,646 40 $37,844 112 $42,012 50 $9,517 8 $22,726 APPLICATIONS DENIED 16 $52,870 94 $48,215 367 $44,075 159 $15,558 25 $27,516 APPLICATIONS WITHDRAWN 10 $55,230 35 $37,086 148 $43,254 33 $17,482 11 $29,581 FILES CLOSED FOR INCOMPLETENESS 0 $0 22 $46,915 19 $46,221 2 $14,970 2 $22,955
Aggregated Statistics For Year 1999(Based on 5 full and 2 partial tracts) A) FHA, FSA/RHS & VA B) Conventional C) Refinancings D) Home Improvement Loans F) Non-occupant Loans on Number Average Value Number Average Value Number Average Value Number Average Value Number Average Value
LOANS ORIGINATED 44 $48,338 136 $43,202 257 $37,687 65 $9,862 40 $34,459 APPLICATIONS APPROVED, NOT ACCEPTED 2 $45,310 30 $36,744 87 $40,933 19 $11,031 8 $27,511 APPLICATIONS DENIED 8 $44,388 38 $41,248 209 $38,712 75 $10,290 4 $30,808 APPLICATIONS WITHDRAWN 7 $50,470 19 $38,952 106 $46,315 8 $24,115 4 $34,258 FILES CLOSED FOR INCOMPLETENESS 1 $52,570 8 $33,538 29 $47,439 1 $33,060 2 $32,825
Private Mortgage Insurance Companies Aggregated Statistics For Year 2009(Based on 8 full and 4 partial tracts) A) Conventional B) Refinancings Number Average Value Number Average Value
LOANS ORIGINATED 9 $59,208 6 $72,172 APPLICATIONS APPROVED, NOT ACCEPTED 2 $38,240 0 $0 APPLICATIONS DENIED 2 $38,925 0 $0 APPLICATIONS WITHDRAWN 0 $0 0 $0 FILES CLOSED FOR INCOMPLETENESS 0 $0 0 $0
Aggregated Statistics For Year 2007(Based on 10 full and 6 partial tracts) A) Conventional B) Refinancings C) Non-occupant Loans on Number Average Value Number Average Value Number Average Value
LOANS ORIGINATED 114 $60,437 30 $64,829 20 $46,390 APPLICATIONS APPROVED, NOT ACCEPTED 21 $56,648 12 $67,985 4 $56,025 APPLICATIONS DENIED 2 $74,830 2 $56,000 2 $56,000 APPLICATIONS WITHDRAWN 2 $51,900 4 $61,378 2 $77,850 FILES CLOSED FOR INCOMPLETENESS 0 $0 0 $0 0 $0
Aggregated Statistics For Year 2006(Based on 10 full and 6 partial tracts) A) Conventional B) Refinancings C) Non-occupant Loans on Number Average Value Number Average Value Number Average Value
LOANS ORIGINATED 105 $53,582 26 $68,444 16 $34,287 APPLICATIONS APPROVED, NOT ACCEPTED 9 $61,514 8 $86,641 4 $45,590 APPLICATIONS DENIED 0 $0 0 $0 0 $0 APPLICATIONS WITHDRAWN 0 $0 4 $61,440 0 $0 FILES CLOSED FOR INCOMPLETENESS 0 $0 2 $30,935 2 $30,935
Aggregated Statistics For Year 2005(Based on 10 full and 6 partial tracts) A) Conventional B) Refinancings C) Non-occupant Loans on Number Average Value Number Average Value Number Average Value
LOANS ORIGINATED 86 $49,482 26 $65,219 16 $43,895 APPLICATIONS APPROVED, NOT ACCEPTED 12 $47,885 13 $54,975 4 $29,962 APPLICATIONS DENIED 2 $46,910 6 $59,333 2 $60,000 APPLICATIONS WITHDRAWN 0 $0 3 $61,453 0 $0 FILES CLOSED FOR INCOMPLETENESS 0 $0 5 $50,106 1 $32,530
Aggregated Statistics For Year 2004(Based on 10 full and 6 partial tracts) A) Conventional B) Refinancings C) Non-occupant Loans on Number Average Value Number Average Value Number Average Value
LOANS ORIGINATED 103 $53,687 46 $55,509 23 $39,594 APPLICATIONS APPROVED, NOT ACCEPTED 18 $62,396 34 $63,991 2 $49,895 APPLICATIONS DENIED 0 $0 0 $0 0 $0 APPLICATIONS WITHDRAWN 2 $48,470 1 $36,330 0 $0 FILES CLOSED FOR INCOMPLETENESS 0 $0 0 $0 0 $0
Aggregated Statistics For Year 2002(Based on 10 full and 6 partial tracts) A) Conventional B) Refinancings C) Non-occupant Loans on Number Average Value Number Average Value Number Average Value
LOANS ORIGINATED 110 $47,801 70 $64,732 15 $44,323 APPLICATIONS APPROVED, NOT ACCEPTED 16 $48,762 21 $60,492 2 $30,820 APPLICATIONS DENIED 4 $40,958 6 $71,633 0 $0 APPLICATIONS WITHDRAWN 0 $0 14 $57,480 0 $0 FILES CLOSED FOR INCOMPLETENESS 0 $0 6 $85,313 0 $0
Aggregated Statistics For Year 2001(Based on 10 full and 6 partial tracts) A) Conventional B) Refinancings C) Non-occupant Loans on Number Average Value Number Average Value Number Average Value
LOANS ORIGINATED 115 $48,047 48 $57,896 8 $32,417 APPLICATIONS APPROVED, NOT ACCEPTED 19 $44,202 15 $57,765 6 $42,372 APPLICATIONS DENIED 8 $41,590 2 $42,445 2 $51,790 APPLICATIONS WITHDRAWN 7 $58,849 4 $65,505 4 $45,978 FILES CLOSED FOR INCOMPLETENESS 0 $0 0 $0 0 $0
Aggregated Statistics For Year 2000(Based on 8 full and 6 partial tracts) A) Conventional B) Refinancings C) Non-occupant Loans on Number Average Value Number Average Value Number Average Value
LOANS ORIGINATED 104 $45,486 13 $52,012 8 $23,554 APPLICATIONS APPROVED, NOT ACCEPTED 15 $40,455 0 $0 0 $0 APPLICATIONS DENIED 8 $51,188 0 $0 0 $0 APPLICATIONS WITHDRAWN 0 $0 0 $0 0 $0 FILES CLOSED FOR INCOMPLETENESS 0 $0 0 $0 0 $0
Aggregated Statistics For Year 1999(Based on 5 full and 2 partial tracts) A) Conventional B) Refinancings C) Non-occupant Loans on Number Average Value Number Average Value Number Average Value
LOANS ORIGINATED 35 $47,117 12 $52,356 2 $34,245 APPLICATIONS APPROVED, NOT ACCEPTED 7 $48,374 4 $45,570 1 $23,860 APPLICATIONS DENIED 3 $49,770 1 $41,820 0 $0 APPLICATIONS WITHDRAWN 0 $0 0 $0 0 $0 FILES CLOSED FOR INCOMPLETENESS 1 $29,180 1 $44,000 0 $0
2003 - 2018 National Fire Incident Reporting System (NFIRS) incidents See full 2006 National Fire Incident Reporting System statistics for zip code 44509, Ohio
Most common first names in zip code 44509 among deceased individuals Name Count Lived (average)
Mary 438 80.3 years John 412 74.4 years Joseph 226 75.7 years Anna 191 83.2 years Helen 179 79.4 years William 140 73.6 years Michael 122 71.5 years George 120 76.9 years James 118 73.2 years Margaret 112 79.9 years
Most common last names in zip code 44509 among deceased individuals Last name Count Lived (average)
Smith 40 75.7 years Miller 31 71.1 years Jones 27 77.9 years Davis 25 80.3 years Johnson 22 74.6 years Thomas 22 75.9 years Martin 21 78.1 years Williams 20 74.7 years Evans 19 77.0 years Ragan 13 72.7 years
Businesses in zip code 44509
Name Count Name Count
Advance Auto Parts 1 MasterBrand Cabinets 2 AutoZone 1 McDonald's 1 Burger King 1 Rite Aid 1 CVS 1 Ryder Rental & Truck Leasing 1 Circle K 1 Subway 1 FedEx 1 Walgreens 1
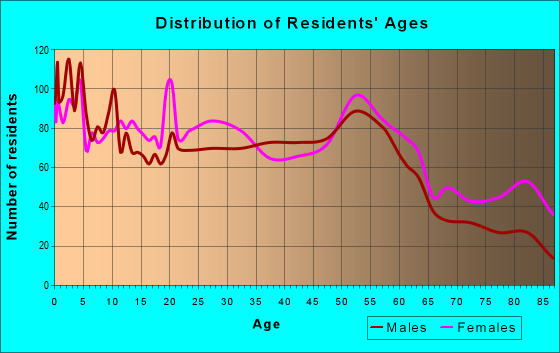
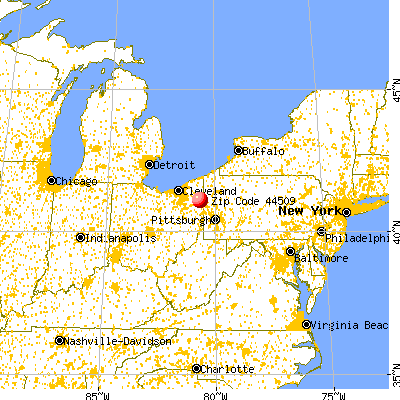

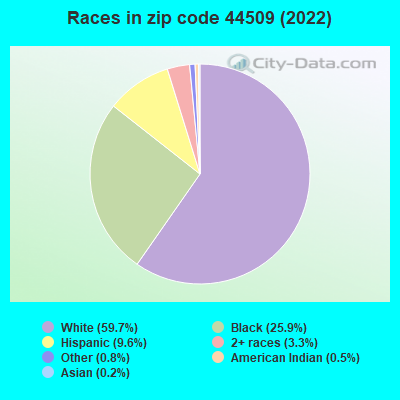


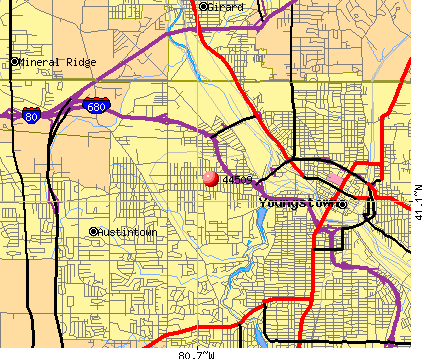 Nearest zip codes: 44510, 44511, 44504, 44503, 44507, 44437.
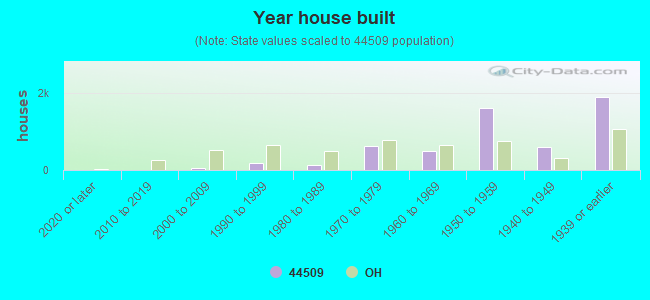
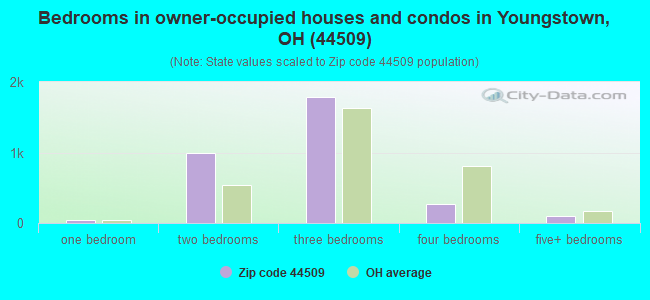
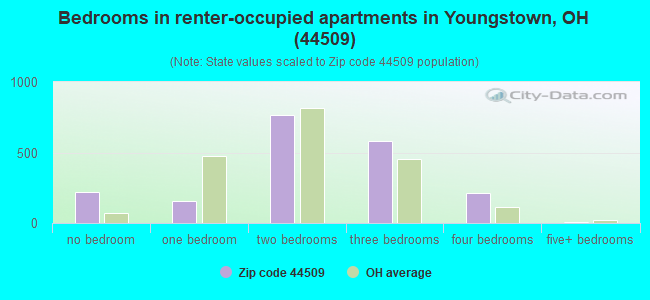
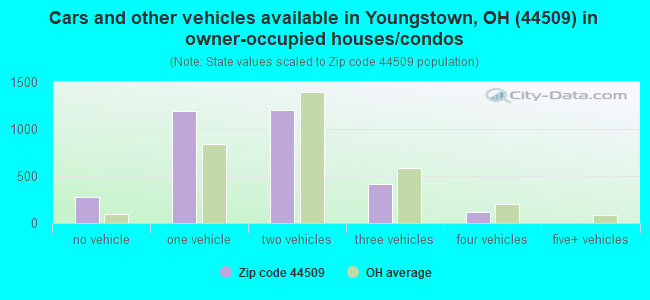
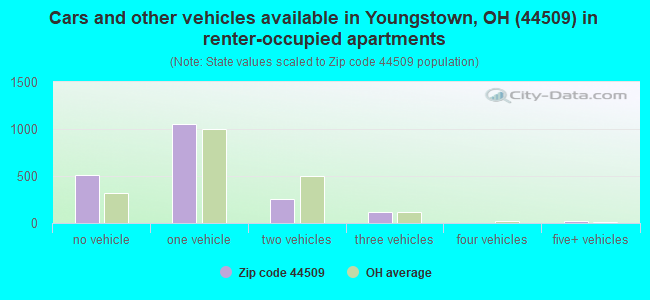


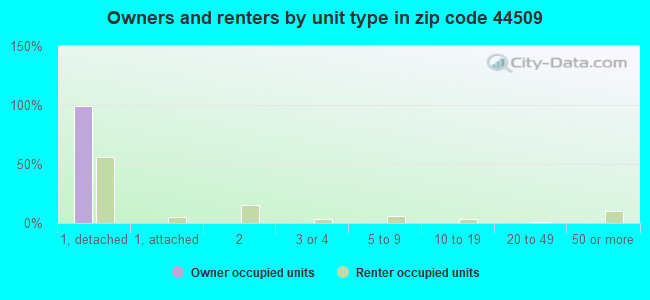
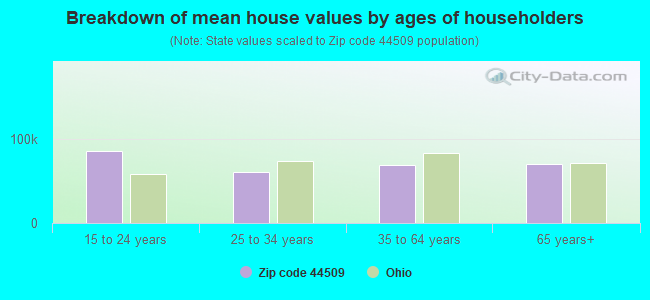


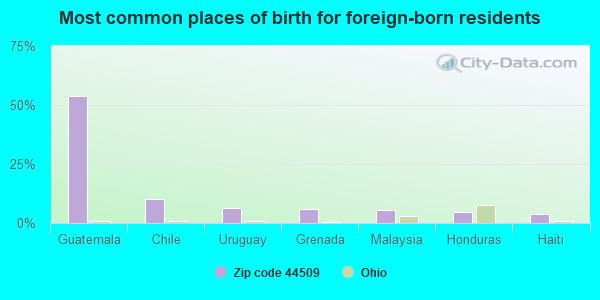
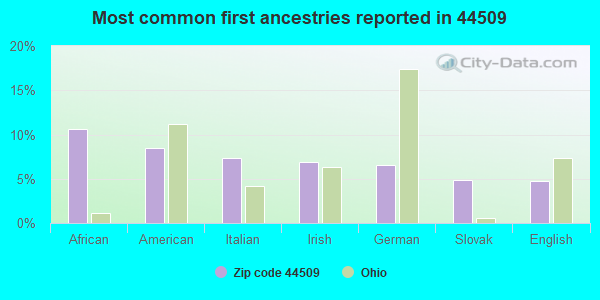
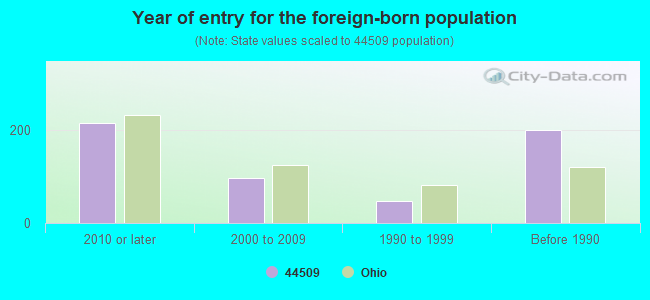


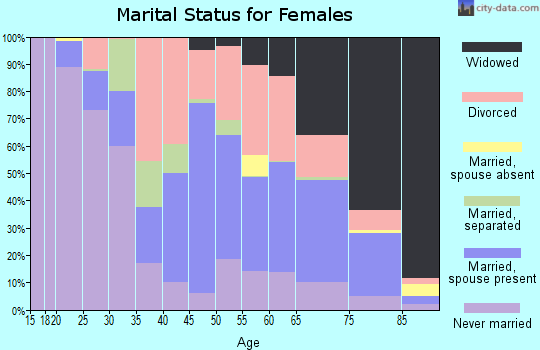
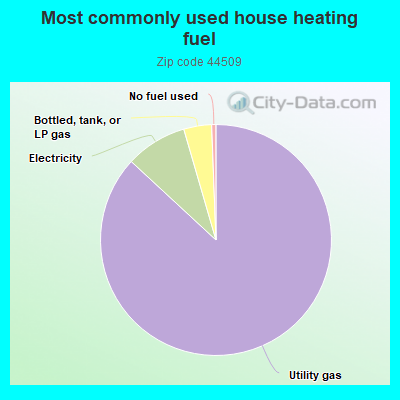
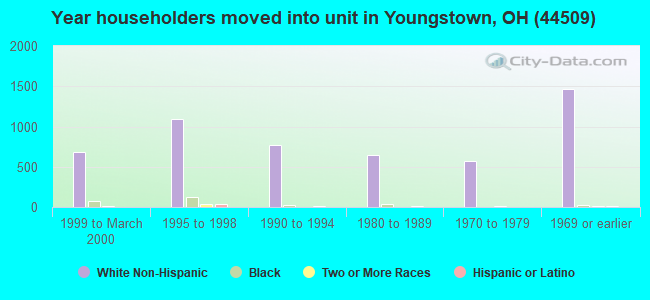
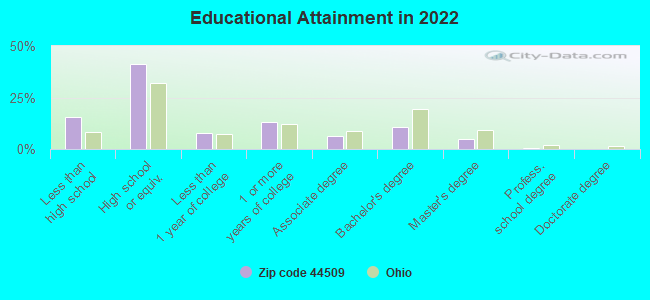
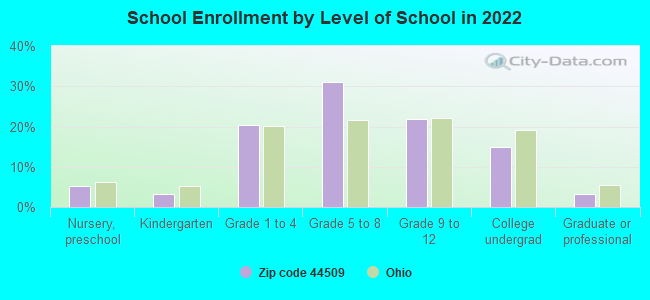
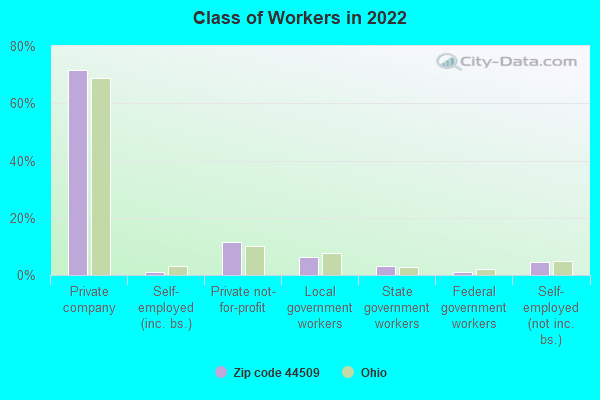
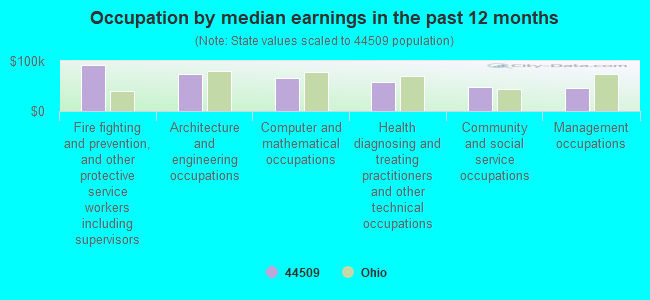
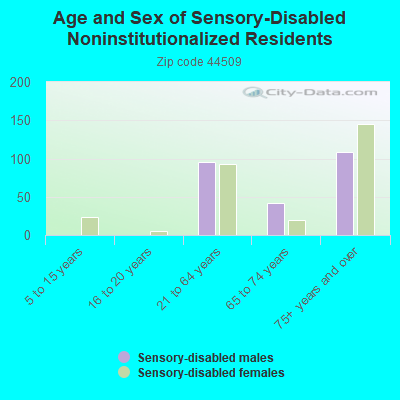
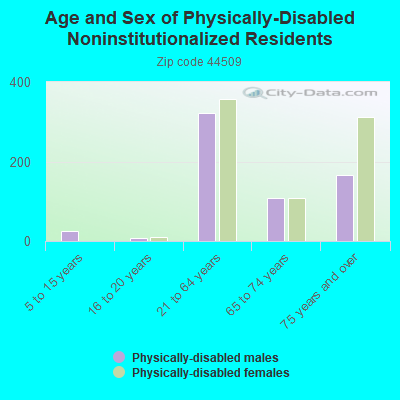
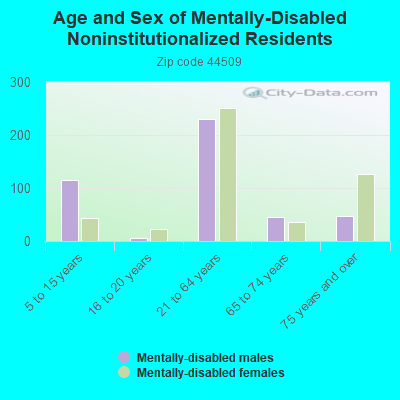
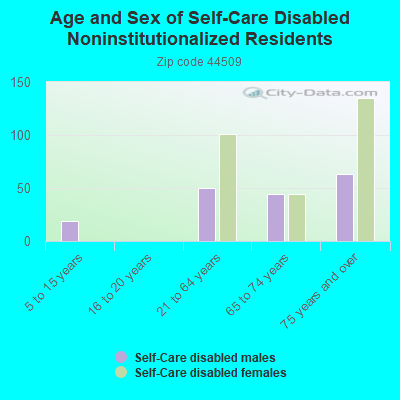
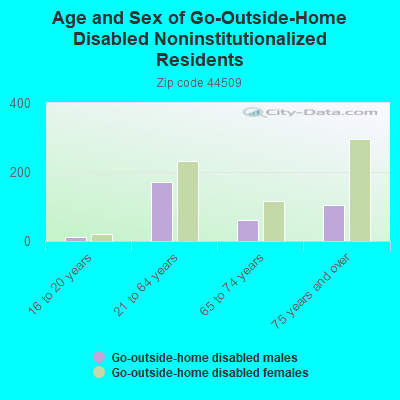
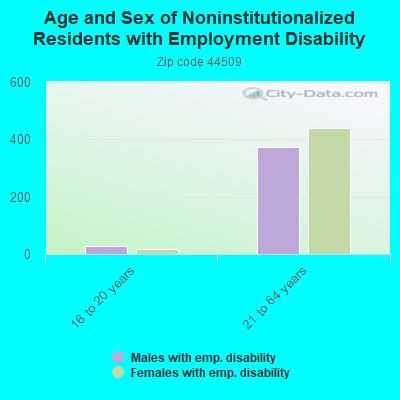
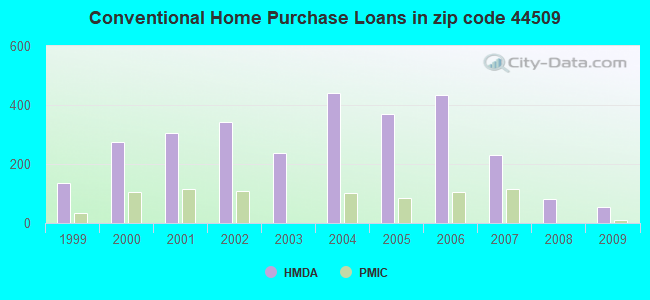
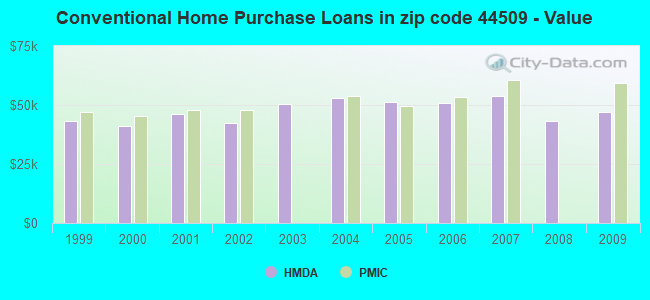
 According to the data from the years 2003 - 2018 the average number of fire incidents per year is 98. The highest number of reported fire incidents - 164 took place in 2011, and the least - 54 in 2004. The data has a rising trend.
 When looking into fire subcategories, the most reports belonged to: Structure Fires (40.9%), and Outside Fires (37.7%).