Estimated zip code population in 2022: 2,821 Zip code population in 2010: 2,465 Zip code population in 2000: 2,560
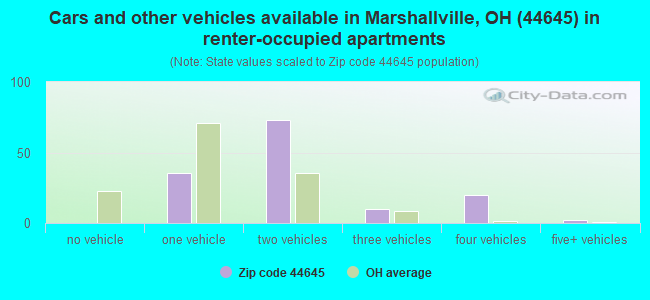
Houses and condos: 1,049 Renter-occupied apartments: 145
% of renters here:
14%
State:
33%
March 2022 cost of living index in zip code 44645: 83.9 (less than average, U.S. average is 100)
Land area: 24.8 sq. mi. Water area: 0.1 sq. mi.
Population density: 114 people per square mile
(very low).
OSM Map
General Map
Google Map
MSN Map
OSM Map
General Map
Google Map
MSN Map
OSM Map
General Map
Google Map
MSN Map
OSM Map
General Map
Google Map
MSN Map
Please wait while loading the map...
Real estate property taxes paid for housing units in 2022:
This zip code:
1.2% ($2,877)
Ohio:
1.3% ($2,639)
Median real estate property taxes paid for housing units with mortgages in 2022: $2,568 (1.1%) Median real estate property taxes paid for housing units with no mortgage in 2022: $3,546 (1.3%)
Business Search- 14 Million verified businesses
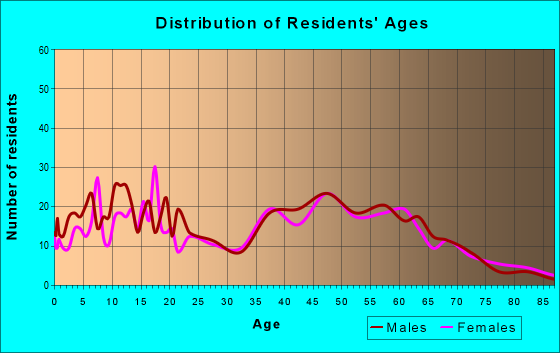
Males: 1,474
(52.3%)
Females: 1,346
(47.7%)
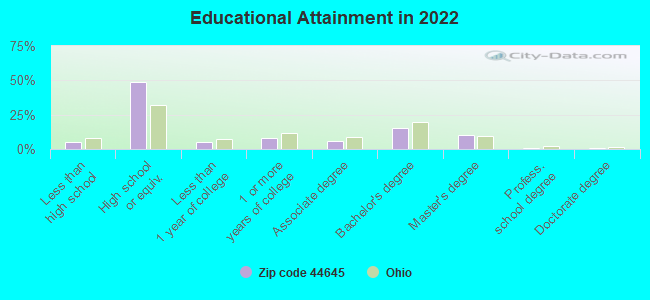
For population 25 years and over in 44645:
High school or higher: 94.3%
Bachelor's degree or higher: 26.6%
Graduate or professional degree: 11.0%
Unemployed: 3.5%
Mean travel time to work (commute): 22.3 minutes
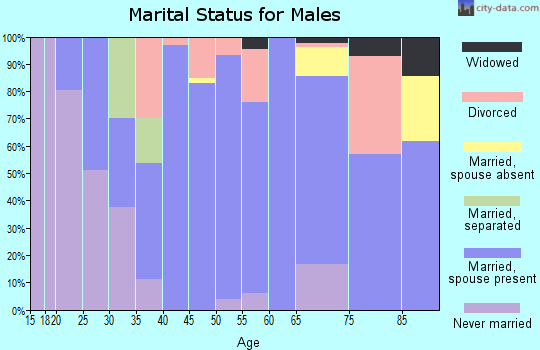
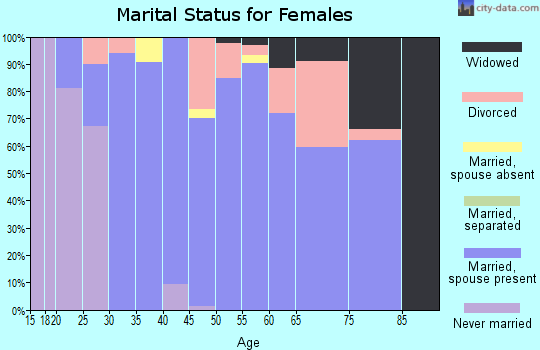
For population 15 years and over in 44645:
Never married: 25.1%
Now married: 62.2%
Separated: 0.5%
Widowed: 4.8%
Divorced: 7.3%
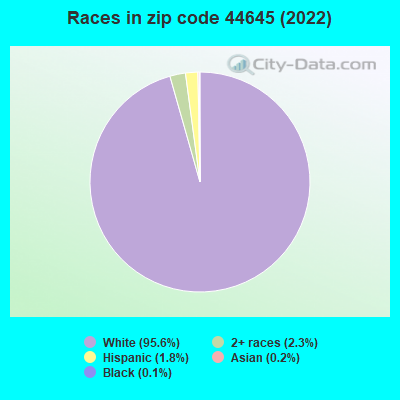
Zip code 44645 compared to state average:
Black race population percentage significantly below state average.
Hispanic race population percentage below state average.
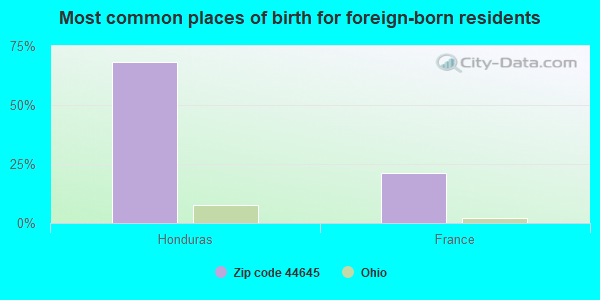
Foreign-born population percentage significantly below state average.
Renting percentage significantly below state average.
Averages for the 2020 tax year for zip code 44645, filed in 2021:
Average Adjusted Gross Income (AGI) in 2020: $67,182 (Individual Income Tax Returns)
Here:
$67,182
State:
$67,288
Salary/wage: $53,646 (reported on 84.0% of returns)
Here:
$53,646
State:
$55,628
(% of AGI for various income ranges: 1250.0% for AGIs below $25k, 3850.4% for AGIs $25k-50k, 7037.5% for AGIs $50k-75k, 10181.1% for AGIs $75k-100k, 15205.5% for AGIs $100k-200k)
Taxable interest for individuals: $743 (reported on 29.6% of returns)
This zip code:
$743
Ohio:
$1,518
(% of AGI for various income ranges: 11.6% for AGIs below $25k, 20.4% for AGIs $25k-50k, 23.8% for AGIs $50k-75k, 40.0% for AGIs $75k-100k, 50.9% for AGIs $100k-200k)
Ordinary dividends: $3,091 (reported on 17.6% of returns)
Here:
$3,091
State:
$7,167
(% of AGI for various income ranges: 18.0% for AGIs below $25k, 27.0% for AGIs $25k-50k, 36.9% for AGIs $50k-75k, 123.3% for AGIs $75k-100k, 86.4% for AGIs $100k-200k)
Net capital gain/loss in AGI: +$14,211 (reported on 15.2% of returns)
Here:
+$14,211
State:
+$18,919
(% of AGI for various income ranges: 6.8% for AGIs below $25k, 33.9% for AGIs $25k-50k, 61.3% for AGIs $50k-75k, 67.8% for AGIs $75k-100k, 397.3% for AGIs $100k-200k)
Profit/loss from business: +$11,589 (reported on 15.2% of returns)
Here:
+$11,589
State:
+$13,744
(% of AGI for various income ranges: 112.0% for AGIs below $25k, 7.4% for AGIs $25k-50k, 153.1% for AGIs $50k-75k, 426.7% for AGIs $75k-100k, 1160.0% for AGIs $100k-200k)
Taxable individual retirement arrangement distribution: $13,493 (reported on 11.2% of returns)
44645:
$13,493
Ohio:
$18,876
(% of AGI for various income ranges: 54.0% for AGIs below $25k, 87.8% for AGIs $25k-50k, 482.5% for AGIs $50k-75k, 709.1% for AGIs $100k-200k)
Total itemized deductions: $26,843 (reported on 5.6% of returns)
Here:
$26,843
State:
$33,869
(% of AGI for various income ranges: 352.5% for AGIs $50k-75k, 1195.5% for AGIs $100k-200k)
Charity contributions: $10,783 (reported on 4.8% of returns)
Here:
$10,783
State:
$14,577
(% of AGI for various income ranges: 84.3% for AGIs $25k-50k, 411.8% for AGIs $100k-200k)
Taxes paid: $7,617 (reported on 4.8% of returns)
44645:
$7,617
State:
$7,681
(% of AGI for various income ranges: 43.5% for AGIs $25k-50k, 324.5% for AGIs $100k-200k)
Earned income credit: $1,964 (reported on 11.2% of returns)
Here:
$1,964
State:
$2,304
(% of AGI for various income ranges: 64.4% for AGIs below $25k, 49.6% for AGIs $25k-50k)
Percentage of individuals using paid preparers for their 2020 taxes: 94.4%
Here:
94%
State:
94%
(% for various income ranges: 94.1% for AGIs below $25k, 96.8% for AGIs $25k-50k, 91.7% for AGIs $50k-75k, 92.9% for AGIs $75k-100k, 94.4% for AGIs $100k-200k, 100.0% for AGIs over 200k)
Averages for the 2012 tax year for zip code 44645, filed in 2013:
Average Adjusted Gross Income (AGI) in 2012: $54,186 (Individual Income Tax Returns)
Here:
$54,186
State:
$54,926
Salary/wage: $43,933 (reported on 85.5% of returns)
Here:
$43,933
State:
$45,869
(% of AGI for various income ranges: 82.1% for AGIs below $25k, 78.9% for AGIs $25k-50k, 79.7% for AGIs $50k-75k, 77.2% for AGIs $75k-100k, 51.7% for AGIs $100k-200k)
Taxable interest for individuals: $874 (reported on 31.5% of returns)
This zip code:
$874
Ohio:
$1,297
(% of AGI for various income ranges: 0.8% for AGIs below $25k, 1.1% for AGIs $25k-50k, 0.3% for AGIs $50k-75k, 0.2% for AGIs $75k-100k, 0.3% for AGIs $100k-200k)
Ordinary dividends: $2,418 (reported on 17.7% of returns)
Here:
$2,418
State:
$5,821
(% of AGI for various income ranges: 1.0% for AGIs below $25k, 0.7% for AGIs $25k-50k, 0.9% for AGIs $50k-75k, 0.2% for AGIs $75k-100k, 1.1% for AGIs $100k-200k)
Net capital gain/loss in AGI: +$6,353 (reported on 15.3% of returns)
Here:
+$6,353
State:
+$11,232
(% of AGI for various income ranges: 0.4% for AGIs below $25k, 0.4% for AGIs $25k-50k, 0.6% for AGIs $50k-75k, 4.4% for AGIs $100k-200k)
Profit/loss from business: +$8,675 (reported on 16.1% of returns)
Here:
+$8,675
State:
+$12,773
(% of AGI for various income ranges: 6.1% for AGIs below $25k, 0.1% for AGIs $25k-50k, 4.8% for AGIs $50k-75k, 3.0% for AGIs $100k-200k)
Taxable individual retirement arrangement distribution: $11,679 (reported on 11.3% of returns)
44645:
$11,679
Ohio:
$14,511
(% of AGI for various income ranges: 3.6% for AGIs below $25k, 2.9% for AGIs $25k-50k, 2.2% for AGIs $50k-75k, 7.3% for AGIs $75k-100k)
Total itemized deductions: $17,476 (17% of AGI, reported on 27.4% of returns)
Here:
$17,476
State:
$21,278
Here:
17.0% of AGI
State:
18.8% of AGI
(% of AGI for various income ranges: 4.8% for AGIs below $25k, 6.1% for AGIs $25k-50k, 9.3% for AGIs $50k-75k, 10.7% for AGIs $75k-100k, 10.1% for AGIs $100k-200k)
Charity contributions: $2,959 (reported on 21.8% of returns)
Here:
$2,959
State:
$3,943
(% of AGI for various income ranges: 1.2% for AGIs $25k-50k, 1.3% for AGIs $50k-75k, 1.2% for AGIs $75k-100k, 1.4% for AGIs $100k-200k)
Taxes paid: $7,465 (reported on 27.4% of returns)
44645:
$7,465
State:
$9,568
(% of AGI for various income ranges: 1.2% for AGIs below $25k, 1.7% for AGIs $25k-50k, 3.1% for AGIs $50k-75k, 4.1% for AGIs $75k-100k, 5.7% for AGIs $100k-200k)
Earned income credit: $1,886 (reported on 11.3% of returns)
Here:
$1,886
State:
$2,285
(% of AGI for various income ranges: 4.0% for AGIs below $25k, 0.5% for AGIs $25k-50k)
Percentage of individuals using paid preparers for their 2012 taxes: 59.7%
Here:
60%
State:
51%
(% for various income ranges: 50.0% for AGIs below $25k, 62.9% for AGIs $25k-50k, 66.7% for AGIs $50k-75k, 58.3% for AGIs $75k-100k, 69.2% for AGIs $100k-200k)
Averages for the 2004 tax year for zip code 44645, filed in 2005:
Average Adjusted Gross Income (AGI) in 2004: $43,211 (Individual Income Tax Returns)
Here:
$43,211
State:
$44,480
Salary/wage: $36,299 (reported on 86.3% of returns)
Here:
$36,299
State:
$39,198
(% of AGI for various income ranges: 89.9% for AGIs below $10k, 71.7% for AGIs $10k-25k, 85.0% for AGIs $25k-50k, 84.6% for AGIs $50k-75k, 87.0% for AGIs $75k-100k, 38.1% for AGIs over 100k)
Taxable interest for individuals: $1,295 (reported on 43.9% of returns)
This zip code:
$1,295
Ohio:
$1,532
(% of AGI for various income ranges: 4.8% for AGIs below $10k, 3.5% for AGIs $10k-25k, 1.5% for AGIs $25k-50k, 0.7% for AGIs $50k-75k, 0.4% for AGIs $75k-100k, 1.3% for AGIs over 100k)
Taxable dividends: $1,454 (reported on 22.8% of returns)
Here:
$1,454
State:
$3,496
(% of AGI for various income ranges: 1.9% for AGIs below $10k, 0.9% for AGIs $10k-25k, 0.8% for AGIs $25k-50k, 0.3% for AGIs $50k-75k, 0.7% for AGIs $75k-100k, 1.1% for AGIs over 100k)
Net capital gain/loss: +$9,856 (reported on 17.5% of returns)
Here:
+$9,856
State:
+$8,582
(% of AGI for various income ranges: 1.6% for AGIs below $10k, -0.2% for AGIs $10k-25k, 1.4% for AGIs $25k-50k, 1.4% for AGIs $50k-75k, 0.2% for AGIs $75k-100k, 13.0% for AGIs over 100k)
Profit/loss from business: +$9,856 (reported on 14.5% of returns)
Here:
+$9,856
State:
+$10,813
(% of AGI for various income ranges: 4.0% for AGIs below $10k, 3.7% for AGIs $10k-25k, 3.4% for AGIs $25k-50k, 4.2% for AGIs $50k-75k, 1.7% for AGIs $75k-100k, 3.1% for AGIs over 100k)
IRA payment deduction: $2,719 (reported on 2.7% of returns)
44645:
$2,719
Ohio:
$2,794
Total itemized deductions: $16,989 (24% of AGI, reported on 31.2% of returns)
Here:
$16,989
State:
$17,503
Here:
23.9% of AGI
State:
20.8% of AGI
(% of AGI for various income ranges: 10.5% for AGIs $10k-25k, 10.0% for AGIs $25k-50k, 12.8% for AGIs $50k-75k, 14.1% for AGIs $75k-100k, 14.5% for AGIs over 100k)
Charity contributions deductions: $3,194 (4% of AGI, reported on 22.8% of returns)
Here:
$3,194
State:
$3,087
Here:
4.1% of AGI
State:
3.4% of AGI
(% of AGI for various income ranges: 0.9% for AGIs $10k-25k, 0.7% for AGIs $25k-50k, 2.6% for AGIs $50k-75k, 2.1% for AGIs $75k-100k, 2.0% for AGIs over 100k)
Total tax: $5,308 (reported on 78.9% of returns)
44645:
$5,308
State:
$6,781
(% of AGI for various income ranges: 2.2% for AGIs below $10k, 4.5% for AGIs $10k-25k, 6.6% for AGIs $25k-50k, 8.4% for AGIs $50k-75k, 9.5% for AGIs $75k-100k, 16.6% for AGIs over 100k)
Earned income credit: $1,600 (reported on 9.2% of returns)
Here:
$1,600
State:
$1,696
Percentage of individuals using paid preparers for their 2004 taxes: 59.1%
Here:
59%
State:
55%
(% for various income ranges: 47.7% for AGIs below $10k, 59.5% for AGIs $10k-25k, 64.5% for AGIs $25k-50k, 57.7% for AGIs $50k-75k, 59.8% for AGIs $75k-100k, 75.9% for AGIs over 100k)
Likely homosexual households (counted as self-reported same-sex unmarried-partner households)
Lesbian couples: 0.2% of all households
Gay men: 0.0% of all households
Household received Food Stamps/SNAP in the past 12 months: 25 Household did not receive Food Stamps/SNAP in the past 12 months: 1,029
Women who had a birth in the past 12 months: 44 (45 now married, 0 unmarried) Women who did not have a birth in the past 12 months: 550 (263 now married, 287 unmarried)
Housing units in zip code 44645 with a mortgage: 521 (59 second mortgage, 10 home equity loan, 43 both second mortgage and home equity loan) Houses without a mortgage: 51
Median monthly owner costs for units with a mortgage: $1,379 Median monthly owner costs for units without a mortgage: $596
Residents with income below the poverty level in 2022:
This zip code:
2.6%
Whole state:
13.4%
Residents with income below 50% of the poverty level in 2022:
This zip code:
1.0%
Whole state:
7.0%
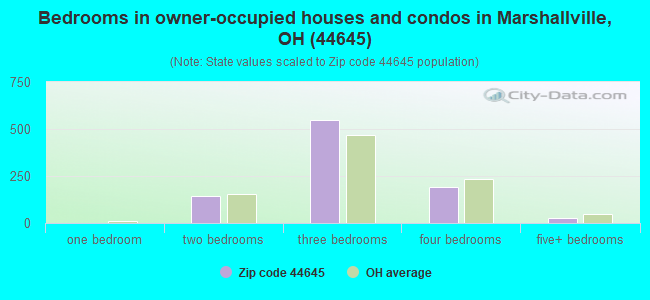
Median number of rooms in houses and condos:
Here:
7.0
State:
6.7
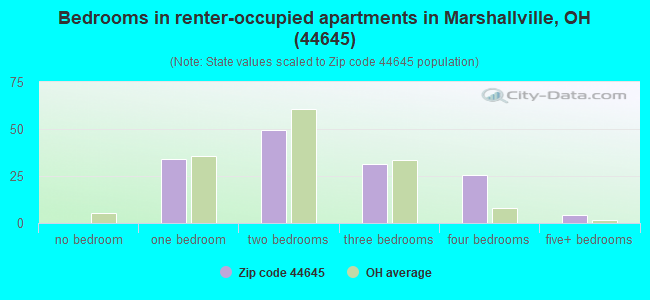
Median number of rooms in apartments:
Here:
5.0
State:
4.4
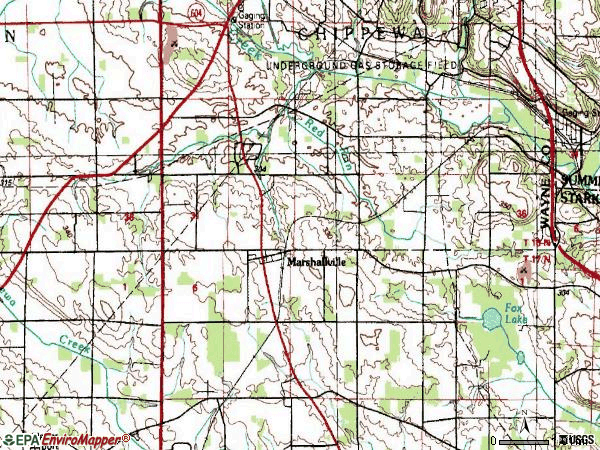
Notable locations in this zip code not listed on our city pages
Notable locations in zip code 44645: L and R Dairy Farm (A), Catalpadale Dairy (B), Zollinger Construction and Debris Landfill (C), Marshallville Volunteer Fire Department (D). Display/hide their locations on the map
Cemeteries: Conrad Cemetery (1), Truth Cemetery (2), Marshallville Cemetery (3), Lower Church Cemetery (4), Maple Grove Cemetery (5). Display/hide their locations on the map
Size of family households: 425 2-persons, 89 3-persons, 178 4-persons, 36 5-persons, 34 6-persons, 39 7-or-more-persons
Size of nonfamily households: 202 1-person, 47 2-persons
571 married couples with children.
45 single-parent households (21 men, 24 women).
99.3% of residents of 44645 zip code speak English at home.
0.2% of residents speak Spanish at home (100% very well).
0.2% of residents speak other Indo-European language at home (100% very well).
Foreign born population: 19 (0.7%) (21.4% of them are naturalized citizens)
This zip code:
0.7%
Whole state:
5.0%
68%Honduras
21%France
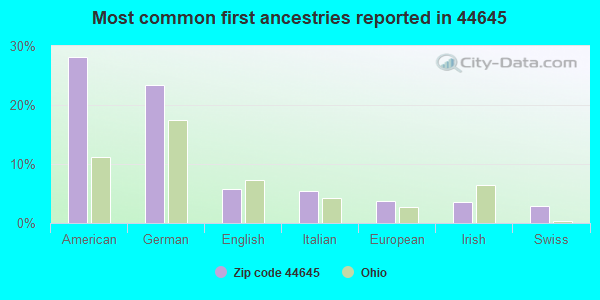
28%American
23%German
6%English
5%Italian
4%European
4%Irish
3%Swiss
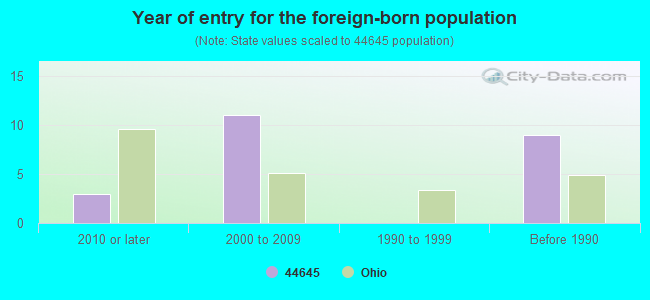
Year of entry for the foreign-born population
32010 or later
112000 to 2009
01990 to 1999
9Before 1990
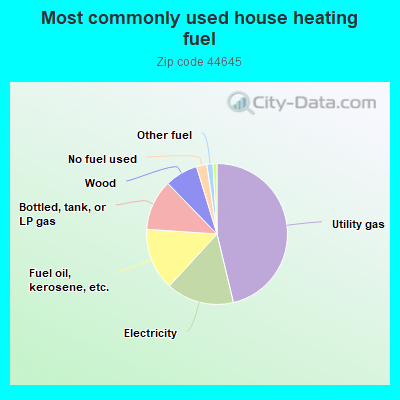
46.4%Utility gas
15.6%Electricity
14.3%Fuel oil, kerosene, etc.
11.7%Bottled, tank, or LP gas
7.6%Wood
2.4%No fuel used
1.4%Other fuel
0.9%Coal or coke
Population in 1990: 1,838. Population change in the 1990s: +722 (+39.3%).
Place of birth for U.S.-born residents:
This state: 2,437
Northeast: 79
Midwest: 48
South: 203
West: 22
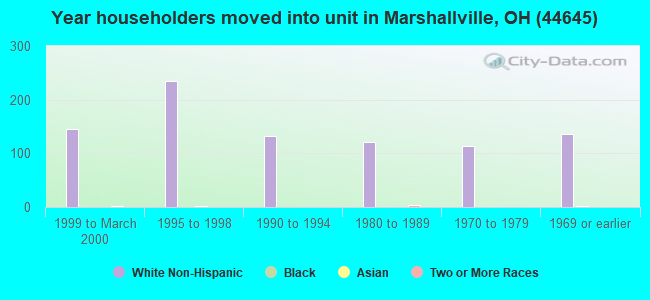
60% of the 44645 zip code residents lived in the same house 5 years ago. Out of people who lived in different houses, 55% lived in this county. Out of people who lived in different counties, 50% lived in Ohio.
93% of the 44645 zip code residents lived in the same house 1 year ago. Out of people who lived in different houses, 62% moved from this county. Out of people who lived in different houses, 17% moved from different county within same state. Out of people who lived in different houses, 20% moved from different state. Out of people who lived in different houses, 2% moved from abroad.
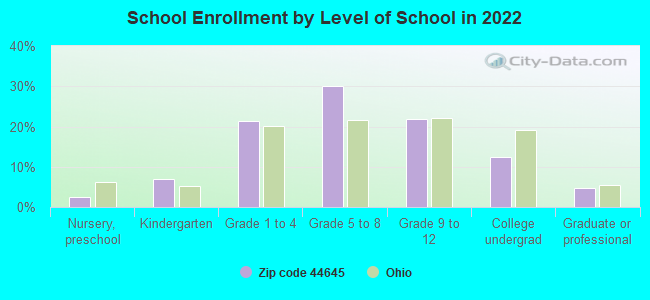
Private vs. public school enrollment:
Students in private schools in grades 1 to 8 (elementary and middle school): 32
Here:
11.2%
Ohio:
16.0%
Students in private schools in grades 9 to 12 (high school):
Here:
0.0%
Ohio:
13.1%
Students in private undergraduate colleges: 43
Here:
63.1%
Ohio:
22.3%
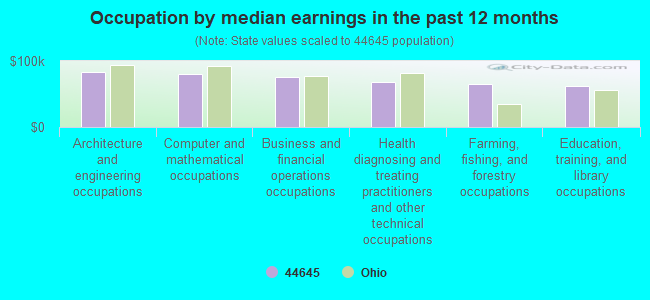
Occupation by median earnings in the past 12 months ($)
84,054Architecture and engineering occupations
80,944Computer and mathematical occupations
75,370Business and financial operations occupations
68,475Health diagnosing and treating practitioners and other technical occupations
64,760Farming, fishing, and forestry occupations
62,672Education, training, and library occupations
Top industries in this zip code by the number of employees in 2005:
Construction: Poured Concrete Foundation and Structure Contractors (10-19 employees: 1 establishment)
Mining: Construction Sand and Gravel Mining (10-19: 1)
Construction: Framing Contractors (10-19: 1)
Mining: Drilling Oil and Gas Wells (10-19: 1)
Accommodation and Food Services: Full-Service Restaurants (5-9: 1, 1-4: 2)
2002 - 2018 National Fire Incident Reporting System (NFIRS) incidents
Based on the data from the years 2002 - 2018 the average number of fire incidents per year is 11. The highest number of fires - 30 took place in 2012, and the least - 3 in 2017. The data has an increasing trend.
When looking into fire subcategories, the most incidents belonged to: Structure Fires (44.1%), and Outside Fires (44.1%).
Fire incident types reported to NFIRS in Zip Code 44645
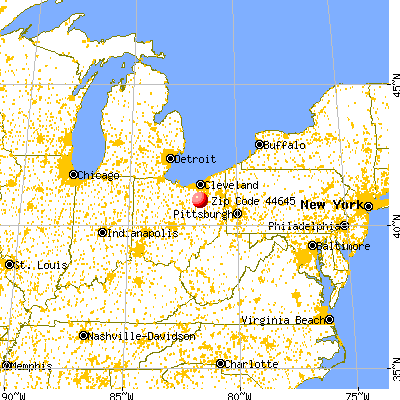


 Nearest zip codes: 44230, 44270, 44667, 44666, 44276, 44216.
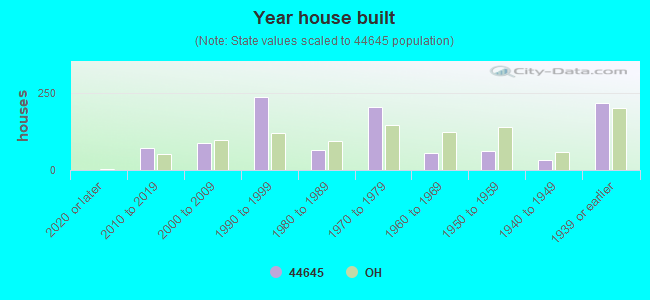


 Based on the data from the years 2002 - 2018 the average number of fire incidents per year is 11. The highest number of fires - 30 took place in 2012, and the least - 3 in 2017. The data has an increasing trend.
 When looking into fire subcategories, the most incidents belonged to: Structure Fires (44.1%), and Outside Fires (44.1%).