Estimated zip code population in 2022: 18,313
Zip code population in 2010: 18,905
Zip code population in 2000: 19,097
Houses and condos: 9,270
Renter-occupied apartments: 3,860
% of renters here:
44%State:
33%
March 2022 cost of living index in zip code 44709: 90.1
(less than average, U.S. average is 100)
Land area: 5.8
sq. mi.
Water area: 0.0
sq. mi.
Population density: 3,182 people per square mile (average).
OSM Map
General Map
Google Map
MSN Map
OSM Map
General Map
Google Map
MSN Map
OSM Map
General Map
Google Map
MSN Map
OSM Map
General Map
Google Map
MSN Map
Please wait while loading the map...
Real estate property taxes paid for housing units in 2022:
This zip code:
1.2% ($1,868)Ohio:
1.3% ($2,639)
Median real estate property taxes paid for housing units with mortgages in 2022: $1,834 (1.1%)
Median real estate property taxes paid for housing units with no mortgage in 2022: $1,996 (1.3%)
Profiles of local businesses
Business Search - 14 Million verified businesses
Males: 8,732 Females: 9,581
For population 25 years and over in 44709:
High school or higher: 93.2%Bachelor's degree or higher: 28.3%Graduate or professional degree: 12.3%Unemployed: 3.8%Mean travel time to work (commute): 18.2 minutes
For population 15 years and over in 44709:
Never married: 37.3%Now married: 40.7%Separated: 1.0%Widowed: 6.6%Divorced: 14.4%
Zip code 44709 compared to state average:
Length of stay since moving in significantly above state average. 14,194 77.5% White 1,915 10.5% Black 1,031 5.6% Hispanic or Latino 849 4.6% Two or more races 264 1.4% Asian 47 0.3% Some other race 9 0.05% American Indian
Data:
Median household income ($)
Median household income (% change since 2000)
Household income diversity
Ratio of average income to average house value (%)
Ratio of average income to average rent
Median household income ($) - White
Median household income ($) - Black or African American
Median household income ($) - Asian
Median household income ($) - Hispanic or Latino
Median household income ($) - American Indian and Alaska Native
Median household income ($) - Multirace
Median household income ($) - Other Race
Median household income for houses/condos with a mortgage ($)
Median household income for apartments without a mortgage ($)
Races - White alone (%)
Races - White alone (% change since 2000)
Races - Black alone (%)
Races - Black alone (% change since 2000)
Races - American Indian alone (%)
Races - American Indian alone (% change since 2000)
Races - Asian alone (%)
Races - Asian alone (% change since 2000)
Races - Hispanic (%)
Races - Hispanic (% change since 2000)
Races - Native Hawaiian and Other Pacific Islander alone (%)
Races - Native Hawaiian and Other Pacific Islander alone (% change since 2000)
Races - Two or more races (%)
Races - Two or more races (% change since 2000)
Races - Other race alone (%)
Races - Other race alone (% change since 2000)
Racial diversity
Unemployment (%)
Unemployment (% change since 2000)
Unemployment (%) - White
Unemployment (%) - Black or African American
Unemployment (%) - Asian
Unemployment (%) - Hispanic or Latino
Unemployment (%) - American Indian and Alaska Native
Unemployment (%) - Multirace
Unemployment (%) - Other Race
Population density (people per square mile)
Population - Males (%)
Population - Females (%)
Population - Males (%) - White
Population - Males (%) - Black or African American
Population - Males (%) - Asian
Population - Males (%) - Hispanic or Latino
Population - Males (%) - American Indian and Alaska Native
Population - Males (%) - Multirace
Population - Males (%) - Other Race
Population - Females (%) - White
Population - Females (%) - Black or African American
Population - Females (%) - Asian
Population - Females (%) - Hispanic or Latino
Population - Females (%) - American Indian and Alaska Native
Population - Females (%) - Multirace
Population - Females (%) - Other Race
Coronavirus confirmed cases (Apr 27, 2024)
Deaths caused by coronavirus (Apr 27, 2024)
Coronavirus confirmed cases (per 100k population) (Apr 27, 2024)
Deaths caused by coronavirus (per 100k population) (Apr 27, 2024)
Daily increase in number of cases (Apr 27, 2024)
Weekly increase in number of cases (Apr 27, 2024)
Cases doubled (in days) (Apr 27, 2024)
Hospitalized patients (Apr 18, 2022)
Negative test results (Apr 18, 2022)
Total test results (Apr 18, 2022)
COVID Vaccine doses distributed (per 100k population) (Sep 19, 2023)
COVID Vaccine doses administered (per 100k population) (Sep 19, 2023)
COVID Vaccine doses distributed (Sep 19, 2023)
COVID Vaccine doses administered (Sep 19, 2023)
Likely homosexual households (%)
Likely homosexual households (% change since 2000)
Likely homosexual households - Lesbian couples (%)
Likely homosexual households - Lesbian couples (% change since 2000)
Likely homosexual households - Gay men (%)
Likely homosexual households - Gay men (% change since 2000)
Cost of living index
Median gross rent ($)
Median contract rent ($)
Median monthly housing costs ($)
Median house or condo value ($)
Median house or condo value ($ change since 2000)
Mean house or condo value by units in structure - 1, detached ($)
Mean house or condo value by units in structure - 1, attached ($)
Mean house or condo value by units in structure - 2 ($)
Mean house or condo value by units in structure by units in structure - 3 or 4 ($)
Mean house or condo value by units in structure - 5 or more ($)
Mean house or condo value by units in structure - Boat, RV, van, etc. ($)
Mean house or condo value by units in structure - Mobile home ($)
Median house or condo value ($) - White
Median house or condo value ($) - Black or African American
Median house or condo value ($) - Asian
Median house or condo value ($) - Hispanic or Latino
Median house or condo value ($) - American Indian and Alaska Native
Median house or condo value ($) - Multirace
Median house or condo value ($) - Other Race
Median resident age
Resident age diversity
Median resident age - Males
Median resident age - Females
Median resident age - White
Median resident age - Black or African American
Median resident age - Asian
Median resident age - Hispanic or Latino
Median resident age - American Indian and Alaska Native
Median resident age - Multirace
Median resident age - Other Race
Median resident age - Males - White
Median resident age - Males - Black or African American
Median resident age - Males - Asian
Median resident age - Males - Hispanic or Latino
Median resident age - Males - American Indian and Alaska Native
Median resident age - Males - Multirace
Median resident age - Males - Other Race
Median resident age - Females - White
Median resident age - Females - Black or African American
Median resident age - Females - Asian
Median resident age - Females - Hispanic or Latino
Median resident age - Females - American Indian and Alaska Native
Median resident age - Females - Multirace
Median resident age - Females - Other Race
Commute - mean travel time to work (minutes)
Travel time to work - Less than 5 minutes (%)
Travel time to work - Less than 5 minutes (% change since 2000)
Travel time to work - 5 to 9 minutes (%)
Travel time to work - 5 to 9 minutes (% change since 2000)
Travel time to work - 10 to 19 minutes (%)
Travel time to work - 10 to 19 minutes (% change since 2000)
Travel time to work - 20 to 29 minutes (%)
Travel time to work - 20 to 29 minutes (% change since 2000)
Travel time to work - 30 to 39 minutes (%)
Travel time to work - 30 to 39 minutes (% change since 2000)
Travel time to work - 40 to 59 minutes (%)
Travel time to work - 40 to 59 minutes (% change since 2000)
Travel time to work - 60 to 89 minutes (%)
Travel time to work - 60 to 89 minutes (% change since 2000)
Travel time to work - 90 or more minutes (%)
Travel time to work - 90 or more minutes (% change since 2000)
Marital status - Never married (%)
Marital status - Now married (%)
Marital status - Separated (%)
Marital status - Widowed (%)
Marital status - Divorced (%)
Median family income ($)
Median family income (% change since 2000)
Median non-family income ($)
Median non-family income (% change since 2000)
Median per capita income ($)
Median per capita income (% change since 2000)
Median family income ($) - White
Median family income ($) - Black or African American
Median family income ($) - Asian
Median family income ($) - Hispanic or Latino
Median family income ($) - American Indian and Alaska Native
Median family income ($) - Multirace
Median family income ($) - Other Race
Median year house/condo built
Median year apartment built
Year house built - Built 2005 or later (%)
Year house built - Built 2000 to 2004 (%)
Year house built - Built 1990 to 1999 (%)
Year house built - Built 1980 to 1989 (%)
Year house built - Built 1970 to 1979 (%)
Year house built - Built 1960 to 1969 (%)
Year house built - Built 1950 to 1959 (%)
Year house built - Built 1940 to 1949 (%)
Year house built - Built 1939 or earlier (%)
Average household size
Household density (households per square mile)
Average household size - White
Average household size - Black or African American
Average household size - Asian
Average household size - Hispanic or Latino
Average household size - American Indian and Alaska Native
Average household size - Multirace
Average household size - Other Race
Occupied housing units (%)
Vacant housing units (%)
Owner occupied housing units (%)
Renter occupied housing units (%)
Vacancy status - For rent (%)
Vacancy status - For sale only (%)
Vacancy status - Rented or sold, not occupied (%)
Vacancy status - For seasonal, recreational, or occasional use (%)
Vacancy status - For migrant workers (%)
Vacancy status - Other vacant (%)
Residents with income below the poverty level (%)
Residents with income below 50% of the poverty level (%)
Children below poverty level (%)
Poor families by family type - Married-couple family (%)
Poor families by family type - Male, no wife present (%)
Poor families by family type - Female, no husband present (%)
Poverty status for native-born residents (%)
Poverty status for foreign-born residents (%)
Poverty among high school graduates not in families (%)
Poverty among people who did not graduate high school not in families (%)
Residents with income below the poverty level (%) - White
Residents with income below the poverty level (%) - Black or African American
Residents with income below the poverty level (%) - Asian
Residents with income below the poverty level (%) - Hispanic or Latino
Residents with income below the poverty level (%) - American Indian and Alaska Native
Residents with income below the poverty level (%) - Multirace
Residents with income below the poverty level (%) - Other Race
Air pollution - Air Quality Index (AQI)
Air pollution - CO
Air pollution - NO2
Air pollution - SO2
Air pollution - Ozone
Air pollution - PM10
Air pollution - PM25
Air pollution - Pb
Crime - Murders per 100,000 population
Crime - Rapes per 100,000 population
Crime - Robberies per 100,000 population
Crime - Assaults per 100,000 population
Crime - Burglaries per 100,000 population
Crime - Thefts per 100,000 population
Crime - Auto thefts per 100,000 population
Crime - Arson per 100,000 population
Crime - City-data.com crime index
Crime - Violent crime index
Crime - Property crime index
Crime - Murders per 100,000 population (5 year average)
Crime - Rapes per 100,000 population (5 year average)
Crime - Robberies per 100,000 population (5 year average)
Crime - Assaults per 100,000 population (5 year average)
Crime - Burglaries per 100,000 population (5 year average)
Crime - Thefts per 100,000 population (5 year average)
Crime - Auto thefts per 100,000 population (5 year average)
Crime - Arson per 100,000 population (5 year average)
Crime - City-data.com crime index (5 year average)
Crime - Violent crime index (5 year average)
Crime - Property crime index (5 year average)
1996 Presidential Elections Results (%) - Democratic Party (Clinton)
1996 Presidential Elections Results (%) - Republican Party (Dole)
1996 Presidential Elections Results (%) - Other
2000 Presidential Elections Results (%) - Democratic Party (Gore)
2000 Presidential Elections Results (%) - Republican Party (Bush)
2000 Presidential Elections Results (%) - Other
2004 Presidential Elections Results (%) - Democratic Party (Kerry)
2004 Presidential Elections Results (%) - Republican Party (Bush)
2004 Presidential Elections Results (%) - Other
2008 Presidential Elections Results (%) - Democratic Party (Obama)
2008 Presidential Elections Results (%) - Republican Party (McCain)
2008 Presidential Elections Results (%) - Other
2012 Presidential Elections Results (%) - Democratic Party (Obama)
2012 Presidential Elections Results (%) - Republican Party (Romney)
2012 Presidential Elections Results (%) - Other
2016 Presidential Elections Results (%) - Democratic Party (Clinton)
2016 Presidential Elections Results (%) - Republican Party (Trump)
2016 Presidential Elections Results (%) - Other
2020 Presidential Elections Results (%) - Democratic Party (Biden)
2020 Presidential Elections Results (%) - Republican Party (Trump)
2020 Presidential Elections Results (%) - Other
Ancestries Reported - Arab (%)
Ancestries Reported - Czech (%)
Ancestries Reported - Danish (%)
Ancestries Reported - Dutch (%)
Ancestries Reported - English (%)
Ancestries Reported - French (%)
Ancestries Reported - French Canadian (%)
Ancestries Reported - German (%)
Ancestries Reported - Greek (%)
Ancestries Reported - Hungarian (%)
Ancestries Reported - Irish (%)
Ancestries Reported - Italian (%)
Ancestries Reported - Lithuanian (%)
Ancestries Reported - Norwegian (%)
Ancestries Reported - Polish (%)
Ancestries Reported - Portuguese (%)
Ancestries Reported - Russian (%)
Ancestries Reported - Scotch-Irish (%)
Ancestries Reported - Scottish (%)
Ancestries Reported - Slovak (%)
Ancestries Reported - Subsaharan African (%)
Ancestries Reported - Swedish (%)
Ancestries Reported - Swiss (%)
Ancestries Reported - Ukrainian (%)
Ancestries Reported - United States (%)
Ancestries Reported - Welsh (%)
Ancestries Reported - West Indian (%)
Ancestries Reported - Other (%)
Educational Attainment - No schooling completed (%)
Educational Attainment - Less than high school (%)
Educational Attainment - High school or equivalent (%)
Educational Attainment - Less than 1 year of college (%)
Educational Attainment - 1 or more years of college (%)
Educational Attainment - Associate degree (%)
Educational Attainment - Bachelor's degree (%)
Educational Attainment - Master's degree (%)
Educational Attainment - Professional school degree (%)
Educational Attainment - Doctorate degree (%)
School Enrollment - Nursery, preschool (%)
School Enrollment - Kindergarten (%)
School Enrollment - Grade 1 to 4 (%)
School Enrollment - Grade 5 to 8 (%)
School Enrollment - Grade 9 to 12 (%)
School Enrollment - College undergrad (%)
School Enrollment - Graduate or professional (%)
School Enrollment - Not enrolled in school (%)
School enrollment - Public schools (%)
School enrollment - Private schools (%)
School enrollment - Not enrolled (%)
Median number of rooms in houses and condos
Median number of rooms in apartments
Housing units lacking complete plumbing facilities (%)
Housing units lacking complete kitchen facilities (%)
Density of houses
Urban houses (%)
Rural houses (%)
Households with people 60 years and over (%)
Households with people 65 years and over (%)
Households with people 75 years and over (%)
Households with one or more nonrelatives (%)
Households with no nonrelatives (%)
Population in households (%)
Family households (%)
Nonfamily households (%)
Population in families (%)
Family households with own children (%)
Median number of bedrooms in owner occupied houses
Mean number of bedrooms in owner occupied houses
Median number of bedrooms in renter occupied houses
Mean number of bedrooms in renter occupied houses
Median number of vehichles in owner occupied houses
Mean number of vehichles in owner occupied houses
Median number of vehichles in renter occupied houses
Mean number of vehichles in renter occupied houses
Mortgage status - with mortgage (%)
Mortgage status - with second mortgage (%)
Mortgage status - with home equity loan (%)
Mortgage status - with both second mortgage and home equity loan (%)
Mortgage status - without a mortgage (%)
Average family size
Average family size - White
Average family size - Black or African American
Average family size - Asian
Average family size - Hispanic or Latino
Average family size - American Indian and Alaska Native
Average family size - Multirace
Average family size - Other Race
Geographical mobility - Same house 1 year ago (%)
Geographical mobility - Moved within same county (%)
Geographical mobility - Moved from different county within same state (%)
Geographical mobility - Moved from different state (%)
Geographical mobility - Moved from abroad (%)
Place of birth - Born in state of residence (%)
Place of birth - Born in other state (%)
Place of birth - Native, outside of US (%)
Place of birth - Foreign born (%)
Housing units in structures - 1, detached (%)
Housing units in structures - 1, attached (%)
Housing units in structures - 2 (%)
Housing units in structures - 3 or 4 (%)
Housing units in structures - 5 to 9 (%)
Housing units in structures - 10 to 19 (%)
Housing units in structures - 20 to 49 (%)
Housing units in structures - 50 or more (%)
Housing units in structures - Mobile home (%)
Housing units in structures - Boat, RV, van, etc. (%)
House/condo owner moved in on average (years ago)
Renter moved in on average (years ago)
Year householder moved into unit - Moved in 1999 to March 2000 (%)
Year householder moved into unit - Moved in 1995 to 1998 (%)
Year householder moved into unit - Moved in 1990 to 1994 (%)
Year householder moved into unit - Moved in 1980 to 1989 (%)
Year householder moved into unit - Moved in 1970 to 1979 (%)
Year householder moved into unit - Moved in 1969 or earlier (%)
Means of transportation to work - Drove car alone (%)
Means of transportation to work - Carpooled (%)
Means of transportation to work - Public transportation (%)
Means of transportation to work - Bus or trolley bus (%)
Means of transportation to work - Streetcar or trolley car (%)
Means of transportation to work - Subway or elevated (%)
Means of transportation to work - Railroad (%)
Means of transportation to work - Ferryboat (%)
Means of transportation to work - Taxicab (%)
Means of transportation to work - Motorcycle (%)
Means of transportation to work - Bicycle (%)
Means of transportation to work - Walked (%)
Means of transportation to work - Other means (%)
Working at home (%)
Industry diversity
Most Common Industries - Agriculture, forestry, fishing and hunting, and mining (%)
Most Common Industries - Agriculture, forestry, fishing and hunting (%)
Most Common Industries - Mining, quarrying, and oil and gas extraction (%)
Most Common Industries - Construction (%)
Most Common Industries - Manufacturing (%)
Most Common Industries - Wholesale trade (%)
Most Common Industries - Retail trade (%)
Most Common Industries - Transportation and warehousing, and utilities (%)
Most Common Industries - Transportation and warehousing (%)
Most Common Industries - Utilities (%)
Most Common Industries - Information (%)
Most Common Industries - Finance and insurance, and real estate and rental and leasing (%)
Most Common Industries - Finance and insurance (%)
Most Common Industries - Real estate and rental and leasing (%)
Most Common Industries - Professional, scientific, and management, and administrative and waste management services (%)
Most Common Industries - Professional, scientific, and technical services (%)
Most Common Industries - Management of companies and enterprises (%)
Most Common Industries - Administrative and support and waste management services (%)
Most Common Industries - Educational services, and health care and social assistance (%)
Most Common Industries - Educational services (%)
Most Common Industries - Health care and social assistance (%)
Most Common Industries - Arts, entertainment, and recreation, and accommodation and food services (%)
Most Common Industries - Arts, entertainment, and recreation (%)
Most Common Industries - Accommodation and food services (%)
Most Common Industries - Other services, except public administration (%)
Most Common Industries - Public administration (%)
Occupation diversity
Most Common Occupations - Management, business, science, and arts occupations (%)
Most Common Occupations - Management, business, and financial occupations (%)
Most Common Occupations - Management occupations (%)
Most Common Occupations - Business and financial operations occupations (%)
Most Common Occupations - Computer, engineering, and science occupations (%)
Most Common Occupations - Computer and mathematical occupations (%)
Most Common Occupations - Architecture and engineering occupations (%)
Most Common Occupations - Life, physical, and social science occupations (%)
Most Common Occupations - Education, legal, community service, arts, and media occupations (%)
Most Common Occupations - Community and social service occupations (%)
Most Common Occupations - Legal occupations (%)
Most Common Occupations - Education, training, and library occupations (%)
Most Common Occupations - Arts, design, entertainment, sports, and media occupations (%)
Most Common Occupations - Healthcare practitioners and technical occupations (%)
Most Common Occupations - Health diagnosing and treating practitioners and other technical occupations (%)
Most Common Occupations - Health technologists and technicians (%)
Most Common Occupations - Service occupations (%)
Most Common Occupations - Healthcare support occupations (%)
Most Common Occupations - Protective service occupations (%)
Most Common Occupations - Fire fighting and prevention, and other protective service workers including supervisors (%)
Most Common Occupations - Law enforcement workers including supervisors (%)
Most Common Occupations - Food preparation and serving related occupations (%)
Most Common Occupations - Building and grounds cleaning and maintenance occupations (%)
Most Common Occupations - Personal care and service occupations (%)
Most Common Occupations - Sales and office occupations (%)
Most Common Occupations - Sales and related occupations (%)
Most Common Occupations - Office and administrative support occupations (%)
Most Common Occupations - Natural resources, construction, and maintenance occupations (%)
Most Common Occupations - Farming, fishing, and forestry occupations (%)
Most Common Occupations - Construction and extraction occupations (%)
Most Common Occupations - Installation, maintenance, and repair occupations (%)
Most Common Occupations - Production, transportation, and material moving occupations (%)
Most Common Occupations - Production occupations (%)
Most Common Occupations - Transportation occupations (%)
Most Common Occupations - Material moving occupations (%)
People in Group quarters - Institutionalized population (%)
People in Group quarters - Correctional institutions (%)
People in Group quarters - Federal prisons and detention centers (%)
People in Group quarters - Halfway houses (%)
People in Group quarters - Local jails and other confinement facilities (including police lockups) (%)
People in Group quarters - Military disciplinary barracks (%)
People in Group quarters - State prisons (%)
People in Group quarters - Other types of correctional institutions (%)
People in Group quarters - Nursing homes (%)
People in Group quarters - Hospitals/wards, hospices, and schools for the handicapped (%)
People in Group quarters - Hospitals/wards and hospices for chronically ill (%)
People in Group quarters - Hospices or homes for chronically ill (%)
People in Group quarters - Military hospitals or wards for chronically ill (%)
People in Group quarters - Other hospitals or wards for chronically ill (%)
People in Group quarters - Hospitals or wards for drug/alcohol abuse (%)
People in Group quarters - Mental (Psychiatric) hospitals or wards (%)
People in Group quarters - Schools, hospitals, or wards for the mentally retarded (%)
People in Group quarters - Schools, hospitals, or wards for the physically handicapped (%)
People in Group quarters - Institutions for the deaf (%)
People in Group quarters - Institutions for the blind (%)
People in Group quarters - Orthopedic wards and institutions for the physically handicapped (%)
People in Group quarters - Wards in general hospitals for patients who have no usual home elsewhere (%)
People in Group quarters - Wards in military hospitals for patients who have no usual home elsewhere (%)
People in Group quarters - Juvenile institutions (%)
People in Group quarters - Long-term care (%)
People in Group quarters - Homes for abused, dependent, and neglected children (%)
People in Group quarters - Residential treatment centers for emotionally disturbed children (%)
People in Group quarters - Training schools for juvenile delinquents (%)
People in Group quarters - Short-term care, detention or diagnostic centers for delinquent children (%)
People in Group quarters - Type of juvenile institution unknown (%)
People in Group quarters - Noninstitutionalized population (%)
People in Group quarters - College dormitories (includes college quarters off campus) (%)
People in Group quarters - Military quarters (%)
People in Group quarters - On base (%)
People in Group quarters - Barracks, unaccompanied personnel housing (UPH), (Enlisted/Officer), ;and similar group living quarters for military personnel (%)
People in Group quarters - Transient quarters for temporary residents (%)
People in Group quarters - Military ships (%)
People in Group quarters - Group homes (%)
People in Group quarters - Homes or halfway houses for drug/alcohol abuse (%)
People in Group quarters - Homes for the mentally ill (%)
People in Group quarters - Homes for the mentally retarded (%)
People in Group quarters - Homes for the physically handicapped (%)
People in Group quarters - Other group homes (%)
People in Group quarters - Religious group quarters (%)
People in Group quarters - Dormitories (%)
People in Group quarters - Agriculture workers' dormitories on farms (%)
People in Group quarters - Job Corps and vocational training facilities (%)
People in Group quarters - Other workers' dormitories (%)
People in Group quarters - Crews of maritime vessels (%)
People in Group quarters - Other nonhousehold living situations (%)
People in Group quarters - Other noninstitutional group quarters (%)
Residents speaking English at home (%)
Residents speaking English at home - Born in the United States (%)
Residents speaking English at home - Native, born elsewhere (%)
Residents speaking English at home - Foreign born (%)
Residents speaking Spanish at home (%)
Residents speaking Spanish at home - Born in the United States (%)
Residents speaking Spanish at home - Native, born elsewhere (%)
Residents speaking Spanish at home - Foreign born (%)
Residents speaking other language at home (%)
Residents speaking other language at home - Born in the United States (%)
Residents speaking other language at home - Native, born elsewhere (%)
Residents speaking other language at home - Foreign born (%)
Class of Workers - Employee of private company (%)
Class of Workers - Self-employed in own incorporated business (%)
Class of Workers - Private not-for-profit wage and salary workers (%)
Class of Workers - Local government workers (%)
Class of Workers - State government workers (%)
Class of Workers - Federal government workers (%)
Class of Workers - Self-employed workers in own not incorporated business and Unpaid family workers (%)
House heating fuel used in houses and condos - Utility gas (%)
House heating fuel used in houses and condos - Bottled, tank, or LP gas (%)
House heating fuel used in houses and condos - Electricity (%)
House heating fuel used in houses and condos - Fuel oil, kerosene, etc. (%)
House heating fuel used in houses and condos - Coal or coke (%)
House heating fuel used in houses and condos - Wood (%)
House heating fuel used in houses and condos - Solar energy (%)
House heating fuel used in houses and condos - Other fuel (%)
House heating fuel used in houses and condos - No fuel used (%)
House heating fuel used in apartments - Utility gas (%)
House heating fuel used in apartments - Bottled, tank, or LP gas (%)
House heating fuel used in apartments - Electricity (%)
House heating fuel used in apartments - Fuel oil, kerosene, etc. (%)
House heating fuel used in apartments - Coal or coke (%)
House heating fuel used in apartments - Wood (%)
House heating fuel used in apartments - Solar energy (%)
House heating fuel used in apartments - Other fuel (%)
House heating fuel used in apartments - No fuel used (%)
Armed forces status - In Armed Forces (%)
Armed forces status - Civilian (%)
Armed forces status - Civilian - Veteran (%)
Armed forces status - Civilian - Nonveteran (%)
Fatal accidents locations in years 2005-2021
Fatal accidents locations in 2005
Fatal accidents locations in 2006
Fatal accidents locations in 2007
Fatal accidents locations in 2008
Fatal accidents locations in 2009
Fatal accidents locations in 2010
Fatal accidents locations in 2011
Fatal accidents locations in 2012
Fatal accidents locations in 2013
Fatal accidents locations in 2014
Fatal accidents locations in 2015
Fatal accidents locations in 2016
Fatal accidents locations in 2017
Fatal accidents locations in 2018
Fatal accidents locations in 2019
Fatal accidents locations in 2020
Fatal accidents locations in 2021
Alcohol use - People drinking some alcohol every month (%)
Alcohol use - People not drinking at all (%)
Alcohol use - Average days/month drinking alcohol
Alcohol use - Average drinks/week
Alcohol use - Average days/year people drink much
Audiometry - Average condition of hearing (%)
Audiometry - People that can hear a whisper from across a quiet room (%)
Audiometry - People that can hear normal voice from across a quiet room (%)
Audiometry - Ears ringing, roaring, buzzing (%)
Audiometry - Had a job exposure to loud noise (%)
Audiometry - Had off-work exposure to loud noise (%)
Blood Pressure & Cholesterol - Has high blood pressure (%)
Blood Pressure & Cholesterol - Checking blood pressure at home (%)
Blood Pressure & Cholesterol - Frequently checking blood cholesterol (%)
Blood Pressure & Cholesterol - Has high cholesterol level (%)
Consumer Behavior - Money monthly spent on food at supermarket/grocery store
Consumer Behavior - Money monthly spent on food at other stores
Consumer Behavior - Money monthly spent on eating out
Consumer Behavior - Money monthly spent on carryout/delivered foods
Consumer Behavior - Income spent on food at supermarket/grocery store (%)
Consumer Behavior - Income spent on food at other stores (%)
Consumer Behavior - Income spent on eating out (%)
Consumer Behavior - Income spent on carryout/delivered foods (%)
Current Health Status - General health condition (%)
Current Health Status - Blood donors (%)
Current Health Status - Has blood ever tested for HIV virus (%)
Current Health Status - Left-handed people (%)
Dermatology - People using sunscreen (%)
Diabetes - Diabetics (%)
Diabetes - Had a blood test for high blood sugar (%)
Diabetes - People taking insulin (%)
Diet Behavior & Nutrition - Diet health (%)
Diet Behavior & Nutrition - Milk product consumption (# of products/month)
Diet Behavior & Nutrition - Meals not home prepared (#/week)
Diet Behavior & Nutrition - Meals from fast food or pizza place (#/week)
Diet Behavior & Nutrition - Ready-to-eat foods (#/month)
Diet Behavior & Nutrition - Frozen meals/pizza (#/month)
Drug Use - People that ever used marijuana or hashish (%)
Drug Use - Ever used hard drugs (%)
Drug Use - Ever used any form of cocaine (%)
Drug Use - Ever used heroin (%)
Drug Use - Ever used methamphetamine (%)
Health Insurance - People covered by health insurance (%)
Kidney Conditions-Urology - Avg. # of times urinating at night
Medical Conditions - People with asthma (%)
Medical Conditions - People with anemia (%)
Medical Conditions - People with psoriasis (%)
Medical Conditions - People with overweight (%)
Medical Conditions - Elderly people having difficulties in thinking or remembering (%)
Medical Conditions - People who ever received blood transfusion (%)
Medical Conditions - People having trouble seeing even with glass/contacts (%)
Medical Conditions - People with arthritis (%)
Medical Conditions - People with gout (%)
Medical Conditions - People with congestive heart failure (%)
Medical Conditions - People with coronary heart disease (%)
Medical Conditions - People with angina pectoris (%)
Medical Conditions - People who ever had heart attack (%)
Medical Conditions - People who ever had stroke (%)
Medical Conditions - People with emphysema (%)
Medical Conditions - People with thyroid problem (%)
Medical Conditions - People with chronic bronchitis (%)
Medical Conditions - People with any liver condition (%)
Medical Conditions - People who ever had cancer or malignancy (%)
Mental Health - People who have little interest in doing things (%)
Mental Health - People feeling down, depressed, or hopeless (%)
Mental Health - People who have trouble sleeping or sleeping too much (%)
Mental Health - People feeling tired or having little energy (%)
Mental Health - People with poor appetite or overeating (%)
Mental Health - People feeling bad about themself (%)
Mental Health - People who have trouble concentrating on things (%)
Mental Health - People moving or speaking slowly or too fast (%)
Mental Health - People having thoughts they would be better off dead (%)
Oral Health - Average years since last visit a dentist
Oral Health - People embarrassed because of mouth (%)
Oral Health - People with gum disease (%)
Oral Health - General health of teeth and gums (%)
Oral Health - Average days a week using dental floss/device
Oral Health - Average days a week using mouthwash for dental problem
Oral Health - Average number of teeth
Pesticide Use - Households using pesticides to control insects (%)
Pesticide Use - Households using pesticides to kill weeds (%)
Physical Activity - People doing vigorous-intensity work activities (%)
Physical Activity - People doing moderate-intensity work activities (%)
Physical Activity - People walking or bicycling (%)
Physical Activity - People doing vigorous-intensity recreational activities (%)
Physical Activity - People doing moderate-intensity recreational activities (%)
Physical Activity - Average hours a day doing sedentary activities
Physical Activity - Average hours a day watching TV or videos
Physical Activity - Average hours a day using computer
Physical Functioning - People having limitations keeping them from working (%)
Physical Functioning - People limited in amount of work they can do (%)
Physical Functioning - People that need special equipment to walk (%)
Physical Functioning - People experiencing confusion/memory problems (%)
Physical Functioning - People requiring special healthcare equipment (%)
Prescription Medications - Average number of prescription medicines taking
Preventive Aspirin Use - Adults 40+ taking low-dose aspirin (%)
Reproductive Health - Vaginal deliveries (%)
Reproductive Health - Cesarean deliveries (%)
Reproductive Health - Deliveries resulted in a live birth (%)
Reproductive Health - Pregnancies resulted in a delivery (%)
Reproductive Health - Women breastfeeding newborns (%)
Reproductive Health - Women that had a hysterectomy (%)
Reproductive Health - Women that had both ovaries removed (%)
Reproductive Health - Women that have ever taken birth control pills (%)
Reproductive Health - Women taking birth control pills (%)
Reproductive Health - Women that have ever used Depo-Provera or injectables (%)
Reproductive Health - Women that have ever used female hormones (%)
Sexual Behavior - People 18+ that ever had sex (vaginal, anal, or oral) (%)
Sexual Behavior - Males 18+ that ever had vaginal sex with a woman (%)
Sexual Behavior - Males 18+ that ever performed oral sex on a woman (%)
Sexual Behavior - Males 18+ that ever had anal sex with a woman (%)
Sexual Behavior - Males 18+ that ever had any sex with a man (%)
Sexual Behavior - Females 18+ that ever had vaginal sex with a man (%)
Sexual Behavior - Females 18+ that ever performed oral sex on a man (%)
Sexual Behavior - Females 18+ that ever had anal sex with a man (%)
Sexual Behavior - Females 18+ that ever had any kind of sex with a woman (%)
Sexual Behavior - Average age people first had sex
Sexual Behavior - Average number of female sex partners in lifetime (males 18+)
Sexual Behavior - Average number of female vaginal sex partners in lifetime (males 18+)
Sexual Behavior - Average age people first performed oral sex on a woman (18+)
Sexual Behavior - Average number of woman performed oral sex on in lifetime (18+)
Sexual Behavior - Average number of male sex partners in lifetime (males 18+)
Sexual Behavior - Average number of male anal sex partners in lifetime (males 18+)
Sexual Behavior - Average age people first performed oral sex on a man (18+)
Sexual Behavior - Average number of male oral sex partners in lifetime (18+)
Sexual Behavior - People using protection when performing oral sex (%)
Sexual Behavior - Average number of times people have vaginal or anal sex a year
Sexual Behavior - People having sex without condom (%)
Sexual Behavior - Average number of male sex partners in lifetime (females 18+)
Sexual Behavior - Average number of male vaginal sex partners in lifetime (females 18+)
Sexual Behavior - Average number of female sex partners in lifetime (females 18+)
Sexual Behavior - Circumcised males 18+ (%)
Sleep Disorders - Average hours sleeping at night
Sleep Disorders - People that has trouble sleeping (%)
Smoking-Cigarette Use - People smoking cigarettes (%)
Taste & Smell - People 40+ having problems with smell (%)
Taste & Smell - People 40+ having problems with taste (%)
Taste & Smell - People 40+ that ever had wisdom teeth removed (%)
Taste & Smell - People 40+ that ever had tonsils teeth removed (%)
Taste & Smell - People 40+ that ever had a loss of consciousness because of a head injury (%)
Taste & Smell - People 40+ that ever had a broken nose or other serious injury to face or skull (%)
Taste & Smell - People 40+ that ever had two or more sinus infections (%)
Weight - Average height (inches)
Weight - Average weight (pounds)
Weight - Average BMI
Weight - People that are obese (%)
Weight - People that ever were obese (%)
Weight - People trying to lose weight (%)
100%
urban population.
Estimated median house/condo value in 2022: $160,229
44709:
$160,229Ohio:
$204,100
According to our research of Ohio and other state lists, there were 30 registered sex offenders living in 44709 zip code as of April 26, 2024 . The ratio of all residents to sex offenders in zip code 44709 is 655 to 1.The ratio of registered sex offenders to all residents in this zip code is near the state average.
Median resident age: This zip code:
42.9 yearsOhio median age:
39.9 years
Average household size: This zip code:
2.0 peopleOhio:
2.4 people
Averages for the 2020 tax year for zip code 44709, filed in 2021:
Average Adjusted Gross Income (AGI) in 2020: $51,749 (Individual Income Tax Returns) Here:
$51,749State:
$67,288
Salary/wage: $44,510 (reported on 81.5% of returns )Here:
$44,510State:
$55,628
(% of AGI for various income ranges: 1174.4% for AGIs below $25k , 3576.2% for AGIs $25k-50k , 6279.0% for AGIs $50k-75k , 9515.1% for AGIs $75k-100k , 16702.4% for AGIs $100k-200k , 62375.7% for AGIs over 200k ) Taxable interest for individuals: $1,052 (reported on 23.8% of returns )This zip code:
$1,052Ohio:
$1,518
(% of AGI for various income ranges: 12.9% for AGIs below $25k , 10.5% for AGIs $25k-50k , 42.5% for AGIs $50k-75k , 52.2% for AGIs $75k-100k , 148.2% for AGIs $100k-200k , 605.7% for AGIs over 200k ) Ordinary dividends: $6,377 (reported on 17.2% of returns )(% of AGI for various income ranges: 25.6% for AGIs below $25k , 32.1% for AGIs $25k-50k , 113.8% for AGIs $50k-75k , 154.9% for AGIs $75k-100k , 628.9% for AGIs $100k-200k , 5912.9% for AGIs over 200k ) Net capital gain/loss in AGI: +$9,201 (reported on 15.4% of returns )Here:
+$9,201State:
+$18,919
(% of AGI for various income ranges: 13.2% for AGIs below $25k , 26.3% for AGIs $25k-50k , 99.1% for AGIs $50k-75k , 186.7% for AGIs $75k-100k , 716.2% for AGIs $100k-200k , 10222.9% for AGIs over 200k ) Profit/loss from business: +$11,855 (reported on 12.9% of returns )Here:
+$11,855State:
+$13,744
(% of AGI for various income ranges: 81.7% for AGIs below $25k , 98.3% for AGIs $25k-50k , 159.3% for AGIs $50k-75k , 265.7% for AGIs $75k-100k , 525.3% for AGIs $100k-200k , 6897.1% for AGIs over 200k ) Taxable individual retirement arrangement distribution: $17,725 (reported on 9.4% of returns )44709:
$17,725Ohio:
$18,876
(% of AGI for various income ranges: 68.0% for AGIs below $25k , 84.3% for AGIs $25k-50k , 188.4% for AGIs $50k-75k , 332.7% for AGIs $75k-100k , 940.7% for AGIs $100k-200k , 6027.1% for AGIs over 200k ) Self-employed (Keogh) retirement plans: $18,567 (reported on 0.3% of returns )44709:
$18,567Ohio:
$24,898
(% of AGI for various income ranges: 123.8% for AGIs $100k-200k ) Total itemized deductions: $28,916 (reported on 4.1% of returns )Here:
$28,916State:
$33,869
(% of AGI for various income ranges: 29.0% for AGIs below $25k , 39.6% for AGIs $25k-50k , 155.3% for AGIs $50k-75k , 311.8% for AGIs $75k-100k , 658.4% for AGIs $100k-200k , 4670.0% for AGIs over 200k ) Charity contributions: $11,358 (reported on 3.3% of returns )Here:
$11,358State:
$14,577
(% of AGI for various income ranges: 7.8% for AGIs $25k-50k , 36.6% for AGIs $50k-75k , 82.9% for AGIs $75k-100k , 193.6% for AGIs $100k-200k , 2402.9% for AGIs over 200k ) Taxes paid: $6,489 (reported on 4.1% of returns )(% of AGI for various income ranges: 2.9% for AGIs below $25k , 5.6% for AGIs $25k-50k , 37.5% for AGIs $50k-75k , 66.7% for AGIs $75k-100k , 180.4% for AGIs $100k-200k , 1050.0% for AGIs over 200k ) Earned income credit: $2,059 (reported on 15.8% of returns )(% of AGI for various income ranges: 77.1% for AGIs below $25k , 52.7% for AGIs $25k-50k , 1.3% for AGIs $50k-75k ) Percentage of individuals using paid preparers for their 2020 taxes: 93.4%(% for various income ranges: 92.2% for AGIs below $25k , 95.0% for AGIs $25k-50k , 92.5% for AGIs $50k-75k , 94.7% for AGIs $75k-100k , 92.5% for AGIs $100k-200k , 95.7% for AGIs over 200k )
Averages for the 2012 tax year for zip code 44709, filed in 2013:
Average Adjusted Gross Income (AGI) in 2012: $46,566 (Individual Income Tax Returns) Here:
$46,566State:
$54,926
Salary/wage: $39,030 (reported on 82.5% of returns )Here:
$39,030State:
$45,869
(% of AGI for various income ranges: 73.4% for AGIs below $25k , 78.5% for AGIs $25k-50k , 75.8% for AGIs $50k-75k , 76.8% for AGIs $75k-100k , 67.1% for AGIs $100k-200k , 43.5% for AGIs over 200k ) Taxable interest for individuals: $1,289 (reported on 30.9% of returns )This zip code:
$1,289Ohio:
$1,297
(% of AGI for various income ranges: 1.1% for AGIs below $25k , 0.6% for AGIs $25k-50k , 0.6% for AGIs $50k-75k , 0.6% for AGIs $75k-100k , 1.2% for AGIs $100k-200k , 1.2% for AGIs over 200k ) Ordinary dividends: $5,660 (reported on 20.1% of returns )(% of AGI for various income ranges: 2.1% for AGIs below $25k , 1.0% for AGIs $25k-50k , 1.4% for AGIs $50k-75k , 1.4% for AGIs $75k-100k , 3.6% for AGIs $100k-200k , 5.2% for AGIs over 200k ) Net capital gain/loss in AGI: +$7,947 (reported on 13.9% of returns )Here:
+$7,947State:
+$11,232
(% of AGI for various income ranges: 0.2% for AGIs $25k-50k , 0.6% for AGIs $50k-75k , 0.4% for AGIs $75k-100k , 2.7% for AGIs $100k-200k , 10.0% for AGIs over 200k ) Profit/loss from business: +$10,634 (reported on 12.3% of returns )Here:
+$10,634State:
+$12,773
(% of AGI for various income ranges: 4.8% for AGIs below $25k , 1.8% for AGIs $25k-50k , 2.4% for AGIs $50k-75k , 2.3% for AGIs $75k-100k , 4.4% for AGIs $100k-200k , 1.8% for AGIs over 200k ) Taxable individual retirement arrangement distribution: $12,945 (reported on 10.9% of returns )44709:
$12,945Ohio:
$14,511
(% of AGI for various income ranges: 3.3% for AGIs below $25k , 2.2% for AGIs $25k-50k , 3.0% for AGIs $50k-75k , 3.1% for AGIs $75k-100k , 3.4% for AGIs $100k-200k , 3.5% for AGIs over 200k ) Self-employment retirement plans: $14,533 (reported on 0.3% of returns )44709:
$14,533Ohio:
$20,257
(% of AGI for various income ranges: 0.6% for AGIs $100k-200k ) Total itemized deductions: $18,551 (19% of AGI, reported on 25.8% of returns )Here:
$18,551State:
$21,278
Here:
19.2% of AGIState:
18.8% of AGI
(% of AGI for various income ranges: 6.1% for AGIs below $25k , 7.1% for AGIs $25k-50k , 10.4% for AGIs $50k-75k , 11.7% for AGIs $75k-100k , 13.7% for AGIs $100k-200k , 11.9% for AGIs over 200k ) Charity contributions: $3,789 (reported on 21.3% of returns )(% of AGI for various income ranges: 0.6% for AGIs below $25k , 0.8% for AGIs $25k-50k , 1.6% for AGIs $50k-75k , 2.2% for AGIs $75k-100k , 2.3% for AGIs $100k-200k , 2.7% for AGIs over 200k ) Taxes paid: $7,449 (reported on 25.7% of returns )(% of AGI for various income ranges: 1.0% for AGIs below $25k , 1.9% for AGIs $25k-50k , 3.5% for AGIs $50k-75k , 4.2% for AGIs $75k-100k , 6.1% for AGIs $100k-200k , 7.3% for AGIs over 200k ) Earned income credit: $2,035 (reported on 17.4% of returns )(% of AGI for various income ranges: 5.3% for AGIs below $25k , 0.7% for AGIs $25k-50k ) Percentage of individuals using paid preparers for their 2012 taxes: 51.1%(% for various income ranges: 46.3% for AGIs below $25k , 49.8% for AGIs $25k-50k , 53.4% for AGIs $50k-75k , 62.1% for AGIs $75k-100k , 61.7% for AGIs $100k-200k , 82.4% for AGIs over 200k )
Averages for the 2004 tax year for zip code 44709, filed in 2005:
Average Adjusted Gross Income (AGI) in 2004: $41,440 (Individual Income Tax Returns) Here:
$41,440State:
$44,480
Salary/wage: $34,709 (reported on 84.0% of returns )Here:
$34,709State:
$39,198
(% of AGI for various income ranges: 103.2% for AGIs below $10k , 73.9% for AGIs $10k-25k , 80.6% for AGIs $25k-50k , 80.9% for AGIs $50k-75k , 78.8% for AGIs $75k-100k , 46.9% for AGIs over 100k ) Taxable interest for individuals: $1,892 (reported on 44.3% of returns )This zip code:
$1,892Ohio:
$1,532
(% of AGI for various income ranges: 5.9% for AGIs below $10k , 2.9% for AGIs $10k-25k , 1.4% for AGIs $25k-50k , 1.7% for AGIs $50k-75k , 1.7% for AGIs $75k-100k , 2.3% for AGIs over 100k ) Taxable dividends: $4,898 (reported on 26.1% of returns )(% of AGI for various income ranges: 3.7% for AGIs below $10k , 2.0% for AGIs $10k-25k , 1.1% for AGIs $25k-50k , 1.5% for AGIs $50k-75k , 1.4% for AGIs $75k-100k , 7.0% for AGIs over 100k ) Net capital gain/loss: +$5,752 (reported on 20.7% of returns )Here:
+$5,752State:
+$8,582
(% of AGI for various income ranges: -2.3% for AGIs below $10k , 0.3% for AGIs $10k-25k , 0.6% for AGIs $25k-50k , 1.1% for AGIs $50k-75k , 2.0% for AGIs $75k-100k , 7.8% for AGIs over 100k ) Profit/loss from business: +$11,792 (reported on 12.3% of returns )Here:
+$11,792State:
+$10,813
(% of AGI for various income ranges: 4.9% for AGIs below $10k , 3.8% for AGIs $10k-25k , 2.0% for AGIs $25k-50k , 1.5% for AGIs $50k-75k , 3.2% for AGIs $75k-100k , 6.2% for AGIs over 100k ) IRA payment deduction: $2,707 (reported on 2.1% of returns )(% of AGI for various income ranges: 0.2% for AGIs $10k-25k , 0.2% for AGIs $25k-50k , 0.1% for AGIs $50k-75k , 0.1% for AGIs $75k-100k , 0.1% for AGIs over 100k ) Self-employed pension: $11,721 (reported on 0.7% of returns )Total itemized deductions: $15,886 (21% of AGI, reported on 32.2% of returns )Here:
$15,886State:
$17,503
Here:
20.6% of AGIState:
20.8% of AGI
(% of AGI for various income ranges: 10.9% for AGIs below $10k , 7.7% for AGIs $10k-25k , 10.6% for AGIs $25k-50k , 13.5% for AGIs $50k-75k , 15.8% for AGIs $75k-100k , 13.4% for AGIs over 100k ) Charity contributions deductions: $3,089 (4% of AGI, reported on 27.8% of returns )Here:
3.8% of AGIState:
3.4% of AGI
(% of AGI for various income ranges: 0.8% for AGIs below $10k , 0.9% for AGIs $10k-25k , 1.3% for AGIs $25k-50k , 2.1% for AGIs $50k-75k , 2.4% for AGIs $75k-100k , 3.1% for AGIs over 100k ) Total tax: $6,124 (reported on 77.2% of returns )(% of AGI for various income ranges: 2.3% for AGIs below $10k , 4.5% for AGIs $10k-25k , 7.6% for AGIs $25k-50k , 9.0% for AGIs $50k-75k , 10.9% for AGIs $75k-100k , 19.9% for AGIs over 100k ) Earned income credit: $1,443 (reported on 12.6% of returns )Percentage of individuals using paid preparers for their 2004 taxes: 56.3%(% for various income ranges: 48.4% for AGIs below $10k , 55.7% for AGIs $10k-25k , 56.8% for AGIs $25k-50k , 60.6% for AGIs $50k-75k , 58.7% for AGIs $75k-100k , 71.0% for AGIs over 100k )
Estimated median household income in 2022: This zip code:
$46,246Ohio:
$65,720
Nearest zip codes: 44714 ,
44703 ,
44702 ,
44708 ,
44705 ,
44704 .
North Canton Zip Code Map
Percentage of family households: This zip code:
32.5%Ohio:
43.3%
Percentage of households with unmarried partners: This zip code:
7.2%Ohio:
44.6%
Likely homosexual households (counted as self-reported same-sex unmarried-partner households)
Lesbian couples: 0.4% of all households Gay men: 0.2% of all households
Household received Food Stamps/SNAP in the past 12 months: 1,083Household did not receive Food Stamps/SNAP in the past 12 months: 7,679
Women who had a birth in the past 12 months: 92 (39 now married , 52 unmarried) Women who did not have a birth in the past 12 months: 4,385 (1,385 now married , 3,001 unmarried)
Housing units in zip code 44709 with a mortgage: 3,093 (283
second mortgage , 246
both second mortgage and home equity loan )
Houses without a mortgage: 31
Median monthly owner costs for units with a mortgage: $1,140
Median monthly owner costs for units without a mortgage: $469
Residents with income below the poverty level in 2022:
This zip code:
16.7%Whole state:
13.4%
Residents with income below 50% of the poverty level in 2022:
This zip code:
10.0%Whole state:
7.0%
Median number of rooms in houses and condos: Median number of rooms in apartments: Notable locations in this zip code not listed on our city pages
Click to draw/clear zip code borders Notable locations in zip code 44709: (A) , Plain Township Fire Department Station 2 (B) , Canton Fire Department Station 4 (C) , Woolman Hall (D) , Whittier Hall (E) , Timken Science Hall (F) , Penn Hall (G) , Osborne Hall (H) , Mitchell Hall (I) , Heritage Hall (J) , Haviland Hall (K) , Gurney Hall (L) , Fox Hall (M) , Founders Hall (N) , Everett L Cattell Library (O) , Barclay Hall (P) . Display/hide their locations on the map
Shopping Center: (1) . Display/hide its location on the map
Churches in zip code 44709 include: (A) , Christian Tabernacle (B) , Good Shepherd Lutheran Church (C) , Our Lady of Peace Catholic Church (D) , First Friends Church (E) , Canton Gospel Center (F) , Grace United Church of Christ (G) , First Church of the Nazarene (H) , Greenwood Christian Church (I) . Display/hide their locations on the map
Cemeteries: (1) , Forest Hill Cemetery (2) , North Lawn Cemetery (3) , Saint Johns Cemetery (4) . Display/hide their locations on the map
Parks in zip code 44709 include: (1) , Covered Bridge Park (2) , West Park (3) , Harvard Park (4) , Jeaneret Park (5) , Cradle Park (6) . Display/hide their locations on the map
Year house built (houses)
0 2020 or later25 2010 to 2019397 2000 to 2009918 1990 to 1999485 1980 to 19891,577 1970 to 19791,260 1960 to 19691,780 1950 to 19591,140 1940 to 19491,479 1939 or earlier
Zip code 44709 household income distribution in 2022 534 Less than $10,000661 $10,000 to $14,999294 $15,000 to $19,999497 $20,000 to $24,999449 $25,000 to $29,999638 $30,000 to $34,999600 $35,000 to $39,999559 $40,000 to $44,999320 $45,000 to $49,999844 $50,000 to $59,999678 $60,000 to $74,9991,324 $75,000 to $99,999356 $100,000 to $124,999400 $125,000 to $149,999389 $150,000 to $199,999241 $200,000 or moreEstimate of home value of owner-occupied houses/condos in 2022 in zip code 44709 30 $10,000 to $14,99942 $15,000 to $19,99913 $30,000 to $34,99917 $35,000 to $39,99930 $40,000 to $49,999106 $50,000 to $59,99953 $60,000 to $69,999121 $70,000 to $79,999253 $80,000 to $89,999275 $90,000 to $99,999544 $100,000 to $124,999700 $125,000 to $149,999604 $150,000 to $174,999259 $175,000 to $199,999481 $200,000 to $249,999246 $250,000 to $299,999416 $300,000 to $399,999166 $400,000 to $499,999139 $500,000 to $749,99921 $750,000 to $999,9997 $1,000,000 to $1,499,999Rent paid by renters in 2022 in zip code 44709 23 $100 to $14982 $150 to $199296 $200 to $24920 $250 to $29999 $300 to $34916 $350 to $39993 $400 to $44983 $450 to $499214 $500 to $549630 $550 to $599321 $600 to $64964 $650 to $699477 $700 to $749244 $750 to $799304 $800 to $899367 $900 to $999128 $1,000 to $1,24966 $1,250 to $1,49927 $1,500 to $1,99919 $2,500 to $2,99935 $3,000 to $3,49912 $3,500 or more72 No cash rent
Median gross rent in 2022: $796.
Median price asked for vacant for-sale houses and condos in 2022: $512,797.
Estimated median house (or condo) value in 2022 for: White Non-Hispanic householders: $160,734Black or African American householders: $133,608Asian householders: $175,898Two or more races householders: $129,059Hispanic or Latino householders: $108,672Estimated median house or condo value in 2022: $160,229
44709:
$160,229Ohio:
$204,100
Lower value quartile - upper value quartile: $110,163 - $236,557
Mean price in 2022: Detached houses: $124,321Here:
$124,321State:
$254,366
Townhouses or other attached units: $261,545Here:
$261,545State:
$225,733
In 2-unit structures: $600,078Here:
$600,078State:
$144,384
In 5-or-more-unit structures: $147,207Here:
$147,207State:
$211,593
Mobile homes: $78,700Here:
$78,700State:
$62,719
Housing units in structures:
One, detached: 5,469One, attached: 345Two: 5693 or 4: 4885 to 9: 97510 to 19: 58320 to 49: 37050 or more: 388Mobile homes: 59Unemployment : 3.8%
Means of transportation to work in zip code 44709 76.1% 6,907 Drove a car alone5.1% 465 Carpooled0.7% 66 Bus or trolley bus0.3% 30 Taxi1.2% 105 Walked0.7% 60 Other means16.8% 1,528 Worked at homeTravel time to work (commute) in zip code 44709 166 Less than 5 minutes1,354 5 to 9 minutes2,105 10 to 14 minutes1,726 15 to 19 minutes516 20 to 24 minutes378 25 to 29 minutes644 30 to 34 minutes100 35 to 39 minutes29 40 to 44 minutes324 45 to 59 minutes194 60 to 89 minutes104 90 or more minutes
Neighborhoods in zip code 44709: Percentage of zip code residents living and working in this county: 81.1%
Household type by relationship:
Households: 18,313
Male householders: 3,903 (1,645 living alone ), Female householders: 4,866 (2,170 living alone )3,027 spouses (2,992 opposite-sex spouses ), 542 unmarried partners , (542 opposite-sex unmarried partners ), 3,994 children (3,853 natural , 18 adopted , 122 stepchildren ), 209 grandchildren , 164 brothers or sisters , 102 parents , 42 foster children , 156 other relatives , 317 non-relatives In group quarters: 1,035 (-1 institutionalized population )
Size of family households: 2,360 2-persons , 823 3-persons , 617 4-persons , 332 5-persons , 87 6-persons , 63 7-or-more-persons
Size of nonfamily households: 3,817 1-person , 655 2-persons , 17 3-persons , 17 4-persons
1,503 married couples with children. single-parent households (342 men , 1,145 women ).
91.7% of residents of 44709 zip code speak English at home. of residents speak Spanish at home (41% very well, 16% well, 24% not well, 19% not at all ).of residents speak other Indo-European language at home (56% very well, 39% well, 6% not well ).of residents speak Asian or Pacific Island language at home (96% very well, 4% well ).of residents speak other language at home (71% very well, 29% not well ).
Foreign born population: 853 (4.7%)
(45.2%
of them are naturalized citizens )
This zip code:
4.7%Whole state:
5.0%
31% Honduras 17% El Salvador 5% Costa Rica 5% Nepal 4% Sweden 4% Bhutan 3% Greece 13% German 11% English 9% Italian 6% American 5% African 5% European 5% Irish
Year of entry for the foreign-born population
183 2010 or later 333 2000 to 2009 60 1990 to 1999 306 Before 1990
There are
73 Medical Specialists in Zip Code 44709 .
Facilities with environmental interests located in this zip code:
ACE 1 HR CLEANERS (3017 CLEVELAND AVE NW in CANTON, OH)
STATE MASTER (Ohio general info) - AIR MAJOR Small Quantity Generators, between 100 kg and 1000 kg of hazardous waste/month (Resource Conservation and Recovery Act (tracking hazardous waste)) - notification Organizations: HUFFMAN DIANA (CONTACT/OWNER)
Alternative names: ACE CLEANERS
AUTO ELECTRIC (4525 CLEVELAND AVE NW in CANTON, OH)
STATE MASTER (Ohio general info) - RCRA-OHD987006962, HAZARDOUS WASTE PROGRAM, AIR MAJOR Small Quantity Generators, between 100 kg and 1000 kg of hazardous waste/month (Resource Conservation and Recovery Act (tracking hazardous waste)) - notification Organizations: NORCIA JOHN (CONTACT/OWNER)
BLAIR S CLEANERS (3775 CLEVELAND AVE in CANTON, OH)
STATE MASTER (Ohio general info) - AIR MAJOR, RCRA-OHD094492964, HAZARDOUS WASTE PROGRAM Small Quantity Generators, between 100 kg and 1000 kg of hazardous waste/month (Resource Conservation and Recovery Act (tracking hazardous waste)) - notification Organizations: FORSHUR INC (CONTACT/OWNER)
Alternative names: BLAIR'S CLEANERS
BLAIR S CLEANERS (1913 CLEVELAND AVE in CANTON, OH)
STATE MASTER (Ohio general info) - AIR MAJOR Small Quantity Generators, between 100 kg and 1000 kg of hazardous waste/month (Resource Conservation and Recovery Act (tracking hazardous waste)) - notification Organizations: BOY BLUE 1HR CLEANERS (CONTACT/OWNER)
Alternative names: BLAIR'S CLEANERS
ASBESTOS MANAGEMENT INC (1177 S MAIN in NORTH CANTON, OH)
COMPLIANCE ACTIVITY (Tracking inspections of insecticide, fungicide, and rodenticide, and toxic substances)
Housing units lacking complete plumbing facilities: 0.9%
Housing units lacking complete kitchen facilities: 1.9%
73.1% Utility gas 24.3% Electricity 1.4% Bottled, tank, or LP gas
Population in 1990: 19,371.
Place of birth for U.S.-born residents:
This state: 14,793Northeast: 925Midwest: 483South: 808West: 400
55% of the 44709 zip code residents lived in the same house 5 years ago.
Out of people who lived in different houses, 73% lived in this county.
Out of people who lived in different counties, 50% lived in Ohio.
89% of the 44709 zip code residents lived in the same house 1 year ago.
Out of people who lived in different houses, 68% moved from this county.
Out of people who lived in different houses, 17% moved from different county within same state.
Out of people who lived in different houses, 11% moved from different state.
Private vs. public school enrollment:
Students in private schools in grades 1 to 8 (elementary and middle school): 286
Students in private schools in grades 9 to 12 (high school): 85
Students in private undergraduate colleges: 731
Occupation by median earnings in the past 12 months ($)
140,604 Legal occupations 122,569 Architecture and engineering occupations 63,753 Life, physical, and social science occupations 59,748 Law enforcement workers including supervisors 58,110 Health diagnosing and treating practitioners and other technical occupations 55,659 Management occupations
Companies with federal contracts located in this zip code:
THARALDSON PROPERTY MANAGEMENT (5280 BROADMOOR CIRCLE NORT in CANTON, OH; small business)
$5,911 with Army for Perishable Subsistence $10k To $25K. Signed on 2005-08-30. Completion date: 2005-08-12.
Top industries in this zip code by the number of employees in 2005:
Educational Services: Colleges, Universities, and Professional Schools (500-999 employees: 1 establishment)Accommodation and Food Services: Limited-Service Restaurants (50-99: 1, 20-49: 12, 10-19: 2, 5-9: 3, 1-4: 3)Administrative and Support and Waste Management and Remediation Services: Temporary Help Services (250-499: 1)Accommodation and Food Services: Full-Service Restaurants (50-99: 3, 10-19: 2, 5-9: 4, 1-4: 3)Other Services (except Public Administration): Religious Organizations (50-99: 1, 20-49: 4, 10-19: 1, 5-9: 4, 1-4: 10)Health Care and Social Assistance: Continuing Care Retirement Communities (100-249: 1, 50-99: 1)Health Care and Social Assistance: Nursing Care Facilities (100-249: 1, 20-49: 2)Administrative and Support and Waste Management and Remediation Services: Employment Placement Agencies (100-249: 1)
People in group quarters in 2010:
1,031 people in college/university student housing
303 people in nursing facilities/skilled-nursing facilities
33 people in group homes intended for adults
4 people in other noninstitutional facilities
People in group quarters in 2000:
807 people in college dormitories (includes college quarters off campus)
552 people in nursing homes
73 people in other group homes
39 people in homes for the mentally retarded
6 people in religious group quarters
Fatal accident statistics in 2014:
Fatal accident count: 1Vehicles involved in fatal accidents: 2Fatal accidents caused by drunken drivers: 0Fatalities: 1Persons involved in fatal accidents: 2Pedestrians involved in fatal accidents: 0
Fatal accident statistics in 2013:
Fatal accident count: 3Vehicles involved in fatal accidents: 4Fatal accidents caused by drunken drivers: 1Fatalities: 3Persons involved in fatal accidents: 5Pedestrians involved in fatal accidents: 1
Home Mortgage Disclosure Act Aggregated Statistics For Year 2009(Based on 4 full and 8 partial tracts) A) FHA, FSA/RHS & VA B) Conventional C) Refinancings D) Home Improvement Loans E) Loans on Dwellings For 5+ Families F) Non-occupant Loans on G) Loans On Manufactured Number Average Value Number Average Value Number Average Value Number Average Value Number Average Value Number Average Value Number Average Value
LOANS ORIGINATED 217 $99,458 103 $112,303 506 $117,367 36 $27,549 1 $20,160 26 $69,299 2 $95,960 APPLICATIONS APPROVED, NOT ACCEPTED 5 $90,364 2 $69,540 61 $106,710 7 $41,306 3 $3,137,047 3 $57,977 0 $0 APPLICATIONS DENIED 21 $79,260 14 $74,254 214 $120,825 40 $27,211 0 $0 14 $69,467 0 $0 APPLICATIONS WITHDRAWN 17 $74,819 6 $54,960 87 $108,671 3 $27,907 0 $0 2 $55,875 0 $0 FILES CLOSED FOR INCOMPLETENESS 3 $82,660 4 $72,660 30 $110,080 0 $0 0 $0 0 $0 0 $0
Aggregated Statistics For Year 2008(Based on 4 full and 8 partial tracts) A) FHA, FSA/RHS & VA B) Conventional C) Refinancings D) Home Improvement Loans E) Loans on Dwellings For 5+ Families F) Non-occupant Loans on G) Loans On Manufactured Number Average Value Number Average Value Number Average Value Number Average Value Number Average Value Number Average Value Number Average Value
LOANS ORIGINATED 171 $100,118 199 $113,076 282 $106,579 64 $16,446 1 $237,890 56 $60,066 0 $0 APPLICATIONS APPROVED, NOT ACCEPTED 9 $86,560 11 $114,238 47 $115,969 20 $24,674 0 $0 7 $78,886 0 $0 APPLICATIONS DENIED 14 $115,817 25 $87,215 302 $102,733 90 $27,745 1 $635,900 25 $69,292 3 $6,160 APPLICATIONS WITHDRAWN 12 $110,983 19 $128,064 91 $113,299 9 $47,307 3 $3,091,480 9 $81,464 0 $0 FILES CLOSED FOR INCOMPLETENESS 0 $0 3 $125,090 26 $90,373 2 $7,835 0 $0 5 $77,432 0 $0
Aggregated Statistics For Year 2007(Based on 4 full and 8 partial tracts) A) FHA, FSA/RHS & VA B) Conventional C) Refinancings D) Home Improvement Loans E) Loans on Dwellings For 5+ Families F) Non-occupant Loans on G) Loans On Manufactured Number Average Value Number Average Value Number Average Value Number Average Value Number Average Value Number Average Value Number Average Value
LOANS ORIGINATED 61 $99,317 373 $104,788 376 $95,271 92 $41,918 3 $327,717 82 $82,886 0 $0 APPLICATIONS APPROVED, NOT ACCEPTED 5 $104,396 18 $102,831 89 $103,652 20 $63,776 2 $15,900 10 $68,889 0 $0 APPLICATIONS DENIED 13 $92,965 82 $102,877 385 $105,753 121 $42,400 2 $156,575 30 $73,900 1 $50,110 APPLICATIONS WITHDRAWN 4 $149,535 42 $92,251 125 $108,099 22 $83,324 0 $0 17 $50,448 0 $0 FILES CLOSED FOR INCOMPLETENESS 0 $0 4 $91,982 55 $119,658 6 $84,708 0 $0 1 $56,660 0 $0
Aggregated Statistics For Year 2006(Based on 4 full and 8 partial tracts) A) FHA, FSA/RHS & VA B) Conventional C) Refinancings D) Home Improvement Loans E) Loans on Dwellings For 5+ Families F) Non-occupant Loans on G) Loans On Manufactured Number Average Value Number Average Value Number Average Value Number Average Value Number Average Value Number Average Value Number Average Value
LOANS ORIGINATED 78 $105,802 605 $91,043 609 $91,671 100 $38,258 4 $197,195 87 $67,923 2 $39,985 APPLICATIONS APPROVED, NOT ACCEPTED 0 $0 56 $107,078 147 $88,555 18 $51,351 0 $0 8 $66,065 0 $0 APPLICATIONS DENIED 3 $135,557 105 $93,985 500 $101,079 141 $40,075 3 $151,657 54 $81,231 3 $71,830 APPLICATIONS WITHDRAWN 9 $139,188 53 $89,952 234 $110,236 23 $77,737 1 $137,760 20 $73,590 0 $0 FILES CLOSED FOR INCOMPLETENESS 0 $0 14 $80,245 76 $125,424 3 $102,490 0 $0 4 $221,362 0 $0
Aggregated Statistics For Year 2005(Based on 4 full and 8 partial tracts) A) FHA, FSA/RHS & VA B) Conventional C) Refinancings D) Home Improvement Loans E) Loans on Dwellings For 5+ Families F) Non-occupant Loans on G) Loans On Manufactured Number Average Value Number Average Value Number Average Value Number Average Value Number Average Value Number Average Value Number Average Value
LOANS ORIGINATED 91 $102,582 619 $95,753 664 $98,163 57 $42,869 3 $413,617 121 $72,002 1 $16,700 APPLICATIONS APPROVED, NOT ACCEPTED 8 $86,715 69 $93,101 121 $106,169 17 $40,885 0 $0 13 $70,018 0 $0 APPLICATIONS DENIED 8 $111,832 87 $77,894 546 $107,635 105 $41,116 2 $225,585 36 $73,326 1 $233,860 APPLICATIONS WITHDRAWN 3 $140,700 93 $115,326 342 $116,823 45 $101,778 2 $352,475 13 $84,708 0 $0 FILES CLOSED FOR INCOMPLETENESS 0 $0 17 $90,295 79 $116,872 3 $112,347 0 $0 3 $75,487 0 $0
Aggregated Statistics For Year 2004(Based on 4 full and 8 partial tracts) A) FHA, FSA/RHS & VA B) Conventional C) Refinancings D) Home Improvement Loans E) Loans on Dwellings For 5+ Families F) Non-occupant Loans on G) Loans On Manufactured Number Average Value Number Average Value Number Average Value Number Average Value Number Average Value Number Average Value Number Average Value
LOANS ORIGINATED 102 $100,660 582 $101,851 806 $97,078 49 $44,920 7 $777,090 143 $74,014 3 $21,810 APPLICATIONS APPROVED, NOT ACCEPTED 7 $108,240 37 $77,893 167 $89,793 22 $44,120 0 $0 10 $80,666 0 $0 APPLICATIONS DENIED 10 $97,778 105 $83,934 573 $102,033 95 $42,359 0 $0 34 $73,138 5 $42,656 APPLICATIONS WITHDRAWN 4 $140,268 48 $95,656 339 $106,003 25 $32,096 0 $0 17 $70,636 0 $0 FILES CLOSED FOR INCOMPLETENESS 5 $88,842 15 $58,019 86 $107,477 4 $46,215 0 $0 7 $79,949 0 $0
Aggregated Statistics For Year 2003(Based on 4 full and 8 partial tracts) A) FHA, FSA/RHS & VA B) Conventional C) Refinancings D) Home Improvement Loans E) Loans on Dwellings For 5+ Families F) Non-occupant Loans on Number Average Value Number Average Value Number Average Value Number Average Value Number Average Value Number Average Value
LOANS ORIGINATED 136 $95,826 536 $100,189 1,660 $96,111 49 $15,675 4 $197,892 151 $72,809 APPLICATIONS APPROVED, NOT ACCEPTED 4 $106,458 42 $99,738 256 $96,269 21 $38,356 0 $0 23 $75,226 APPLICATIONS DENIED 14 $78,667 50 $85,554 508 $97,535 77 $16,002 2 $319,920 34 $65,764 APPLICATIONS WITHDRAWN 7 $111,684 58 $113,588 307 $98,711 6 $19,245 0 $0 23 $78,489 FILES CLOSED FOR INCOMPLETENESS 4 $86,650 24 $87,762 91 $96,407 3 $9,430 0 $0 11 $60,236
Aggregated Statistics For Year 2002(Based on 4 full and 8 partial tracts) A) FHA, FSA/RHS & VA B) Conventional C) Refinancings D) Home Improvement Loans E) Loans on Dwellings For 5+ Families F) Non-occupant Loans on Number Average Value Number Average Value Number Average Value Number Average Value Number Average Value Number Average Value
LOANS ORIGINATED 123 $91,196 559 $102,872 1,228 $95,474 59 $16,195 10 $594,907 110 $83,442 APPLICATIONS APPROVED, NOT ACCEPTED 6 $65,552 31 $112,736 254 $92,885 21 $16,011 2 $263,890 12 $60,676 APPLICATIONS DENIED 7 $102,050 45 $82,528 516 $92,643 56 $12,767 1 $291,360 22 $63,751 APPLICATIONS WITHDRAWN 4 $70,495 27 $95,499 257 $105,601 10 $28,246 0 $0 13 $71,334 FILES CLOSED FOR INCOMPLETENESS 2 $117,970 10 $117,425 79 $108,159 2 $25,665 0 $0 5 $71,590
Aggregated Statistics For Year 2001(Based on 4 full and 8 partial tracts) A) FHA, FSA/RHS & VA B) Conventional C) Refinancings D) Home Improvement Loans E) Loans on Dwellings For 5+ Families F) Non-occupant Loans on Number Average Value Number Average Value Number Average Value Number Average Value Number Average Value Number Average Value
LOANS ORIGINATED 141 $89,811 439 $97,656 1,141 $88,158 80 $13,595 3 $423,697 99 $70,974 APPLICATIONS APPROVED, NOT ACCEPTED 6 $71,670 36 $98,626 160 $76,327 26 $15,438 1 $255,360 5 $65,936 APPLICATIONS DENIED 6 $86,567 52 $82,046 463 $80,257 100 $17,237 0 $0 30 $86,399 APPLICATIONS WITHDRAWN 2 $112,705 32 $83,889 256 $89,786 16 $54,329 0 $0 11 $93,747 FILES CLOSED FOR INCOMPLETENESS 0 $0 9 $56,922 69 $87,102 1 $22,040 0 $0 1 $40,920
Aggregated Statistics For Year 2000(Based on 4 full and 8 partial tracts) A) FHA, FSA/RHS & VA B) Conventional C) Refinancings D) Home Improvement Loans E) Loans on Dwellings For 5+ Families F) Non-occupant Loans on Number Average Value Number Average Value Number Average Value Number Average Value Number Average Value Number Average Value
LOANS ORIGINATED 108 $83,383 444 $93,749 387 $73,736 111 $12,819 3 $222,897 67 $62,276 APPLICATIONS APPROVED, NOT ACCEPTED 2 $102,960 33 $95,510 97 $67,765 66 $14,807 0 $0 6 $67,457 APPLICATIONS DENIED 11 $71,681 74 $71,441 281 $68,585 109 $33,487 0 $0 21 $61,641 APPLICATIONS WITHDRAWN 2 $92,375 45 $77,459 132 $69,649 10 $26,753 0 $0 7 $67,283 FILES CLOSED FOR INCOMPLETENESS 0 $0 11 $68,101 62 $84,579 0 $0 0 $0 3 $88,610
Aggregated Statistics For Year 1999(Based on 2 full and 4 partial tracts) A) FHA, FSA/RHS & VA B) Conventional C) Refinancings D) Home Improvement Loans E) Loans on Dwellings For 5+ Families F) Non-occupant Loans on Number Average Value Number Average Value Number Average Value Number Average Value Number Average Value Number Average Value
LOANS ORIGINATED 65 $78,517 239 $92,871 386 $72,596 59 $7,976 6 $700,343 47 $71,426 APPLICATIONS APPROVED, NOT ACCEPTED 4 $78,722 13 $88,608 98 $70,963 27 $23,065 0 $0 5 $70,036 APPLICATIONS DENIED 3 $82,580 28 $65,069 170 $75,433 43 $16,631 0 $0 9 $97,486 APPLICATIONS WITHDRAWN 6 $85,128 14 $61,800 104 $68,846 7 $65,967 0 $0 4 $70,862 FILES CLOSED FOR INCOMPLETENESS 0 $0 3 $57,053 35 $88,441 0 $0 0 $0 1 $27,640
Private Mortgage Insurance Companies Aggregated Statistics For Year 2009(Based on 4 full and 8 partial tracts) A) Conventional B) Refinancings Number Average Value Number Average Value
LOANS ORIGINATED 23 $87,029 21 $116,342 APPLICATIONS APPROVED, NOT ACCEPTED 11 $117,121 5 $167,044 APPLICATIONS DENIED 7 $57,739 9 $112,867 APPLICATIONS WITHDRAWN 2 $92,035 3 $121,020 FILES CLOSED FOR INCOMPLETENESS 0 $0 0 $0
Aggregated Statistics For Year 2008(Based on 4 full and 8 partial tracts) A) Conventional B) Refinancings C) Non-occupant Loans on Number Average Value Number Average Value Number Average Value
LOANS ORIGINATED 91 $134,477 38 $113,159 14 $71,019 APPLICATIONS APPROVED, NOT ACCEPTED 30 $167,771 25 $101,478 7 $101,329 APPLICATIONS DENIED 10 $101,618 2 $98,890 9 $74,508 APPLICATIONS WITHDRAWN 1 $128,350 0 $0 0 $0 FILES CLOSED FOR INCOMPLETENESS 4 $66,400 0 $0 0 $0
Aggregated Statistics For Year 2007(Based on 4 full and 8 partial tracts) A) Conventional B) Refinancings C) Non-occupant Loans on Number Average Value Number Average Value Number Average Value
LOANS ORIGINATED 164 $108,401 51 $118,071 16 $70,119 APPLICATIONS APPROVED, NOT ACCEPTED 11 $142,164 14 $122,664 2 $52,190 APPLICATIONS DENIED 2 $114,245 4 $101,978 0 $0 APPLICATIONS WITHDRAWN 5 $115,140 5 $114,626 0 $0 FILES CLOSED FOR INCOMPLETENESS 0 $0 0 $0 0 $0
Aggregated Statistics For Year 2006(Based on 4 full and 8 partial tracts) A) Conventional B) Refinancings C) Non-occupant Loans on Number Average Value Number Average Value Number Average Value
LOANS ORIGINATED 142 $98,638 59 $115,156 22 $77,144 APPLICATIONS APPROVED, NOT ACCEPTED 2 $236,390 25 $116,052 0 $0 APPLICATIONS DENIED 1 $89,350 0 $0 1 $53,920 APPLICATIONS WITHDRAWN 3 $124,800 4 $175,948 0 $0 FILES CLOSED FOR INCOMPLETENESS 0 $0 3 $116,400 0 $0
Aggregated Statistics For Year 2005(Based on 4 full and 8 partial tracts) A) Conventional B) Refinancings C) Non-occupant Loans on Number Average Value Number Average Value Number Average Value
LOANS ORIGINATED 108 $111,130 66 $112,045 20 $76,240 APPLICATIONS APPROVED, NOT ACCEPTED 10 $162,620 16 $129,314 2 $131,090 APPLICATIONS DENIED 4 $97,910 0 $0 2 $72,455 APPLICATIONS WITHDRAWN 5 $91,780 3 $130,520 3 $52,283 FILES CLOSED FOR INCOMPLETENESS 0 $0 3 $135,133 0 $0
Aggregated Statistics For Year 2004(Based on 4 full and 8 partial tracts) A) Conventional B) Refinancings C) Non-occupant Loans on Number Average Value Number Average Value Number Average Value
LOANS ORIGINATED 117 $109,928 67 $105,482 23 $63,044 APPLICATIONS APPROVED, NOT ACCEPTED 18 $118,658 26 $93,894 3 $88,770 APPLICATIONS DENIED 2 $370,270 0 $0 1 $370,830 APPLICATIONS WITHDRAWN 1 $107,480 6 $92,092 1 $89,380 FILES CLOSED FOR INCOMPLETENESS 2 $83,965 3 $52,010 0 $0
Aggregated Statistics For Year 2003(Based on 4 full and 8 partial tracts) A) Conventional B) Refinancings C) Non-occupant Loans on Number Average Value Number Average Value Number Average Value
LOANS ORIGINATED 163 $107,809 165 $104,447 23 $84,598 APPLICATIONS APPROVED, NOT ACCEPTED 25 $95,324 63 $109,579 7 $51,481 APPLICATIONS DENIED 0 $0 2 $157,400 1 $229,800 APPLICATIONS WITHDRAWN 5 $112,290 13 $121,252 2 $73,420 FILES CLOSED FOR INCOMPLETENESS 0 $0 3 $113,787 0 $0
Aggregated Statistics For Year 2002(Based on 4 full and 8 partial tracts) A) Conventional B) Refinancings C) Non-occupant Loans on Number Average Value Number Average Value Number Average Value
LOANS ORIGINATED 182 $94,544 149 $110,364 29 $65,060 APPLICATIONS APPROVED, NOT ACCEPTED 14 $137,889 32 $110,763 0 $0 APPLICATIONS DENIED 3 $110,653 5 $73,522 3 $74,667 APPLICATIONS WITHDRAWN 8 $98,859 12 $104,780 2 $97,090 FILES CLOSED FOR INCOMPLETENESS 1 $116,260 3 $92,397 0 $0
Aggregated Statistics For Year 2001(Based on 4 full and 8 partial tracts) A) Conventional B) Refinancings C) Non-occupant Loans on Number Average Value Number Average Value Number Average Value
LOANS ORIGINATED 140 $97,464 120 $99,461 22 $60,697 APPLICATIONS APPROVED, NOT ACCEPTED 19 $88,766 29 $109,427 5 $74,684 APPLICATIONS DENIED 0 $0 6 $103,470 1 $53,680 APPLICATIONS WITHDRAWN 4 $73,970 0 $0 0 $0 FILES CLOSED FOR INCOMPLETENESS 0 $0 2 $109,955 0 $0
Aggregated Statistics For Year 2000(Based on 4 full and 8 partial tracts) A) Conventional B) Refinancings C) Non-occupant Loans on Number Average Value Number Average Value Number Average Value
LOANS ORIGINATED 154 $93,190 45 $95,850 16 $60,006 APPLICATIONS APPROVED, NOT ACCEPTED 20 $92,322 12 $93,828 1 $27,550 APPLICATIONS DENIED 4 $92,995 0 $0 2 $93,015 APPLICATIONS WITHDRAWN 0 $0 0 $0 0 $0 FILES CLOSED FOR INCOMPLETENESS 1 $49,990 0 $0 0 $0
Aggregated Statistics For Year 1999(Based on 2 full and 4 partial tracts) A) Conventional B) Refinancings C) Non-occupant Loans on Number Average Value Number Average Value Number Average Value
LOANS ORIGINATED 88 $93,777 39 $88,374 8 $65,666 APPLICATIONS APPROVED, NOT ACCEPTED 12 $101,177 4 $99,122 0 $0 APPLICATIONS DENIED 1 $178,570 1 $131,480 1 $58,510 APPLICATIONS WITHDRAWN 0 $0 0 $0 0 $0 FILES CLOSED FOR INCOMPLETENESS 1 $65,770 1 $67,910 1 $86,740
2002 - 2018 National Fire Incident Reporting System (NFIRS) incidents See full 2006 National Fire Incident Reporting System statistics for zip code 44709, Ohio
Most common first names in zip code 44709 among deceased individuals Name Count Lived (average)
Mary 254 81.2 years John 197 75.3 years William 150 76.4 years Robert 129 73.1 years Helen 124 80.4 years James 119 75.0 years Charles 110 77.8 years George 101 77.4 years Margaret 96 80.7 years Dorothy 86 79.6 years
Most common last names in zip code 44709 among deceased individuals Last name Count Lived (average)
Miller 63 78.5 years Smith 61 79.7 years Jones 33 79.6 years Brown 29 77.5 years Davis 28 79.6 years Martin 23 82.1 years Wilson 23 76.9 years Moore 23 82.5 years Thomas 21 77.9 years Johnson 21 73.2 years
Businesses in zip code 44709
Name Count Name Count
AT&T 1 McDonald's 2 Arby's 1 Papa John's Pizza 1 AutoZone 1 Pizza Hut 1 Blockbuster 1 Quiznos 1 Burger King 1 RadioShack 1 Comfort Inn 1 Rite Aid 1 Dennys 1 Sears 1 GNC 1 Subway 2 H&R Block 1 T-Mobile 1 Hilton 1 Taco Bell 1 KFC 1 U-Haul 1 La Quinta 1 UPS 1 La-Z-Boy 1 Wendy's 1 Little Caesars Pizza 1 YMCA 1 Marriott 2
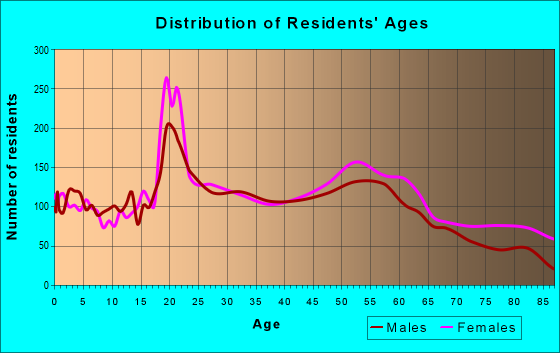
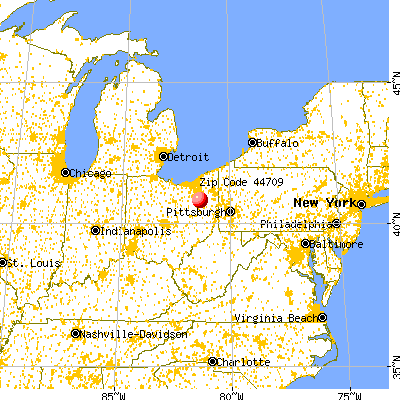


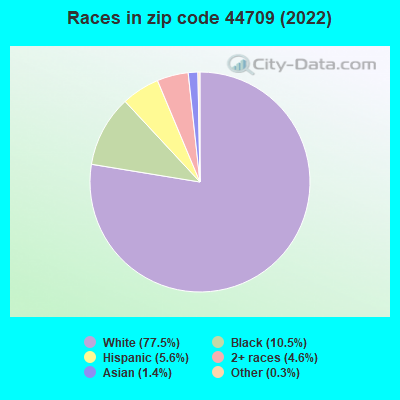


 Nearest zip codes: 44714, 44703, 44702, 44708, 44705, 44704.
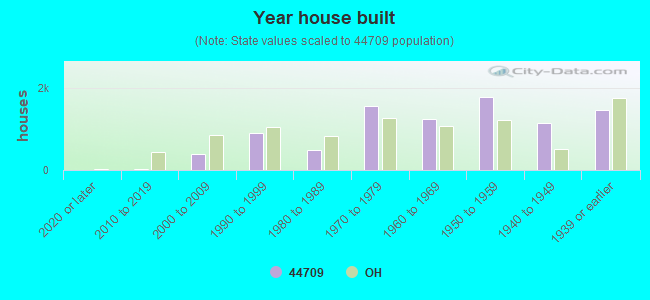
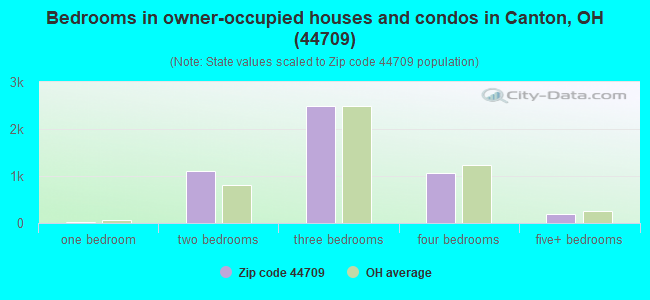
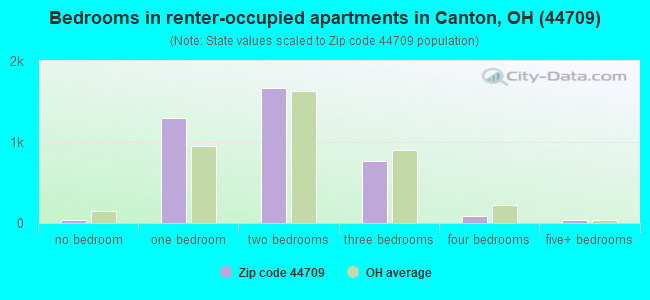
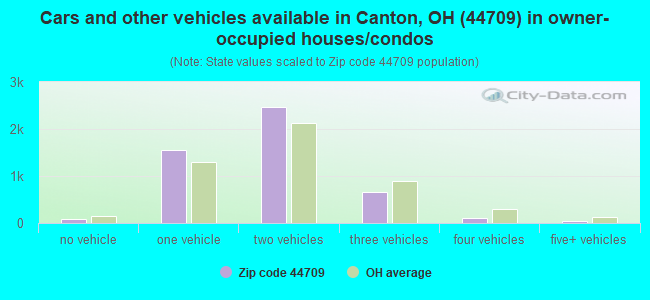
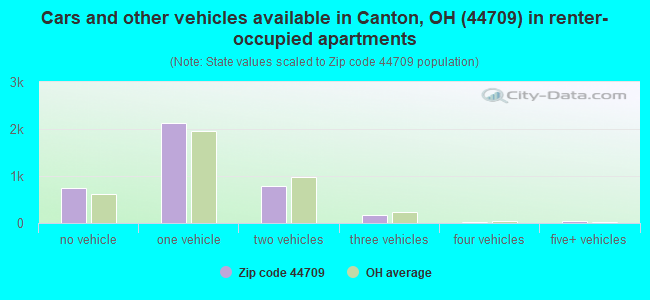


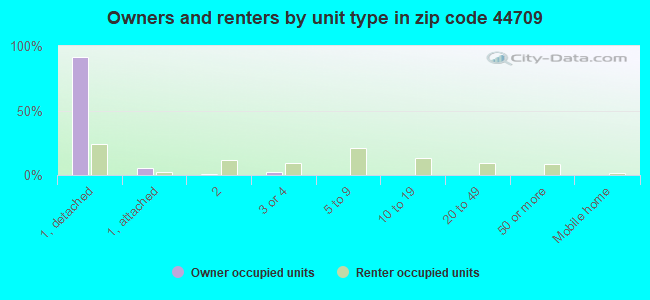
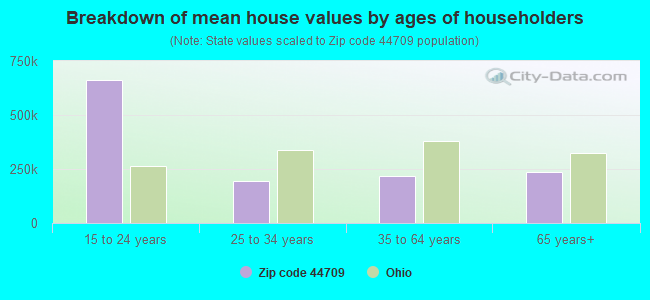


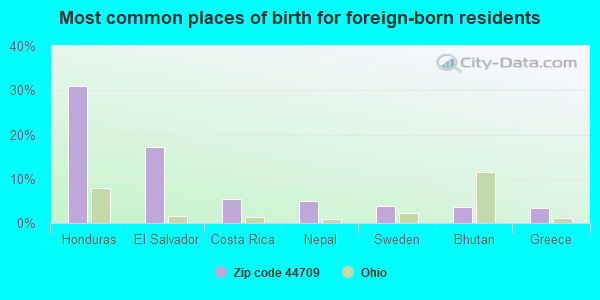
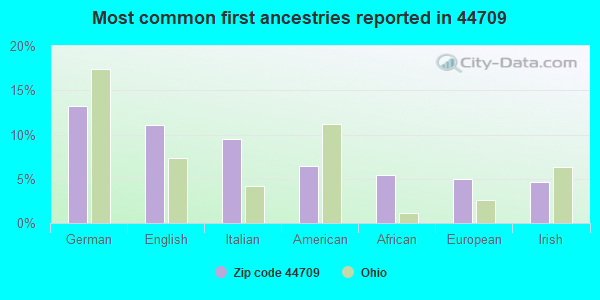
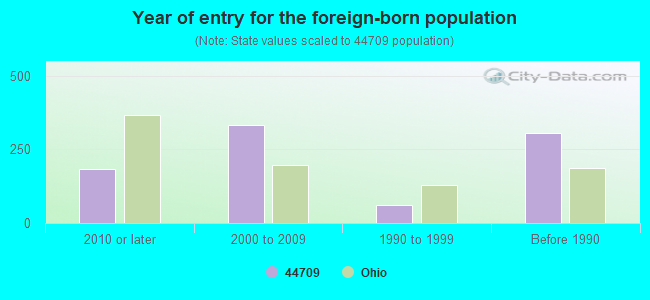
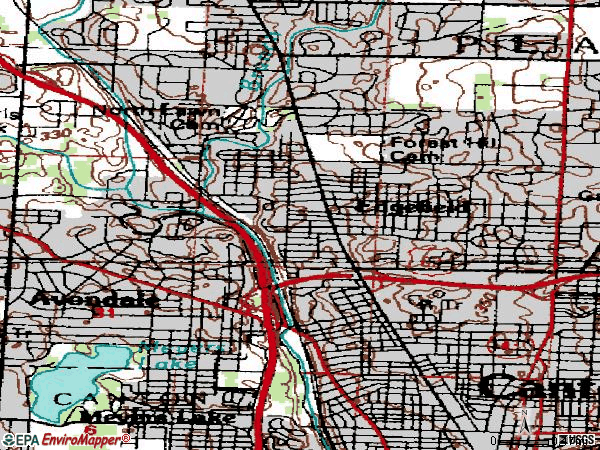

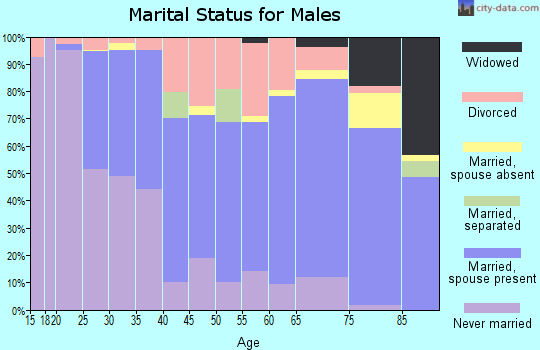
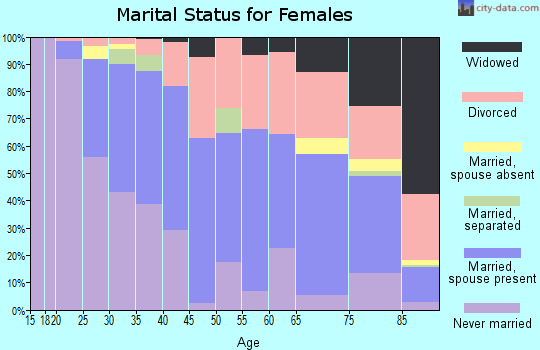
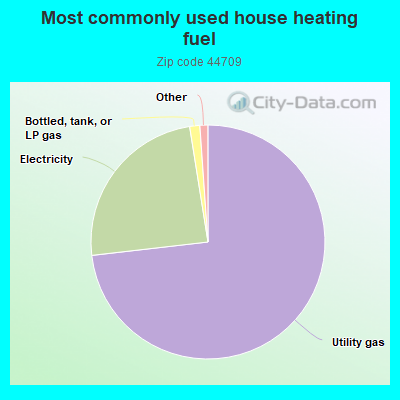
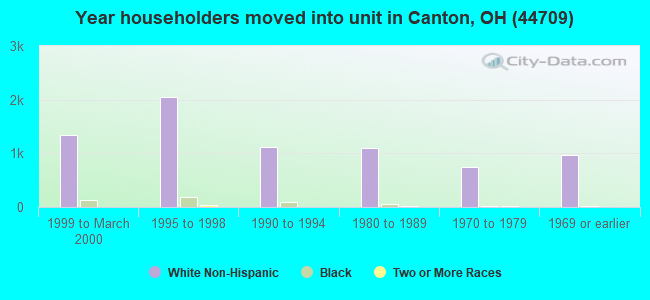
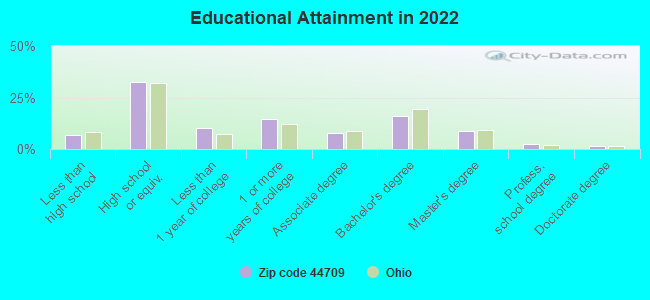
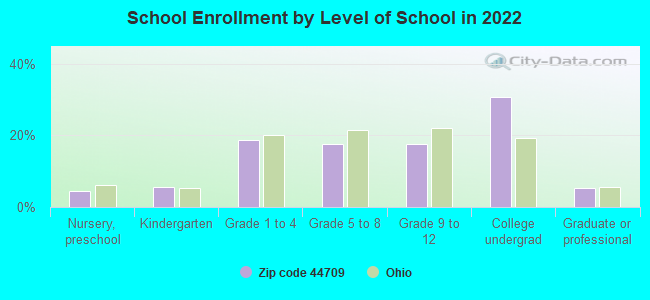
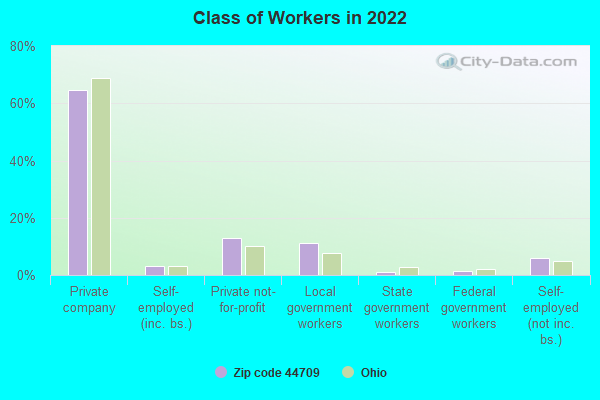
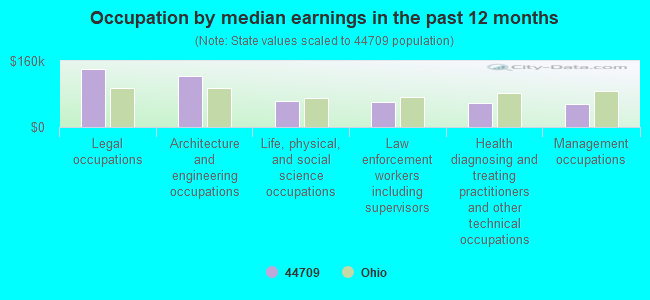
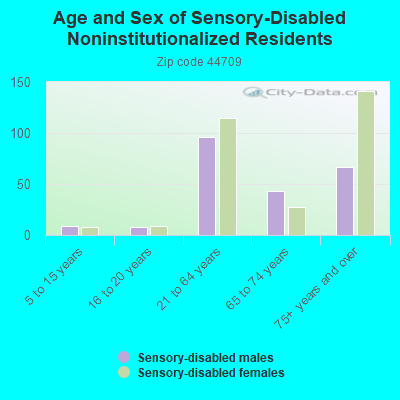
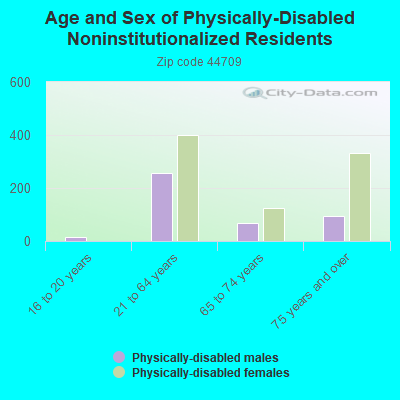
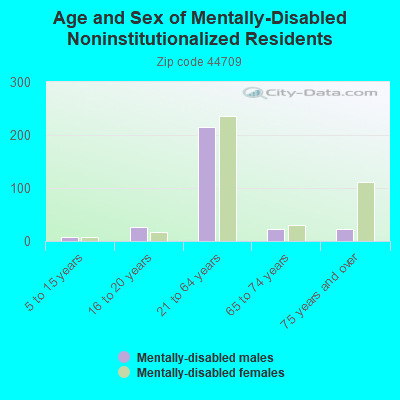
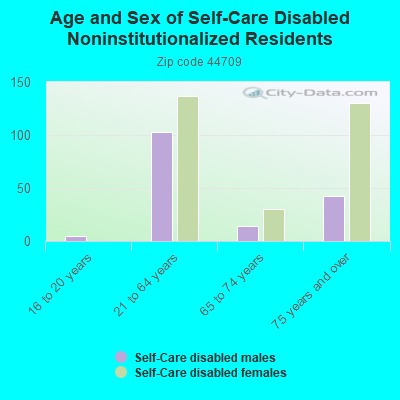
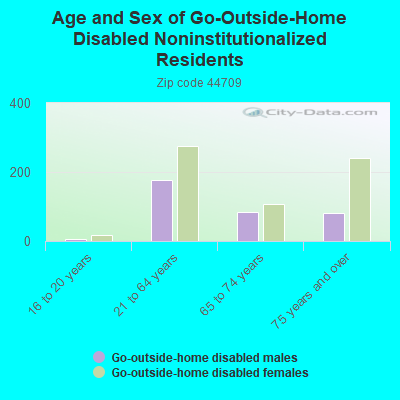
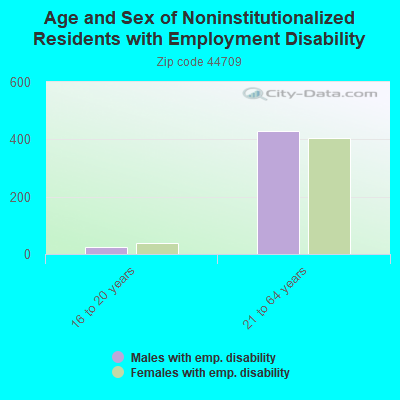
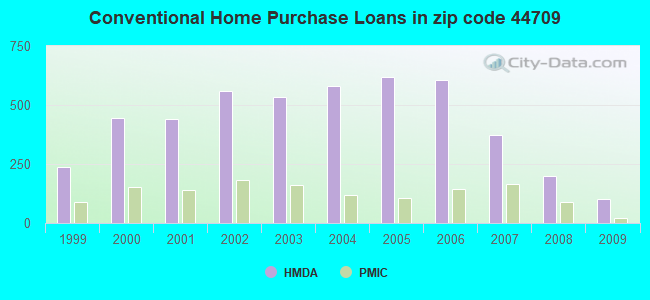
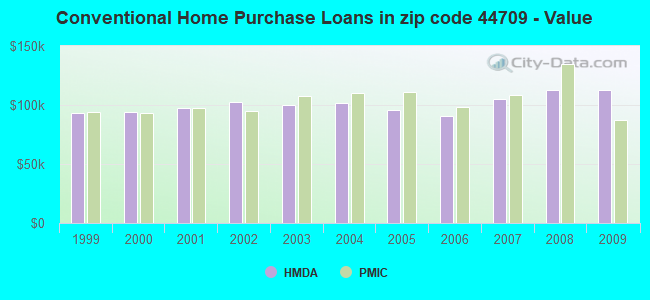
 Based on the data from the years 2002 - 2018 the average number of fires per year is 41. The highest number of reported fires - 59 took place in 2011, and the least - 10 in 2002. The data has an increasing trend.
 When looking into fire subcategories, the most incidents belonged to: Structure Fires (43.8%), and Outside Fires (28.6%).