Estimated zip code population in 2022: 2,377 Zip code population in 2010: 2,909 Zip code population in 2000: 2,958
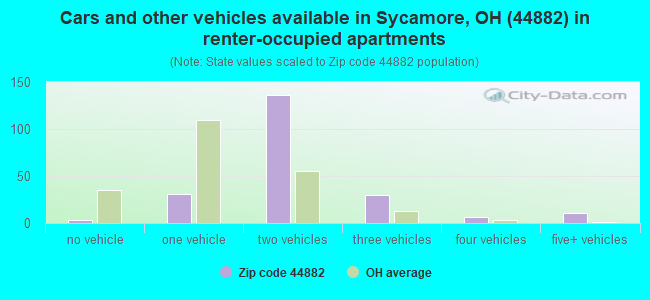
Houses and condos: 1,182 Renter-occupied apartments: 222
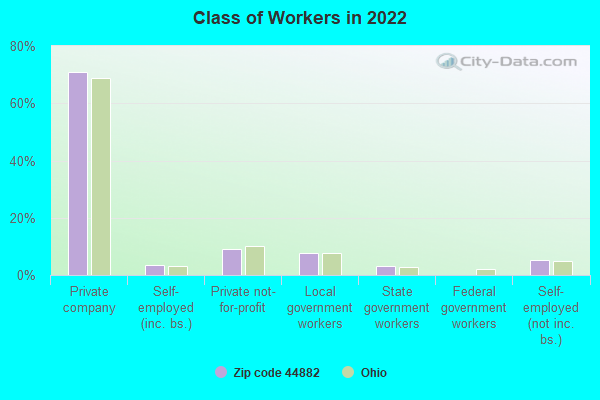
% of renters here:
21%
State:
33%
March 2022 cost of living index in zip code 44882: 82.2 (low, U.S. average is 100)
Land area: 73.4 sq. mi. Water area: 0.0 sq. mi.
Population density: 32 people per square mile
(very low).
OSM Map
General Map
Google Map
MSN Map
OSM Map
General Map
Google Map
MSN Map
OSM Map
General Map
Google Map
MSN Map
OSM Map
General Map
Google Map
MSN Map
Please wait while loading the map...
Real estate property taxes paid for housing units in 2022:
This zip code:
0.8% ($1,346)
Ohio:
1.3% ($2,639)
Median real estate property taxes paid for housing units with mortgages in 2022: $1,661 (0.9%) Median real estate property taxes paid for housing units with no mortgage in 2022: $1,202 (0.9%)
Business Search- 14 Million verified businesses
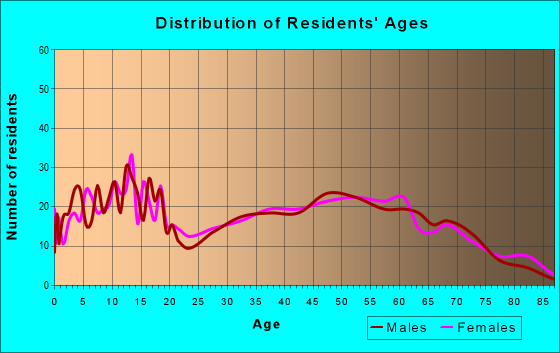
Males: 1,205
(50.7%)
Females: 1,172
(49.3%)
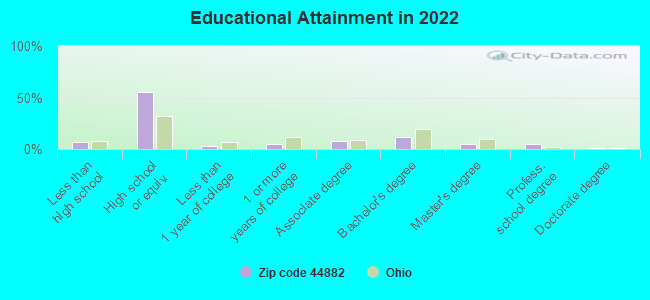
For population 25 years and over in 44882:
High school or higher: 92.0%
Bachelor's degree or higher: 22.1%
Graduate or professional degree: 10.5%
Unemployed: 2.0%
Mean travel time to work (commute): 30.3 minutes
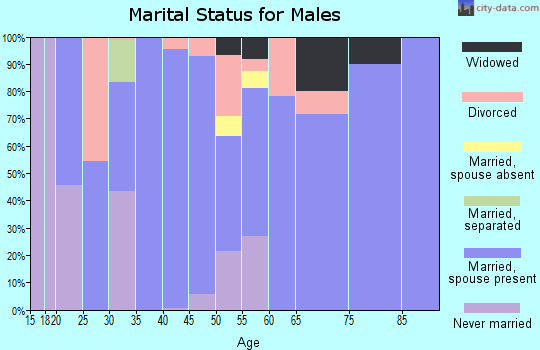
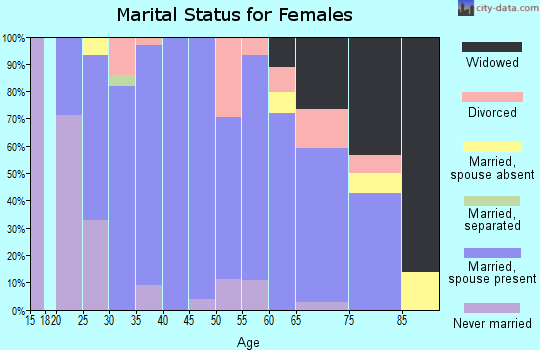
For population 15 years and over in 44882:
Never married: 20.5%
Now married: 63.8%
Separated: 1.6%
Widowed: 6.7%
Divorced: 7.4%
Zip code 44882 compared to state average:
Unemployed percentage below state average.
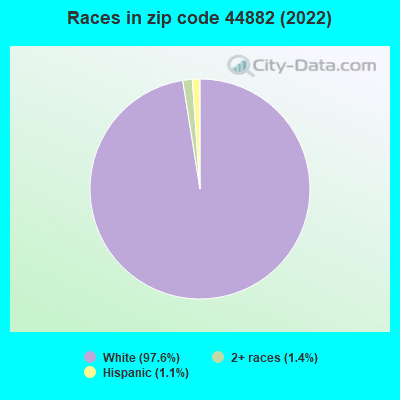
Black race population percentage significantly below state average.
Hispanic race population percentage significantly below state average.
Median age significantly above state average.
Foreign-born population percentage significantly below state average.
Renting percentage below state average.
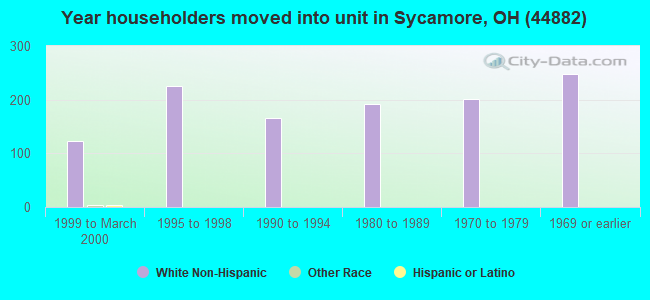
Length of stay since moving in significantly above state average.
Number of college students significantly below state average.
Estimated median house/condo value in 2022: $158,559
44882:
$158,559
Ohio:
$204,100
According to our research of Ohio and other state lists, there were 6 registered sex offenders living in 44882 zip code as of April 26, 2024. The ratio of all residents to sex offenders in zip code 44882 is 512 to 1. The ratio of registered sex offenders to all residents in this zip code is near the state average.
Median resident age:
This zip code:
48.9 years
Ohio median age:
39.9 years
Average household size:
This zip code:
2.2 people
Ohio:
2.4 people
Averages for the 2020 tax year for zip code 44882, filed in 2021:
Average Adjusted Gross Income (AGI) in 2020: $53,144 (Individual Income Tax Returns)
Here:
$53,144
State:
$67,288
Salary/wage: $46,331 (reported on 81.5% of returns)
Here:
$46,331
State:
$55,628
(% of AGI for various income ranges: 1101.9% for AGIs below $25k, 3758.0% for AGIs $25k-50k, 6130.0% for AGIs $50k-75k, 10016.7% for AGIs $75k-100k, 17155.6% for AGIs $100k-200k)
Taxable interest for individuals: $960 (reported on 29.6% of returns)
This zip code:
$960
Ohio:
$1,518
(% of AGI for various income ranges: 27.0% for AGIs below $25k, 28.0% for AGIs $25k-50k, 52.0% for AGIs $50k-75k, 35.6% for AGIs $75k-100k, 101.1% for AGIs $100k-200k)
Ordinary dividends: $2,146 (reported on 20.7% of returns)
Here:
$2,146
State:
$7,167
(% of AGI for various income ranges: 18.5% for AGIs below $25k, 37.0% for AGIs $25k-50k, 94.0% for AGIs $50k-75k, 47.8% for AGIs $75k-100k, 232.2% for AGIs $100k-200k)
Net capital gain/loss in AGI: +$4,119 (reported on 15.6% of returns)
Here:
+$4,119
State:
+$18,919
(% of AGI for various income ranges: 3.7% for AGIs $25k-50k, 123.0% for AGIs $50k-75k, 136.7% for AGIs $75k-100k, 538.9% for AGIs $100k-200k)
Profit/loss from business: +$8,316 (reported on 14.1% of returns)
Here:
+$8,316
State:
+$13,744
(% of AGI for various income ranges: 83.0% for AGIs below $25k, 139.0% for AGIs $25k-50k, 155.5% for AGIs $50k-75k, 697.8% for AGIs $100k-200k)
Taxable individual retirement arrangement distribution: $12,881 (reported on 11.9% of returns)
44882:
$12,881
Ohio:
$18,876
(% of AGI for various income ranges: 97.0% for AGIs below $25k, 122.0% for AGIs $25k-50k, 267.5% for AGIs $50k-75k, 997.8% for AGIs $75k-100k)
Earned income credit: $1,973 (reported on 11.1% of returns)
Here:
$1,973
State:
$2,304
(% of AGI for various income ranges: 70.4% for AGIs below $25k, 35.3% for AGIs $25k-50k)
Percentage of individuals using paid preparers for their 2020 taxes: 95.6%
Here:
96%
State:
94%
(% for various income ranges: 94.7% for AGIs below $25k, 94.9% for AGIs $25k-50k, 96.4% for AGIs $50k-75k, 100.0% for AGIs $75k-100k, 93.8% for AGIs $100k-200k)
Averages for the 2012 tax year for zip code 44882, filed in 2013:
Average Adjusted Gross Income (AGI) in 2012: $44,930 (Individual Income Tax Returns)
Here:
$44,930
State:
$54,926
Salary/wage: $37,575 (reported on 85.5% of returns)
Here:
$37,575
State:
$45,869
(% of AGI for various income ranges: 72.5% for AGIs below $25k, 82.2% for AGIs $25k-50k, 77.5% for AGIs $50k-75k, 74.4% for AGIs $75k-100k, 53.2% for AGIs $100k-200k)
Taxable interest for individuals: $722 (reported on 33.3% of returns)
This zip code:
$722
Ohio:
$1,297
(% of AGI for various income ranges: 0.7% for AGIs below $25k, 0.7% for AGIs $25k-50k, 0.4% for AGIs $50k-75k, 0.7% for AGIs $75k-100k, 0.3% for AGIs $100k-200k)
Ordinary dividends: $1,661 (reported on 20.3% of returns)
Here:
$1,661
State:
$5,821
(% of AGI for various income ranges: 0.9% for AGIs below $25k, 0.5% for AGIs $25k-50k, 0.8% for AGIs $50k-75k, 0.6% for AGIs $75k-100k, 0.9% for AGIs $100k-200k)
Net capital gain/loss in AGI: +$6,973 (reported on 10.9% of returns)
Here:
+$6,973
State:
+$11,232
(% of AGI for various income ranges: 0.5% for AGIs $50k-75k, 0.4% for AGIs $75k-100k, 6.2% for AGIs $100k-200k)
Profit/loss from business: +$8,065 (reported on 12.3% of returns)
Here:
+$8,065
State:
+$12,773
(% of AGI for various income ranges: 3.9% for AGIs below $25k, 0.7% for AGIs $25k-50k, 1.7% for AGIs $50k-75k, 3.3% for AGIs $75k-100k, 2.7% for AGIs $100k-200k)
Taxable individual retirement arrangement distribution: $13,677 (reported on 9.4% of returns)
44882:
$13,677
Ohio:
$14,511
(% of AGI for various income ranges: 2.0% for AGIs below $25k, 2.1% for AGIs $25k-50k, 1.9% for AGIs $50k-75k, 9.5% for AGIs $75k-100k)
Total itemized deductions: $16,621 (21% of AGI, reported on 17.4% of returns)
Here:
$16,621
State:
$21,278
Here:
21.2% of AGI
State:
18.8% of AGI
(% of AGI for various income ranges: 5.8% for AGIs below $25k, 4.5% for AGIs $25k-50k, 6.6% for AGIs $50k-75k, 7.9% for AGIs $75k-100k, 7.3% for AGIs $100k-200k)
Charity contributions: $2,427 (reported on 10.9% of returns)
Here:
$2,427
State:
$3,943
(% of AGI for various income ranges: 0.4% for AGIs $25k-50k, 0.8% for AGIs $50k-75k, 0.7% for AGIs $75k-100k, 0.8% for AGIs $100k-200k)
Taxes paid: $5,624 (reported on 18.1% of returns)
44882:
$5,624
State:
$9,568
(% of AGI for various income ranges: 1.2% for AGIs below $25k, 1.0% for AGIs $25k-50k, 1.9% for AGIs $50k-75k, 2.6% for AGIs $75k-100k, 4.1% for AGIs $100k-200k)
Earned income credit: $2,118 (reported on 15.9% of returns)
Here:
$2,118
State:
$2,285
(% of AGI for various income ranges: 4.4% for AGIs below $25k, 1.2% for AGIs $25k-50k)
Percentage of individuals using paid preparers for their 2012 taxes: 60.9%
Here:
61%
State:
51%
(% for various income ranges: 52.9% for AGIs below $25k, 64.3% for AGIs $25k-50k, 63.6% for AGIs $50k-75k, 69.2% for AGIs $75k-100k, 70.0% for AGIs $100k-200k)
Averages for the 2004 tax year for zip code 44882, filed in 2005:
Average Adjusted Gross Income (AGI) in 2004: $35,270 (Individual Income Tax Returns)
Here:
$35,270
State:
$44,480
Salary/wage: $33,019 (reported on 86.7% of returns)
Here:
$33,019
State:
$39,198
(% of AGI for various income ranges: 106.9% for AGIs below $10k, 77.9% for AGIs $10k-25k, 84.8% for AGIs $25k-50k, 85.1% for AGIs $50k-75k, 86.2% for AGIs $75k-100k, 55.3% for AGIs over 100k)
Taxable interest for individuals: $875 (reported on 43.7% of returns)
This zip code:
$875
Ohio:
$1,532
(% of AGI for various income ranges: 7.2% for AGIs below $10k, 1.9% for AGIs $10k-25k, 1.2% for AGIs $25k-50k, 0.9% for AGIs $50k-75k, 0.2% for AGIs $75k-100k, 0.3% for AGIs over 100k)
Taxable dividends: $1,593 (reported on 24.0% of returns)
Here:
$1,593
State:
$3,496
(% of AGI for various income ranges: 5.8% for AGIs below $10k, 1.0% for AGIs $10k-25k, 0.5% for AGIs $25k-50k, 0.2% for AGIs $50k-75k, 0.4% for AGIs $75k-100k, 5.0% for AGIs over 100k)
Net capital gain/loss: +$3,858 (reported on 13.8% of returns)
Here:
+$3,858
State:
+$8,582
(% of AGI for various income ranges: 0.7% for AGIs below $10k, 0.1% for AGIs $10k-25k, 0.4% for AGIs $25k-50k, 2.2% for AGIs $50k-75k, 0.0% for AGIs $75k-100k, 6.7% for AGIs over 100k)
Profit/loss from business: +$6,990 (reported on 13.0% of returns)
Here:
+$6,990
State:
+$10,813
(% of AGI for various income ranges: 9.5% for AGIs below $10k, 3.5% for AGIs $10k-25k, 2.4% for AGIs $25k-50k, 0.9% for AGIs $50k-75k, 4.0% for AGIs $75k-100k, 3.5% for AGIs over 100k)
Profit/loss from farming: +$1,963 (reported on 7.4% of returns)
Here:
+$1,963
State:
-$3,706
(% of AGI for various income ranges: -9.1% for AGIs below $10k, 2.2% for AGIs $10k-25k, -0.3% for AGIs $25k-50k, 1.2% for AGIs $50k-75k, 0.9% for AGIs $75k-100k)
IRA payment deduction: $2,548 (reported on 2.1% of returns)
44882:
$2,548
Ohio:
$2,794
Total itemized deductions: $13,454 (21% of AGI, reported on 20.0% of returns)
Here:
$13,454
State:
$17,503
Here:
21.3% of AGI
State:
20.8% of AGI
(% of AGI for various income ranges: 4.3% for AGIs $10k-25k, 5.3% for AGIs $25k-50k, 10.2% for AGIs $50k-75k, 10.3% for AGIs $75k-100k, 11.1% for AGIs over 100k)
Charity contributions deductions: $2,072 (3% of AGI, reported on 13.1% of returns)
Here:
$2,072
State:
$3,087
Here:
2.9% of AGI
State:
3.4% of AGI
(% of AGI for various income ranges: 0.5% for AGIs $10k-25k, 0.5% for AGIs $25k-50k, 0.8% for AGIs $50k-75k, 1.2% for AGIs $75k-100k, 1.6% for AGIs over 100k)
Total tax: $4,043 (reported on 77.8% of returns)
44882:
$4,043
State:
$6,781
(% of AGI for various income ranges: 3.6% for AGIs below $10k, 4.3% for AGIs $10k-25k, 7.2% for AGIs $25k-50k, 8.5% for AGIs $50k-75k, 10.5% for AGIs $75k-100k, 19.5% for AGIs over 100k)
Earned income credit: $1,626 (reported on 11.8% of returns)
Here:
$1,626
State:
$1,696
Percentage of individuals using paid preparers for their 2004 taxes: 59.8%
Here:
60%
State:
55%
(% for various income ranges: 53.3% for AGIs below $10k, 58.3% for AGIs $10k-25k, 63.9% for AGIs $25k-50k, 60.6% for AGIs $50k-75k, 58.1% for AGIs $75k-100k, 55.9% for AGIs over 100k)
Household received Food Stamps/SNAP in the past 12 months: 78 Household did not receive Food Stamps/SNAP in the past 12 months: 993
Women who had a birth in the past 12 months: 5 (2 now married, 3 unmarried) Women who did not have a birth in the past 12 months: 431 (256 now married, 174 unmarried)
Housing units in zip code 44882 with a mortgage: 444 (40 second mortgage, 23 both second mortgage and home equity loan) Median monthly owner costs for units with a mortgage: $1,293 Median monthly owner costs for units without a mortgage: $415
Residents with income below the poverty level in 2022:
This zip code:
4.2%
Whole state:
13.4%
Residents with income below 50% of the poverty level in 2022:
This zip code:
3.1%
Whole state:
7.0%
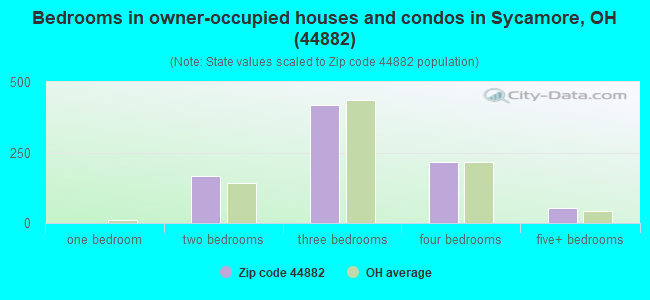
Median number of rooms in houses and condos:
Here:
7.1
State:
6.7
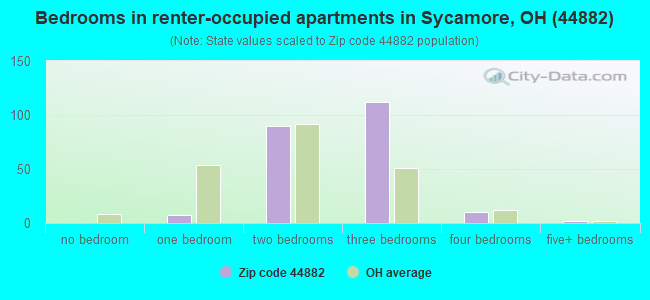
Median number of rooms in apartments:
Here:
5.6
State:
4.4
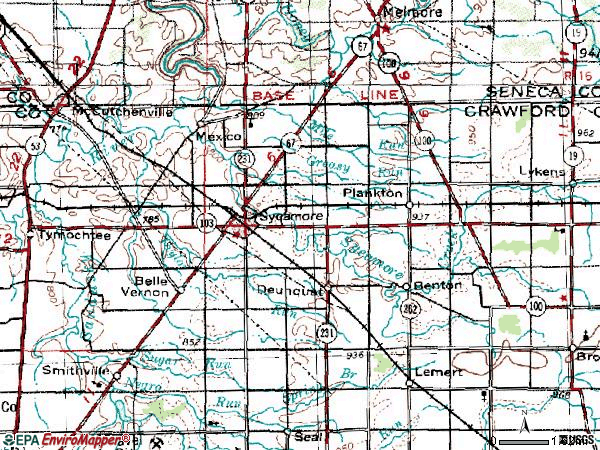
Notable locations in this zip code not listed on our city pages
Churches in zip code 44882 include: Mount Zion Church (A), Olive Branch Church (B), Pleasant Home Church (C), Saint Pius Catholic Church (D), Duenquat Lutheran Church (E). Display/hide their locations on the map
Cemeteries: Seery Cemetery (1), Bibler Cemetery (2), Brundedge Cemetery (3), Eden Cemetery (4), Old Sycamore Cemetery (5), Mexico Cemetery (6), Curlis Cemetery (7). Display/hide their locations on the map
Streams, rivers, and creeks: Greasy Run (A), North Branch Spring Branch (B), South Branch Spring Branch (C), Taylor Run (D), Tymochtee Creek (E), Sycamore Creek (F). Display/hide their locations on the map
In group quarters: 2 (-1 institutionalized population)
Size of family households: 436 2-persons, 225 3-persons, 115 4-persons, 26 5-persons, 4 6-persons
Size of nonfamily households: 211 1-person, 50 2-persons, 2 3-persons
223 married couples with children.
164 single-parent households (122 men, 42 women).
98.1% of residents of 44882 zip code speak English at home.
0.4% of residents speak Spanish at home (100% very well).
1.6% of residents speak other Indo-European language at home (100% very well).
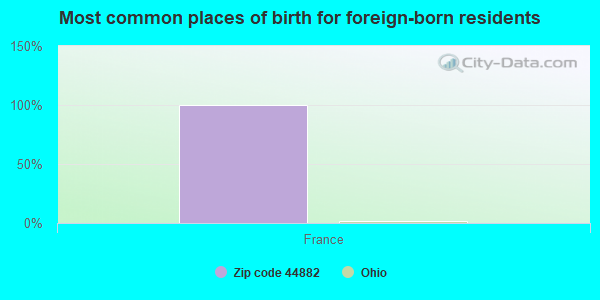
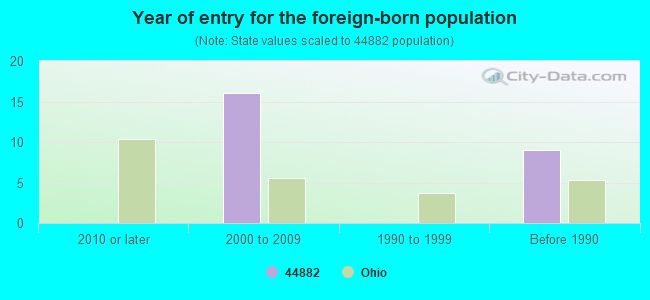
Foreign born population: 10 (0.4%) (100.0% of them are naturalized citizens)
This zip code:
0.4%
Whole state:
5.0%
100%France
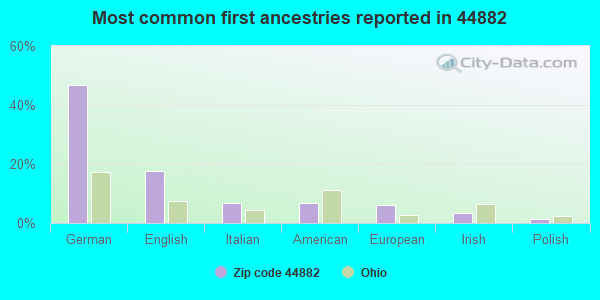
47%German
18%English
7%Italian
7%American
6%European
3%Irish
1%Polish
Year of entry for the foreign-born population
02010 or later
162000 to 2009
01990 to 1999
9Before 1990
Housing units lacking complete plumbing facilities: 4.6% Housing units lacking complete kitchen facilities: 2.1%
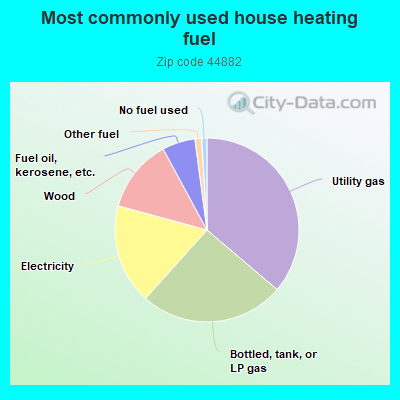
36.3%Utility gas
25.5%Bottled, tank, or LP gas
17.6%Electricity
12.9%Wood
5.8%Fuel oil, kerosene, etc.
1.2%Other fuel
0.9%No fuel used
Population in 1990: 2,610. Population change in the 1990s: +348 (+13.3%).
Place of birth for U.S.-born residents:
This state: 2,085
Northeast: 14
Midwest: 78
South: 116
West: 52
67% of the 44882 zip code residents lived in the same house 5 years ago. Out of people who lived in different houses, 56% lived in this county. Out of people who lived in different counties, 50% lived in Ohio.
95% of the 44882 zip code residents lived in the same house 1 year ago. Out of people who lived in different houses, 11% moved from this county. Out of people who lived in different houses, 102% moved from different county within same state.
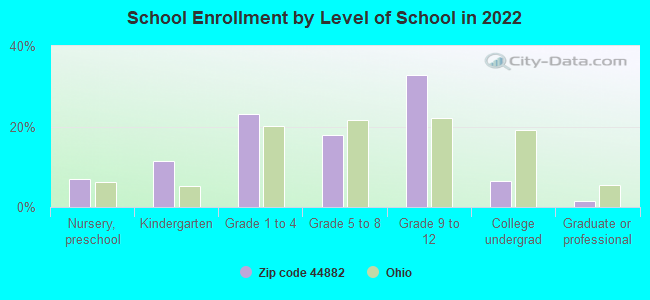
Private vs. public school enrollment:
Students in private schools in grades 1 to 8 (elementary and middle school): 2
Here:
1.3%
Ohio:
16.0%
Students in private schools in grades 9 to 12 (high school): 23
Here:
16.8%
Ohio:
13.1%
Students in private undergraduate colleges:
Here:
0.0%
Ohio:
22.3%
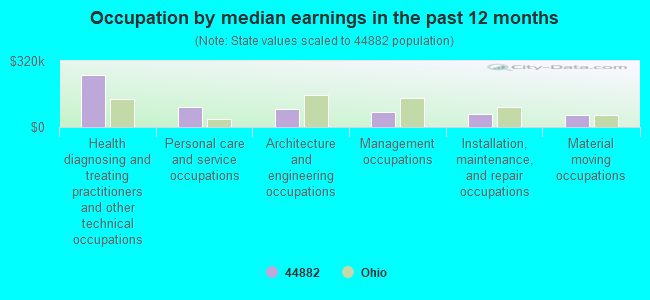
Occupation by median earnings in the past 12 months ($)
251,562Health diagnosing and treating practitioners and other technical occupations
97,227Personal care and service occupations
85,798Architecture and engineering occupations
70,862Management occupations
62,222Installation, maintenance, and repair occupations
57,739Material moving occupations
Top industries in this zip code by the number of employees in 2005:
Finance and Insurance: Commercial Banking (20-49 employees: 1 establishment)
Administrative and Support and Waste Management and Remediation Services: Landscaping Services (10-19: 1, 1-4: 1)
Accommodation and Food Services: Limited-Service Restaurants (10-19: 1)
Health Care and Social Assistance: Offices of Physicians (except Mental Health Specialists) (10-19: 1)
Information: Internet Service Providers (10-19: 1)
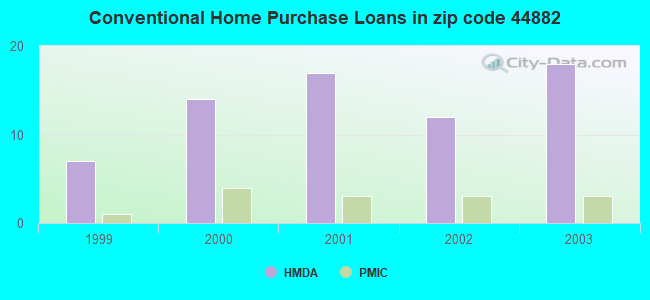
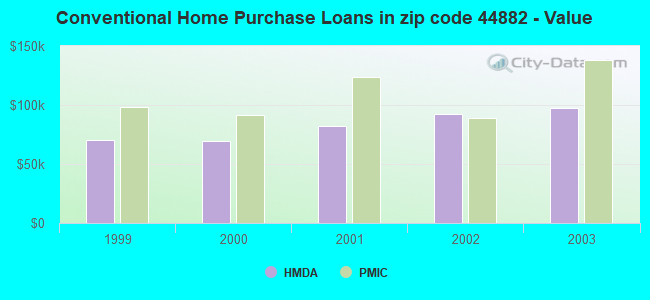
Detailed PMIC statistics for the following Tracts:9742.00
2002 - 2018 National Fire Incident Reporting System (NFIRS) incidents
According to the data from the years 2002 - 2018 the average number of fires per year is 14. The highest number of fire incidents - 38 took place in 2016, and the least - 1 in 2004. The data has a growing trend.
When looking into fire subcategories, the most incidents belonged to: Structure Fires (42.7%), and Outside Fires (42.7%).
Fire incident types reported to NFIRS in Zip Code 44882


+$1,963
-$3,706
(% of AGI for various income ranges: -9.1% for AGIs below $10k, 2.2% for AGIs $10k-25k, -0.3% for AGIs $25k-50k, 1.2% for AGIs $50k-75k, 0.9% for AGIs $75k-100k)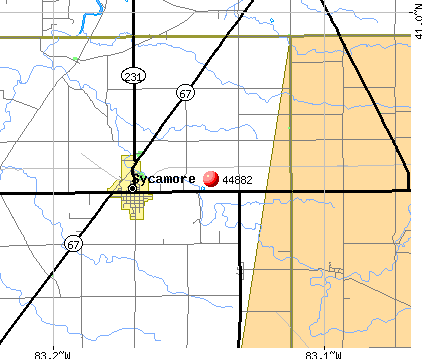 Nearest zip codes: 44844, 44849, 44818, 44883, 44853, 44825.
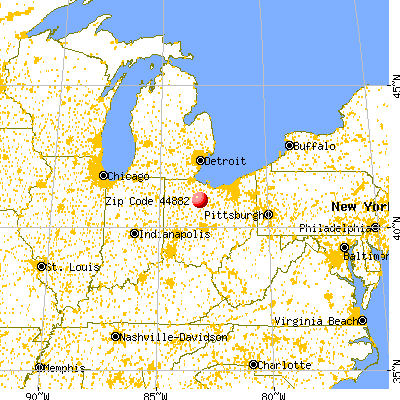
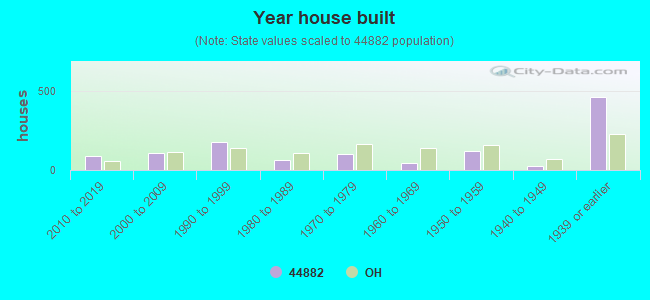


 According to the data from the years 2002 - 2018 the average number of fires per year is 14. The highest number of fire incidents - 38 took place in 2016, and the least - 1 in 2004. The data has a growing trend.
 When looking into fire subcategories, the most incidents belonged to: Structure Fires (42.7%), and Outside Fires (42.7%).