Estimated zip code population in 2022: 14,045 Zip code population in 2010: 13,388 Zip code population in 2000: 11,930
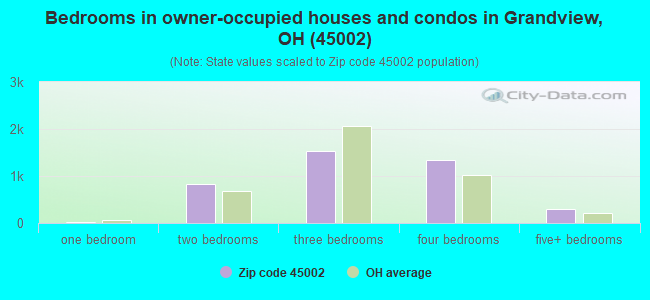
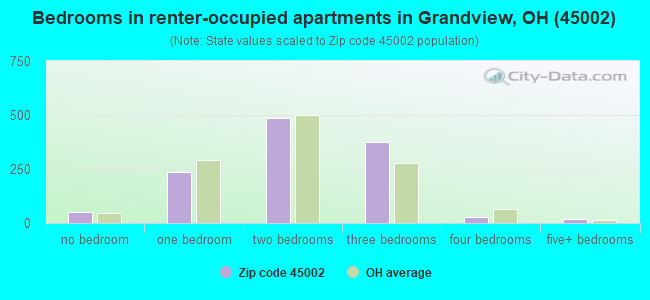
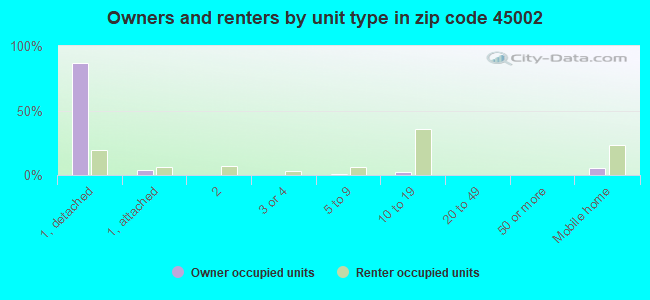
Houses and condos: 5,617 Renter-occupied apartments: 1,198
% of renters here:
23%
State:
33%
March 2022 cost of living index in zip code 45002: 88.7 (less than average, U.S. average is 100)
Land area: 25.4 sq. mi. Water area: 0.8 sq. mi.
Population density: 553 people per square mile
(low).
OSM Map
General Map
Google Map
MSN Map
OSM Map
General Map
Google Map
MSN Map
OSM Map
General Map
Google Map
MSN Map
OSM Map
General Map
Google Map
MSN Map
Please wait while loading the map...
Real estate property taxes paid for housing units in 2022:
This zip code:
1.5% ($4,396)
Ohio:
1.3% ($2,639)
Median real estate property taxes paid for housing units with mortgages in 2022: $4,448 (1.4%) Median real estate property taxes paid for housing units with no mortgage in 2022: $4,349 (1.7%)
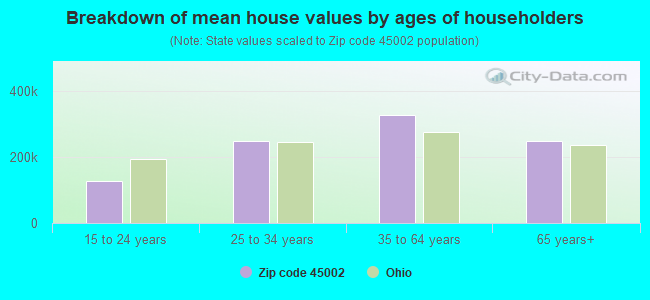
Estimated median house/condo value in 2022: $296,407
45002:
$296,407
Ohio:
$204,100
According to our research of Ohio and other state lists, there were 12 registered sex offenders living in 45002 zip code as of April 27, 2024. The ratio of all residents to sex offenders in zip code 45002 is 1,159 to 1. The ratio of registered sex offenders to all residents in this zip code is lower than the state average.
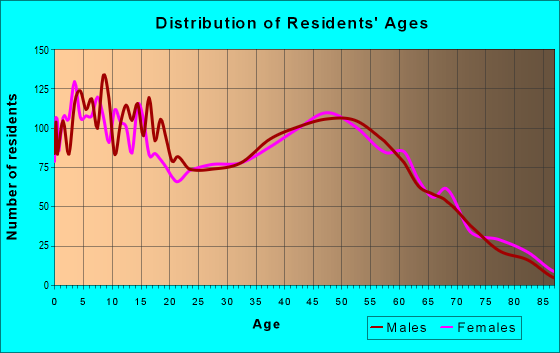
Median resident age:
This zip code:
36.8 years
Ohio median age:
39.9 years
Average household size:
This zip code:
2.7 people
Ohio:
2.4 people
Averages for the 2020 tax year for zip code 45002, filed in 2021:
Average Adjusted Gross Income (AGI) in 2020: $82,041 (Individual Income Tax Returns)
Here:
$82,041
State:
$67,288
Salary/wage: $68,651 (reported on 84.8% of returns)
Here:
$68,651
State:
$55,628
(% of AGI for various income ranges: 1264.0% for AGIs below $25k, 3612.6% for AGIs $25k-50k, 6102.8% for AGIs $50k-75k, 9521.6% for AGIs $75k-100k, 18061.5% for AGIs $100k-200k, 72738.9% for AGIs over 200k)
Taxable interest for individuals: $1,506 (reported on 31.1% of returns)
This zip code:
$1,506
Ohio:
$1,518
(% of AGI for various income ranges: 13.2% for AGIs below $25k, 16.3% for AGIs $25k-50k, 25.7% for AGIs $50k-75k, 64.7% for AGIs $75k-100k, 87.9% for AGIs $100k-200k, 1042.2% for AGIs over 200k)
Ordinary dividends: $6,782 (reported on 28.3% of returns)
Here:
$6,782
State:
$7,167
(% of AGI for various income ranges: 28.1% for AGIs below $25k, 51.2% for AGIs $25k-50k, 125.4% for AGIs $50k-75k, 217.0% for AGIs $75k-100k, 474.0% for AGIs $100k-200k, 4103.3% for AGIs over 200k)
Net capital gain/loss in AGI: +$16,957 (reported on 20.9% of returns)
Here:
+$16,957
State:
+$18,919
(% of AGI for various income ranges: 13.3% for AGIs below $25k, 25.0% for AGIs $25k-50k, 109.5% for AGIs $50k-75k, 181.4% for AGIs $75k-100k, 580.9% for AGIs $100k-200k, 10770.0% for AGIs over 200k)
Profit/loss from business: +$16,553 (reported on 12.8% of returns)
Here:
+$16,553
State:
+$13,744
(% of AGI for various income ranges: 79.4% for AGIs below $25k, 109.1% for AGIs $25k-50k, 207.2% for AGIs $50k-75k, 380.0% for AGIs $75k-100k, 636.6% for AGIs $100k-200k, 2607.2% for AGIs over 200k)
Taxable individual retirement arrangement distribution: $24,202 (reported on 11.5% of returns)
45002:
$24,202
Ohio:
$18,876
(% of AGI for various income ranges: 56.4% for AGIs below $25k, 132.3% for AGIs $25k-50k, 299.7% for AGIs $50k-75k, 544.7% for AGIs $75k-100k, 1025.2% for AGIs $100k-200k, 2775.0% for AGIs over 200k)
Self-employed (Keogh) retirement plans: $16,380 (reported on 0.7% of returns)
45002:
$16,380
Ohio:
$24,898
(% of AGI for various income ranges: 88.4% for AGIs $75k-100k, 243.9% for AGIs over 200k)
Total itemized deductions: $32,998 (reported on 6.6% of returns)
Here:
$32,998
State:
$33,869
(% of AGI for various income ranges: 96.3% for AGIs $25k-50k, 184.9% for AGIs $50k-75k, 302.6% for AGIs $75k-100k, 536.1% for AGIs $100k-200k, 4352.2% for AGIs over 200k)
Charity contributions: $13,261 (reported on 5.5% of returns)
Here:
$13,261
State:
$14,577
(% of AGI for various income ranges: 9.0% for AGIs $25k-50k, 29.2% for AGIs $50k-75k, 48.4% for AGIs $75k-100k, 129.6% for AGIs $100k-200k, 2127.2% for AGIs over 200k)
Taxes paid: $7,998 (reported on 6.6% of returns)
45002:
$7,998
State:
$7,681
(% of AGI for various income ranges: 11.4% for AGIs $25k-50k, 43.9% for AGIs $50k-75k, 100.2% for AGIs $75k-100k, 165.0% for AGIs $100k-200k, 919.4% for AGIs over 200k)
Earned income credit: $2,452 (reported on 12.3% of returns)
Here:
$2,452
State:
$2,304
(% of AGI for various income ranges: 96.0% for AGIs below $25k, 60.3% for AGIs $25k-50k)
Percentage of individuals using paid preparers for their 2020 taxes: 93.0%
Here:
93%
State:
94%
(% for various income ranges: 92.0% for AGIs below $25k, 93.9% for AGIs $25k-50k, 93.2% for AGIs $50k-75k, 92.5% for AGIs $75k-100k, 93.0% for AGIs $100k-200k, 94.4% for AGIs over 200k)
Averages for the 2012 tax year for zip code 45002, filed in 2013:
Average Adjusted Gross Income (AGI) in 2012: $64,428 (Individual Income Tax Returns)
Here:
$64,428
State:
$54,926
Salary/wage: $53,469 (reported on 86.5% of returns)
Here:
$53,469
State:
$45,869
(% of AGI for various income ranges: 76.3% for AGIs below $25k, 78.5% for AGIs $25k-50k, 73.9% for AGIs $50k-75k, 73.5% for AGIs $75k-100k, 79.4% for AGIs $100k-200k, 56.0% for AGIs over 200k)
Taxable interest for individuals: $1,601 (reported on 33.8% of returns)
This zip code:
$1,601
Ohio:
$1,297
(% of AGI for various income ranges: 0.7% for AGIs below $25k, 0.4% for AGIs $25k-50k, 0.6% for AGIs $50k-75k, 0.4% for AGIs $75k-100k, 0.3% for AGIs $100k-200k, 2.1% for AGIs over 200k)
Ordinary dividends: $4,294 (reported on 28.5% of returns)
Here:
$4,294
State:
$5,821
(% of AGI for various income ranges: 1.1% for AGIs below $25k, 1.0% for AGIs $25k-50k, 1.4% for AGIs $50k-75k, 1.9% for AGIs $75k-100k, 2.0% for AGIs $100k-200k, 2.7% for AGIs over 200k)
Net capital gain/loss in AGI: +$8,444 (reported on 18.5% of returns)
Here:
+$8,444
State:
+$11,232
(% of AGI for various income ranges: 0.2% for AGIs below $25k, 0.3% for AGIs $25k-50k, 0.5% for AGIs $50k-75k, 1.0% for AGIs $75k-100k, 1.3% for AGIs $100k-200k, 7.3% for AGIs over 200k)
Profit/loss from business: +$17,427 (reported on 12.4% of returns)
Here:
+$17,427
State:
+$12,773
(% of AGI for various income ranges: 6.6% for AGIs below $25k, 2.4% for AGIs $25k-50k, 2.2% for AGIs $50k-75k, 2.9% for AGIs $75k-100k, 2.7% for AGIs $100k-200k, 4.7% for AGIs over 200k)
Taxable individual retirement arrangement distribution: $16,863 (reported on 11.3% of returns)
45002:
$16,863
Ohio:
$14,511
(% of AGI for various income ranges: 4.1% for AGIs below $25k, 3.0% for AGIs $25k-50k, 3.5% for AGIs $50k-75k, 3.5% for AGIs $75k-100k, 3.6% for AGIs $100k-200k, 1.2% for AGIs over 200k)
Self-employment retirement plans: $14,350 (reported on 0.6% of returns)
45002:
$14,350
Ohio:
$20,257
(% of AGI for various income ranges: 0.5% for AGIs $100k-200k)
Total itemized deductions: $21,108 (18% of AGI, reported on 38.5% of returns)
Here:
$21,108
State:
$21,278
Here:
17.6% of AGI
State:
18.8% of AGI
(% of AGI for various income ranges: 6.8% for AGIs below $25k, 8.4% for AGIs $25k-50k, 12.9% for AGIs $50k-75k, 14.1% for AGIs $75k-100k, 16.0% for AGIs $100k-200k, 11.4% for AGIs over 200k)
Charity contributions: $2,927 (reported on 31.6% of returns)
Here:
$2,927
State:
$3,943
(% of AGI for various income ranges: 0.4% for AGIs below $25k, 0.7% for AGIs $25k-50k, 1.2% for AGIs $50k-75k, 1.5% for AGIs $75k-100k, 1.8% for AGIs $100k-200k, 1.8% for AGIs over 200k)
Taxes paid: $9,600 (reported on 38.3% of returns)
45002:
$9,600
State:
$9,568
(% of AGI for various income ranges: 1.4% for AGIs below $25k, 2.6% for AGIs $25k-50k, 4.9% for AGIs $50k-75k, 5.8% for AGIs $75k-100k, 7.6% for AGIs $100k-200k, 6.5% for AGIs over 200k)
Earned income credit: $2,298 (reported on 14.7% of returns)
Here:
$2,298
State:
$2,285
(% of AGI for various income ranges: 6.3% for AGIs below $25k, 0.9% for AGIs $25k-50k)
Percentage of individuals using paid preparers for their 2012 taxes: 49.9%
Here:
50%
State:
51%
(% for various income ranges: 43.0% for AGIs below $25k, 49.6% for AGIs $25k-50k, 58.4% for AGIs $50k-75k, 55.7% for AGIs $75k-100k, 50.0% for AGIs $100k-200k, 69.6% for AGIs over 200k)
Averages for the 2004 tax year for zip code 45002, filed in 2005:
Average Adjusted Gross Income (AGI) in 2004: $48,751 (Individual Income Tax Returns)
Here:
$48,751
State:
$44,480
Salary/wage: $43,499 (reported on 88.8% of returns)
Here:
$43,499
State:
$39,198
(% of AGI for various income ranges: 99.4% for AGIs below $10k, 80.7% for AGIs $10k-25k, 84.3% for AGIs $25k-50k, 80.1% for AGIs $50k-75k, 81.7% for AGIs $75k-100k, 73.4% for AGIs over 100k)
Taxable interest for individuals: $1,234 (reported on 43.8% of returns)
This zip code:
$1,234
Ohio:
$1,532
(% of AGI for various income ranges: 2.6% for AGIs below $10k, 1.5% for AGIs $10k-25k, 0.8% for AGIs $25k-50k, 0.9% for AGIs $50k-75k, 0.9% for AGIs $75k-100k, 1.4% for AGIs over 100k)
Taxable dividends: $2,403 (reported on 28.2% of returns)
Here:
$2,403
State:
$3,496
(% of AGI for various income ranges: 1.9% for AGIs below $10k, 1.2% for AGIs $10k-25k, 1.0% for AGIs $25k-50k, 1.3% for AGIs $50k-75k, 1.2% for AGIs $75k-100k, 1.8% for AGIs over 100k)
Net capital gain/loss: +$6,302 (reported on 19.8% of returns)
Here:
+$6,302
State:
+$8,582
(% of AGI for various income ranges: -0.4% for AGIs below $10k, 0.3% for AGIs $10k-25k, 0.3% for AGIs $25k-50k, 1.5% for AGIs $50k-75k, 2.1% for AGIs $75k-100k, 5.3% for AGIs over 100k)
Profit/loss from business: +$10,985 (reported on 12.2% of returns)
Here:
+$10,985
State:
+$10,813
(% of AGI for various income ranges: 3.9% for AGIs below $10k, 4.9% for AGIs $10k-25k, 2.5% for AGIs $25k-50k, 2.1% for AGIs $50k-75k, 2.5% for AGIs $75k-100k, 2.9% for AGIs over 100k)
IRA payment deduction: $3,072 (reported on 2.4% of returns)
45002:
$3,072
Ohio:
$2,794
(% of AGI for various income ranges: 0.3% for AGIs $10k-25k, 0.2% for AGIs $25k-50k, 0.2% for AGIs $50k-75k, 0.1% for AGIs $75k-100k, 0.1% for AGIs over 100k)
Self-employed pension: $8,659 (reported on 0.7% of returns)
Here:
$8,659
Ohio:
$13,981
(% of AGI for various income ranges: 0.2% for AGIs $10k-25k, 0.2% for AGIs $50k-75k, 0.2% for AGIs over 100k)
Total itemized deductions: $18,238 (21% of AGI, reported on 38.6% of returns)
Here:
$18,238
State:
$17,503
Here:
21.1% of AGI
State:
20.8% of AGI
(% of AGI for various income ranges: 3.6% for AGIs below $10k, 6.8% for AGIs $10k-25k, 10.1% for AGIs $25k-50k, 15.5% for AGIs $50k-75k, 17.9% for AGIs $75k-100k, 16.6% for AGIs over 100k)
Charity contributions deductions: $2,381 (3% of AGI, reported on 33.4% of returns)
Here:
$2,381
State:
$3,087
Here:
2.6% of AGI
State:
3.4% of AGI
(% of AGI for various income ranges: 0.4% for AGIs below $10k, 0.5% for AGIs $10k-25k, 0.9% for AGIs $25k-50k, 1.5% for AGIs $50k-75k, 1.8% for AGIs $75k-100k, 2.4% for AGIs over 100k)
Total tax: $6,792 (reported on 79.8% of returns)
45002:
$6,792
State:
$6,781
(% of AGI for various income ranges: 2.6% for AGIs below $10k, 4.6% for AGIs $10k-25k, 7.3% for AGIs $25k-50k, 9.0% for AGIs $50k-75k, 9.5% for AGIs $75k-100k, 17.1% for AGIs over 100k)
Earned income credit: $1,650 (reported on 12.2% of returns)
Here:
$1,650
State:
$1,696
Percentage of individuals using paid preparers for their 2004 taxes: 50.6%
Here:
51%
State:
55%
(% for various income ranges: 39.4% for AGIs below $10k, 48.9% for AGIs $10k-25k, 52.9% for AGIs $25k-50k, 57.4% for AGIs $50k-75k, 53.0% for AGIs $75k-100k, 54.5% for AGIs over 100k)
Likely homosexual households (counted as self-reported same-sex unmarried-partner households)
Lesbian couples: 0.2% of all households
Gay men: 0.0% of all households
Household received Food Stamps/SNAP in the past 12 months: 393 Household did not receive Food Stamps/SNAP in the past 12 months: 4,801
Women who had a birth in the past 12 months: 294 (171 now married, 121 unmarried) Women who did not have a birth in the past 12 months: 2,905 (1,542 now married, 1,361 unmarried)
Housing units in zip code 45002 with a mortgage: 2,437 (243 second mortgage, 16 home equity loan, 198 both second mortgage and home equity loan) Houses without a mortgage: 51
Median monthly owner costs for units with a mortgage: $1,669 Median monthly owner costs for units without a mortgage: $712
Residents with income below the poverty level in 2022:
This zip code:
8.4%
Whole state:
13.4%
Residents with income below 50% of the poverty level in 2022:
This zip code:
5.4%
Whole state:
7.0%
Median number of rooms in houses and condos:
Here:
6.9
State:
6.7
Median number of rooms in apartments:
Here:
4.4
State:
4.4
Notable locations in this zip code not listed on our city pages
Notable locations in zip code 45002: Miamiview Golf Course (A), Hillview Golf Course (B), Western Joint Ambulance District (C), Whitewater Township Fire Department Station 95 (D), Cleves Fire Department (E), Miami Township Fire Department (F), Cleves Municipal Building (G), Miami Township Branch Public Library (H), Whitewater Township Fire Department Station 105 (I). Display/hide their locations on the map
Churches in zip code 45002 include: Cleves Methodist Church (A), Cleves Presbyterian Church (B), First Baptist Church of Cleves (C), First Baptist Church of Miamitown (D), Miamitown Church of Christ (E), Miamitown United Methodist Church (F), Queen City Missionary Baptist Church (G), Cleves Community Church (H), Cleves Church of Christ (I). Display/hide their locations on the map
Cemeteries: Miami Cemetery (1), Berea Cemetery (2), Harrisons Tomb (3), Minges Farm Cemetery (4), Zion United Brethren Cemetery (5), Maple Grove Cemetery (6). Display/hide their locations on the map
Parks in zip code 45002 include: Harrison State Park (1), Miami Whitewater Forest County Park (2), Edgewater Park (3), Harmony Field Park (4), Little Fenway Park (5), Edgewater Sport Park (6). Display/hide their locations on the map
Size of family households: 1,364 2-persons, 751 3-persons, 759 4-persons, 537 5-persons, 70 6-persons, 141 7-or-more-persons
Size of nonfamily households: 1,280 1-person, 261 2-persons
2,890 married couples with children.
699 single-parent households (139 men, 560 women).
98.2% of residents of 45002 zip code speak English at home.
0.4% of residents speak Spanish at home (100% very well).
0.5% of residents speak other Indo-European language at home (94% very well, 6% well).
0.3% of residents speak Asian or Pacific Island language at home (6% very well, 35% well, 59% not well).
0.1% of residents speak other language at home (100% very well).
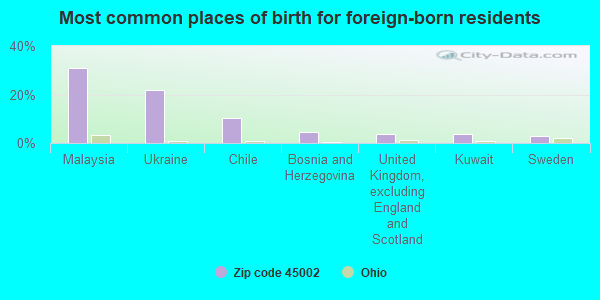
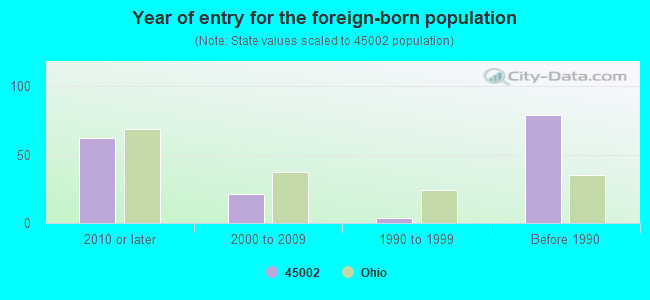
Foreign born population: 106 (0.8%) (72.5% of them are naturalized citizens)
This zip code:
0.8%
Whole state:
5.0%
31%Malaysia
22%Ukraine
10%Chile
5%Bosnia and Herzegovina
4%United Kingdom, excluding England and Scotland
4%Kuwait
3%Sweden
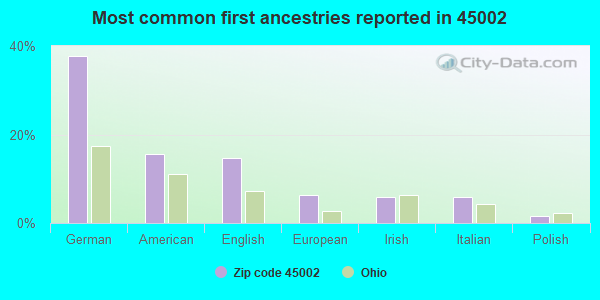
38%German
16%American
15%English
6%European
6%Irish
6%Italian
2%Polish
Year of entry for the foreign-born population
622010 or later
212000 to 2009
41990 to 1999
79Before 1990
Facilities with environmental interests located in this zip code:
BARRETT PAVING MATERIALS INC (9550 VALLEY JUNCTION ROAD in CLEVES, OH)
AIR SYNTHETIC MINOR (AIRS/AFS) STATE MASTER (Ohio general info) - AIR MAJOR USED OIL PROGRAM (Resource Conservation and Recovery Act (tracking hazardous waste)) Business SIC classification: ASPHALT PAVING MIXTURES AND BLOCKS Alternative names: BARRETT MATERIALS - CLEVES MIX PLANT, BARRETT PAVING MATERIALS INC PLT 90, BARRETT PAVING PLANT #90, BARRETT PAVING PLANT NO 90
AERO POWER INC (4718 EAST MIAMI RIVER ROAD LOT G in CLEVES, OH)
STATE MASTER (Ohio general info) - AIR MAJOR (Resource Conservation and Recovery Act (tracking hazardous waste)) Organizations: GEISZ GEORGE E (CONTACT/OWNER)
A & H FOUNDATION (5633 DRY FORK RD in CLEVES, OH)
STATE MASTER (Ohio general info) - RCRA-OHD987055381, HAZARDOUS WASTE PROGRAM Conditionally Exempt Small Quantity Generators, less than 100 kg/month of hazardous waste (Resource Conservation and Recovery Act (tracking hazardous waste)) - notification Organizations: ANDERS RON HAMMOND WAYNE (CONTACT/OWNER)
, RON ANDERS & WAYNE HAMMOND (CONTACT/OWNER)
ACE SANITATION SERVICE (4525 ST RT 128 in CLEVES, OH)
STATE MASTER (Ohio general info) - RCRA-OHR000024752, HAZARDOUS WASTE PROGRAM TRANSPORTER (Resource Conservation and Recovery Act (tracking hazardous waste)) Organizations: GERALD W STEWART (CONTACT/OWNER)
ASHCRAFT SAND & GRAVEL CO INC (5580 DRY FORK ROAD in CLEVES, OH)
AIR MINOR (AIRS/AFS) STATE MASTER (Ohio general info) - AIR MAJOR Business SIC classification: NONCLASSIFIABLE ESTABLISHMENTS
BP OIL CO NO 09169 (21 W STATE ST in CLEVES, OH)
STATE MASTER (Ohio general info) - AIR MAJOR, -31-5541-1038-Y, EPCRA, RCRA-OHD987028347, HAZARDOUS WASTE PROGRAM Conditionally Exempt Small Quantity Generators, less than 100 kg/month of hazardous waste (Resource Conservation and Recovery Act (tracking hazardous waste)) - notification Organizations: BP OIL COMPANY (CONTACT/OWNER)
Alternative names: BP OIL CO SITE 09169
BOB WHALEN AUTO BODY (6651 MORGAN RD in CLEVES, OH)
STATE MASTER (Ohio general info) - AIR MAJOR Conditionally Exempt Small Quantity Generators, less than 100 kg/month of hazardous waste (Resource Conservation and Recovery Act (tracking hazardous waste)) - notification Organizations: WHALEN ROBERT (CONTACT/OWNER)
Alternative names: WHALEN BOB AUTO BODY
AMERICAN SERVICES GROUP INC (5695 ST RTE 128 in CLEVES, OH)
(Resource Conservation and Recovery Act (tracking hazardous waste)) Organizations: JIM MCCARTHY (CONTACT/OWNER)
BELPAR (5591 DRYFORK RD in CLEVES, OH)
COMPLIANCE ACTIVITY (Tracking inspections of insecticide, fungicide, and rodenticide, and toxic substances)
Housing units lacking complete plumbing facilities: 3.7% Housing units lacking complete kitchen facilities: 4.7%
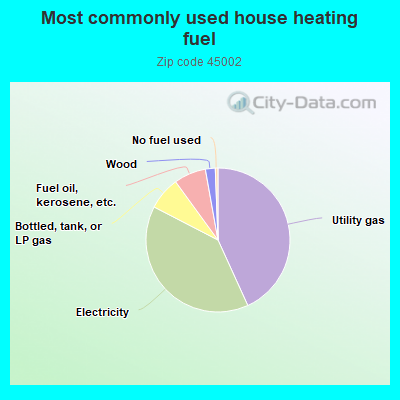
43.2%Utility gas
39.4%Electricity
7.4%Bottled, tank, or LP gas
7.2%Fuel oil, kerosene, etc.
2.2%Wood
0.6%No fuel used
Population in 1990: 10,249. Population change in the 1990s: +1,681 (+16.4%).
Place of birth for U.S.-born residents:
This state: 12,142
Northeast: 234
Midwest: 322
South: 953
West: 197
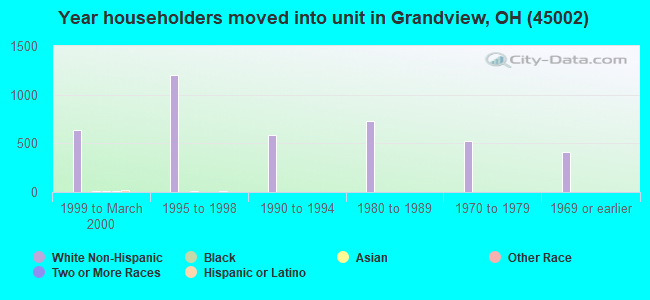
59% of the 45002 zip code residents lived in the same house 5 years ago. Out of people who lived in different houses, 80% lived in this county. Out of people who lived in different counties, 50% lived in Ohio.
90% of the 45002 zip code residents lived in the same house 1 year ago. Out of people who lived in different houses, 71% moved from this county. Out of people who lived in different houses, 4% moved from different county within same state. Out of people who lived in different houses, 21% moved from different state.
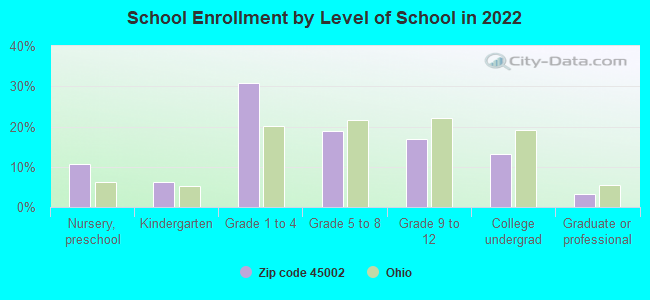
Private vs. public school enrollment:
Students in private schools in grades 1 to 8 (elementary and middle school): 649
Here:
41.2%
Ohio:
16.0%
Students in private schools in grades 9 to 12 (high school): 131
Here:
24.9%
Ohio:
13.1%
Students in private undergraduate colleges: 64
Here:
15.9%
Ohio:
22.3%
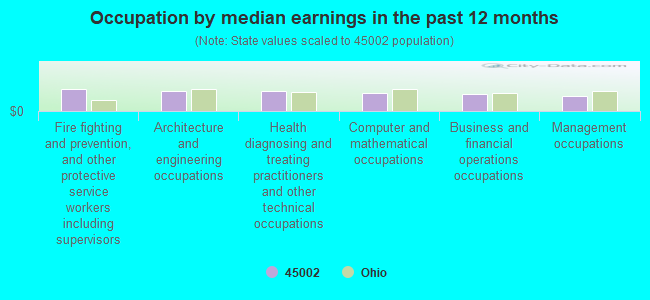
Occupation by median earnings in the past 12 months ($)
99,131Fire fighting and prevention, and other protective service workers including supervisors
92,202Architecture and engineering occupations
90,231Health diagnosing and treating practitioners and other technical occupations
83,709Computer and mathematical occupations
79,330Business and financial operations occupations
70,098Management occupations
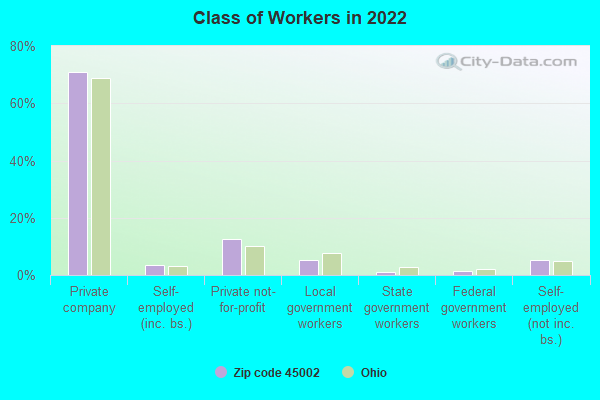
Companies with federal contracts located in this zip code:
POLYCRAFT PRODUCTS INC (5511 STATE ROUTE 128 in CLEVES, OH; small business)
$8,428 with Navy for Lathes. Taking place in WA. Signed on 2005-03-14. Completion date: 2005-04-25.
Top industries in this zip code by the number of employees in 2005:
Other Services (except Public Administration): Commercial and Industrial Machinery and Equipment (except Automotive and Electronic) Repair and Maintenance (20-49: 1, 10-19: 2, 5-9: 2, 1-4: 1)
Arts, Entertainment, and Recreation: Theater Companies and Dinner Theaters (50-99: 1)
People in group quarters in 2000:
185 people in nursing homes
Fatal accident statistics in 2014:
Fatal accident count: 3
Vehicles involved in fatal accidents: 4
Fatal accidents caused by drunken drivers: 1
Fatalities: 3
Persons involved in fatal accidents: 7
Pedestrians involved in fatal accidents: 0
Fatal accident statistics in 2012:
Fatal accident count: 5
Vehicles involved in fatal accidents: 9
Fatal accidents caused by drunken drivers: 3
Fatalities: 5
Persons involved in fatal accidents: 11
Pedestrians involved in fatal accidents: 0
Home Mortgage Disclosure Act Aggregated Statistics For Year 2009 (Based on 10 partial tracts)
A) FHA, FSA/RHS & VA Home Purchase Loans
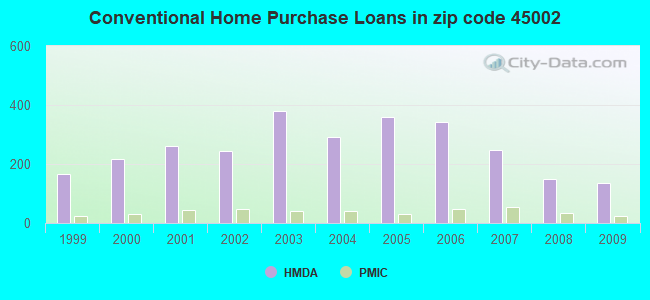
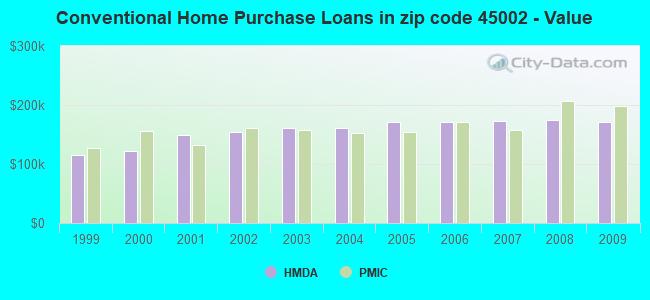
B) Conventional Home Purchase Loans
C) Refinancings
D) Home Improvement Loans
E) Loans on Dwellings For 5+ Families
F) Non-occupant Loans on < 5 Family Dwellings (A B C & D)
G) Loans On Manufactured Home Dwelling (A B C & D)
Number
Average Value
Number
Average Value
Number
Average Value
Number
Average Value
Number
Average Value
Number
Average Value
Number
Average Value
LOANS ORIGINATED
44
$139,033
136
$172,017
635
$185,493
18
$40,726
1
$250,050
12
$82,629
6
$46,868
APPLICATIONS APPROVED, NOT ACCEPTED
5
$93,384
10
$134,082
28
$216,166
0
$0
0
$0
2
$267,470
5
$37,572
APPLICATIONS DENIED
11
$103,585
14
$109,746
145
$185,380
23
$16,288
1
$88,780
7
$138,101
8
$17,461
APPLICATIONS WITHDRAWN
3
$214,287
15
$190,408
76
$201,289
1
$35,370
0
$0
2
$53,550
1
$88,310
FILES CLOSED FOR INCOMPLETENESS
0
$0
1
$150,160
20
$195,650
1
$52,310
0
$0
1
$79,200
1
$41,790
Aggregated Statistics For Year 2008 (Based on 10 partial tracts)
A) FHA, FSA/RHS & VA Home Purchase Loans
B) Conventional Home Purchase Loans
C) Refinancings
D) Home Improvement Loans
E) Loans on Dwellings For 5+ Families
F) Non-occupant Loans on < 5 Family Dwellings (A B C & D)
G) Loans On Manufactured Home Dwelling (A B C & D)
Number
Average Value
Number
Average Value
Number
Average Value
Number
Average Value
Number
Average Value
Number
Average Value
Number
Average Value
LOANS ORIGINATED
45
$130,081
148
$175,248
249
$186,109
30
$47,140
1
$332,910
27
$87,162
9
$47,232
APPLICATIONS APPROVED, NOT ACCEPTED
3
$114,763
6
$156,257
28
$188,180
4
$76,608
0
$0
4
$126,380
2
$35,380
APPLICATIONS DENIED
10
$98,523
28
$100,054
124
$140,416
45
$55,196
1
$332,910
13
$59,892
10
$32,247
APPLICATIONS WITHDRAWN
5
$178,808
16
$192,630
50
$176,410
4
$86,010
0
$0
2
$132,005
3
$109,893
FILES CLOSED FOR INCOMPLETENESS
1
$109,510
2
$53,915
6
$163,967
3
$47,787
0
$0
1
$68,060
0
$0
Aggregated Statistics For Year 2007 (Based on 10 partial tracts)
A) FHA, FSA/RHS & VA Home Purchase Loans
B) Conventional Home Purchase Loans
C) Refinancings
D) Home Improvement Loans
E) Loans on Dwellings For 5+ Families
F) Non-occupant Loans on < 5 Family Dwellings (A B C & D)
G) Loans On Manufactured Home Dwelling (A B C & D)
Number
Average Value
Number
Average Value
Number
Average Value
Number
Average Value
Number
Average Value
Number
Average Value
Number
Average Value
LOANS ORIGINATED
15
$117,645
247
$172,252
242
$153,050
72
$43,108
1
$263,370
28
$85,831
10
$39,868
APPLICATIONS APPROVED, NOT ACCEPTED
0
$0
26
$121,295
50
$176,387
14
$34,544
0
$0
1
$83,470
7
$47,344
APPLICATIONS DENIED
5
$141,592
41
$91,664
189
$147,194
51
$46,527
0
$0
17
$69,710
11
$37,055
APPLICATIONS WITHDRAWN
2
$113,305
26
$198,107
75
$148,815
5
$53,048
0
$0
2
$28,515
4
$40,628
FILES CLOSED FOR INCOMPLETENESS
1
$68,800
7
$126,030
17
$149,575
0
$0
0
$0
1
$62,880
0
$0
Aggregated Statistics For Year 2006 (Based on 10 partial tracts)
A) FHA, FSA/RHS & VA Home Purchase Loans
B) Conventional Home Purchase Loans
C) Refinancings
D) Home Improvement Loans
E) Loans on Dwellings For 5+ Families
F) Non-occupant Loans on < 5 Family Dwellings (A B C & D)
G) Loans On Manufactured Home Dwelling (A B C & D)
Number
Average Value
Number
Average Value
Number
Average Value
Number
Average Value
Number
Average Value
Number
Average Value
Number
Average Value
LOANS ORIGINATED
11
$122,035
343
$171,493
289
$123,910
75
$38,161
1
$5,859,220
36
$84,607
8
$43,411
APPLICATIONS APPROVED, NOT ACCEPTED
1
$63,430
34
$146,927
66
$121,518
8
$52,339
0
$0
5
$67,618
7
$36,169
APPLICATIONS DENIED
3
$125,773
60
$95,620
201
$158,954
42
$43,463
0
$0
17
$92,924
22
$37,291
APPLICATIONS WITHDRAWN
3
$159,223
31
$134,956
99
$149,250
12
$50,874
0
$0
11
$111,239
1
$58,490
FILES CLOSED FOR INCOMPLETENESS
0
$0
10
$193,570
34
$160,163
4
$31,982
0
$0
1
$68,410
0
$0
Aggregated Statistics For Year 2005 (Based on 10 partial tracts)
A) FHA, FSA/RHS & VA Home Purchase Loans
B) Conventional Home Purchase Loans
C) Refinancings
D) Home Improvement Loans
F) Non-occupant Loans on < 5 Family Dwellings (A B C & D)
G) Loans On Manufactured Home Dwelling (A B C & D)
Number
Average Value
Number
Average Value
Number
Average Value
Number
Average Value
Number
Average Value
Number
Average Value
LOANS ORIGINATED
18
$121,945
360
$171,836
391
$152,314
48
$47,600
56
$87,960
10
$65,776
APPLICATIONS APPROVED, NOT ACCEPTED
1
$168,530
27
$140,888
85
$152,461
10
$50,074
4
$73,290
6
$58,200
APPLICATIONS DENIED
0
$0
72
$96,217
261
$142,941
52
$37,614
29
$65,742
42
$39,528
APPLICATIONS WITHDRAWN
3
$74,807
29
$129,487
147
$153,970
18
$145,666
7
$80,709
4
$67,975
FILES CLOSED FOR INCOMPLETENESS
1
$148,010
13
$154,036
36
$174,245
1
$105,240
1
$119,110
1
$148,010
Aggregated Statistics For Year 2004 (Based on 10 partial tracts)
A) FHA, FSA/RHS & VA Home Purchase Loans
B) Conventional Home Purchase Loans
C) Refinancings
D) Home Improvement Loans
E) Loans on Dwellings For 5+ Families
F) Non-occupant Loans on < 5 Family Dwellings (A B C & D)
G) Loans On Manufactured Home Dwelling (A B C & D)
Number
Average Value
Number
Average Value
Number
Average Value
Number
Average Value
Number
Average Value
Number
Average Value
Number
Average Value
LOANS ORIGINATED
9
$105,034
293
$161,143
488
$138,598
67
$29,850
1
$94,690
49
$94,374
14
$37,969
APPLICATIONS APPROVED, NOT ACCEPTED
1
$64,530
30
$141,787
79
$116,553
17
$96,710
0
$0
5
$85,270
12
$45,542
APPLICATIONS DENIED
6
$104,690
63
$97,459
228
$151,726
47
$39,733
0
$0
15
$77,035
31
$43,347
APPLICATIONS WITHDRAWN
1
$97,880
29
$154,728
140
$126,102
11
$67,005
0
$0
6
$93,132
2
$70,635
FILES CLOSED FOR INCOMPLETENESS
0
$0
8
$138,559
33
$140,060
2
$38,395
1
$85,080
1
$38,470
0
$0
Aggregated Statistics For Year 2003 (Based on 10 partial tracts)
A) FHA, FSA/RHS & VA Home Purchase Loans
B) Conventional Home Purchase Loans
C) Refinancings
D) Home Improvement Loans
E) Loans on Dwellings For 5+ Families
F) Non-occupant Loans on < 5 Family Dwellings (A B C & D)
Number
Average Value
Number
Average Value
Number
Average Value
Number
Average Value
Number
Average Value
Number
Average Value
LOANS ORIGINATED
17
$104,505
381
$161,043
1,320
$143,609
56
$26,094
4
$235,442
59
$89,736
APPLICATIONS APPROVED, NOT ACCEPTED
0
$0
51
$137,671
156
$130,641
10
$26,446
0
$0
13
$113,429
APPLICATIONS DENIED
7
$109,874
69
$114,050
267
$120,160
49
$42,324
0
$0
15
$77,555
APPLICATIONS WITHDRAWN
3
$110,303
32
$175,380
160
$139,684
10
$82,091
0
$0
8
$53,082
FILES CLOSED FOR INCOMPLETENESS
0
$0
13
$154,892
45
$140,199
2
$22,355
0
$0
0
$0
Aggregated Statistics For Year 2002 (Based on 6 partial tracts)
A) FHA, FSA/RHS & VA Home Purchase Loans
B) Conventional Home Purchase Loans
C) Refinancings
D) Home Improvement Loans
E) Loans on Dwellings For 5+ Families
F) Non-occupant Loans on < 5 Family Dwellings (A B C & D)
Number
Average Value
Number
Average Value
Number
Average Value
Number
Average Value
Number
Average Value
Number
Average Value
LOANS ORIGINATED
29
$95,733
243
$154,983
866
$141,427
47
$25,110
1
$520,820
49
$89,775
APPLICATIONS APPROVED, NOT ACCEPTED
1
$127,110
29
$94,912
124
$134,455
20
$23,798
0
$0
2
$76,245
APPLICATIONS DENIED
3
$119,053
56
$90,254
183
$120,055
35
$25,146
0
$0
8
$31,905
APPLICATIONS WITHDRAWN
4
$88,400
19
$142,241
119
$133,980
1
$18,500
0
$0
2
$44,890
FILES CLOSED FOR INCOMPLETENESS
0
$0
3
$94,250
46
$137,952
4
$51,872
0
$0
2
$60,555
Aggregated Statistics For Year 2001 (Based on 6 partial tracts)
A) FHA, FSA/RHS & VA Home Purchase Loans
B) Conventional Home Purchase Loans
C) Refinancings
D) Home Improvement Loans
E) Loans on Dwellings For 5+ Families
F) Non-occupant Loans on < 5 Family Dwellings (A B C & D)
Number
Average Value
Number
Average Value
Number
Average Value
Number
Average Value
Number
Average Value
Number
Average Value
LOANS ORIGINATED
36
$87,402
262
$149,055
648
$125,583
54
$25,133
0
$0
46
$118,242
APPLICATIONS APPROVED, NOT ACCEPTED
0
$0
39
$81,163
104
$107,720
13
$22,679
1
$73,980
3
$50,163
APPLICATIONS DENIED
0
$0
88
$62,975
220
$88,548
65
$14,952
0
$0
10
$56,075
APPLICATIONS WITHDRAWN
1
$158,320
20
$263,416
121
$97,609
8
$41,462
0
$0
4
$119,292
FILES CLOSED FOR INCOMPLETENESS
1
$94,690
2
$78,455
24
$93,140
2
$58,130
0
$0
0
$0
Aggregated Statistics For Year 2000 (Based on 6 partial tracts)
A) FHA, FSA/RHS & VA Home Purchase Loans
B) Conventional Home Purchase Loans
C) Refinancings
D) Home Improvement Loans
F) Non-occupant Loans on < 5 Family Dwellings (A B C & D)
Number
Average Value
Number
Average Value
Number
Average Value
Number
Average Value
Number
Average Value
LOANS ORIGINATED
23
$95,626
218
$121,209
177
$86,719
78
$22,276
29
$118,528
APPLICATIONS APPROVED, NOT ACCEPTED
3
$69,990
60
$69,073
72
$61,968
24
$17,703
9
$57,581
APPLICATIONS DENIED
4
$79,160
121
$43,598
122
$66,427
43
$9,793
9
$45,332
APPLICATIONS WITHDRAWN
2
$43,220
29
$91,943
46
$59,773
12
$35,952
4
$61,428
FILES CLOSED FOR INCOMPLETENESS
0
$0
6
$80,258
16
$79,323
3
$20,027
0
$0
Aggregated Statistics For Year 1999 (Based on 5 partial tracts)
A) FHA, FSA/RHS & VA Home Purchase Loans
B) Conventional Home Purchase Loans
C) Refinancings
D) Home Improvement Loans
E) Loans on Dwellings For 5+ Families
F) Non-occupant Loans on < 5 Family Dwellings (A B C & D)
2002 - 2018 National Fire Incident Reporting System (NFIRS) incidents
According to the data from the years 2002 - 2018 the average number of fires per year is 67. The highest number of reported fire incidents - 116 took place in 2008, and the least - 32 in 2002. The data has an increasing trend.
When looking into fire subcategories, the most reports belonged to: Structure Fires (44.0%), and Outside Fires (35.9%).
Fire incident types reported to NFIRS in Zip Code 45002
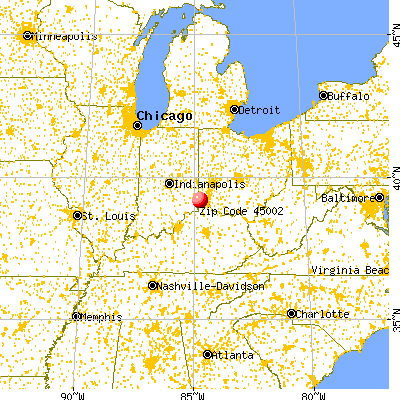


 Nearest zip codes: 45033, 45052, 45041, 45030, 45001, 45247.


 According to the data from the years 2002 - 2018 the average number of fires per year is 67. The highest number of reported fire incidents - 116 took place in 2008, and the least - 32 in 2002. The data has an increasing trend.
 When looking into fire subcategories, the most reports belonged to: Structure Fires (44.0%), and Outside Fires (35.9%).