Estimated zip code population in 2022: 3,335 Zip code population in 2010: 3,461 Zip code population in 2000: 3,607
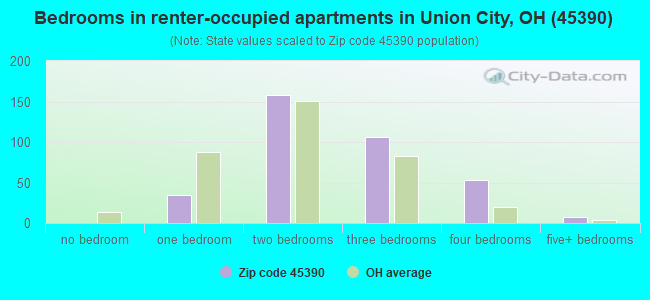
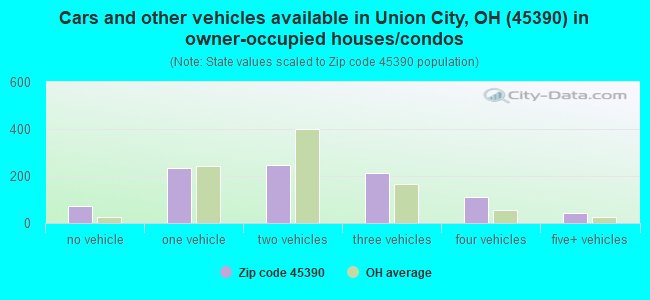
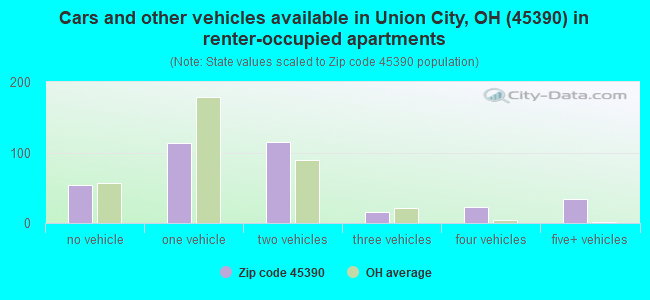
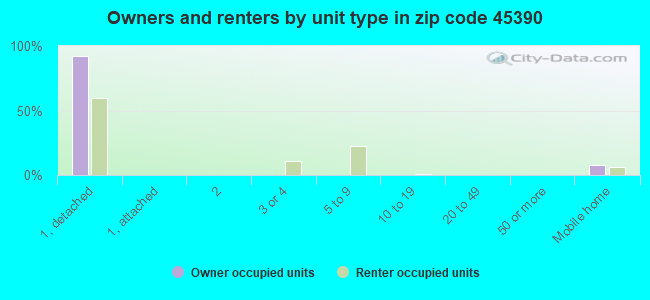
Houses and condos: 1,427 Renter-occupied apartments: 361
% of renters here:
28%
State:
33%
March 2022 cost of living index in zip code 45390: 75.3 (low, U.S. average is 100)
Land area: 52.9 sq. mi. Water area: 0.1 sq. mi.
Population density: 63 people per square mile
(very low).
OSM Map
General Map
Google Map
MSN Map
OSM Map
General Map
Google Map
MSN Map
OSM Map
General Map
Google Map
MSN Map
OSM Map
General Map
Google Map
MSN Map
Please wait while loading the map...
Real estate property taxes paid for housing units in 2022:
This zip code:
0.9% ($988)
Ohio:
1.3% ($2,639)
Median real estate property taxes paid for housing units with mortgages in 2022: $1,081 (0.9%) Median real estate property taxes paid for housing units with no mortgage in 2022: $743 (1.1%)
Business Search- 14 Million verified businesses
Males: 1,833
(55.0%)
Females: 1,502
(45.0%)
For population 25 years and over in 45390:
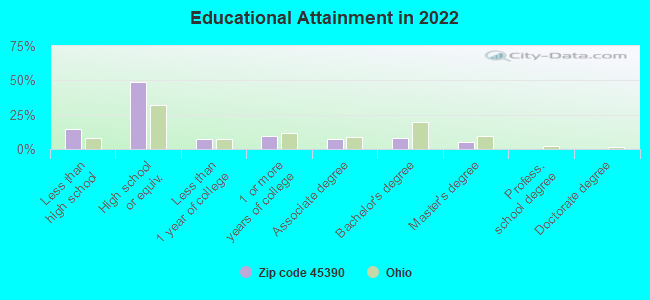
High school or higher: 84.1%
Bachelor's degree or higher: 12.4%
Graduate or professional degree: 4.7%
Unemployed: 4.7%
Mean travel time to work (commute): 20.7 minutes
For population 15 years and over in 45390:
Never married: 28.5%
Now married: 50.4%
Separated: 2.2%
Widowed: 8.4%
Divorced: 10.5%
Zip code 45390 compared to state average:
Median house value below state average.
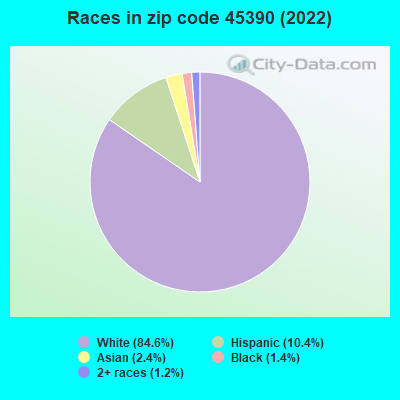
Black race population percentage significantly below state average.
Hispanic race population percentage above state average.
Foreign-born population percentage significantly below state average.
Length of stay since moving in below state average.
Number of college students below state average.
Percentage of population with a bachelor's degree or higher significantly below state average.
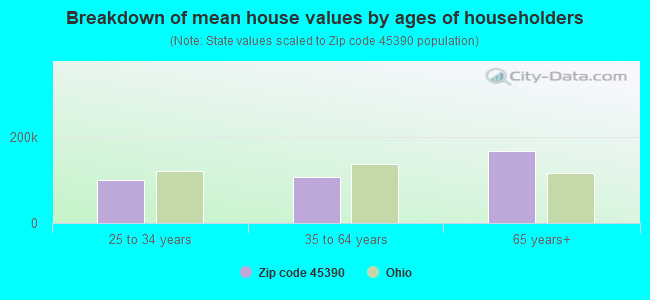
Estimated median house/condo value in 2022: $106,114
45390:
$106,114
Ohio:
$204,100
According to our research of Ohio and other state lists, there were 7 registered sex offenders living in 45390 zip code as of April 27, 2024. The ratio of all residents to sex offenders in zip code 45390 is 483 to 1. The ratio of registered sex offenders to all residents in this zip code is near the state average.
Median resident age:
This zip code:
37.6 years
Ohio median age:
39.9 years
Average household size:
This zip code:
2.6 people
Ohio:
2.4 people
Averages for the 2020 tax year for zip code 45390, filed in 2021:
Average Adjusted Gross Income (AGI) in 2020: $43,371 (Individual Income Tax Returns)
Here:
$43,371
State:
$67,288
Salary/wage: $37,990 (reported on 82.6% of returns)
Here:
$37,990
State:
$55,628
(% of AGI for various income ranges: 1159.5% for AGIs below $25k, 3935.0% for AGIs $25k-50k, 6946.9% for AGIs $50k-75k, 10324.3% for AGIs $75k-100k, 19504.0% for AGIs $100k-200k)
Taxable interest for individuals: $970 (reported on 20.8% of returns)
This zip code:
$970
Ohio:
$1,518
(% of AGI for various income ranges: 17.9% for AGIs below $25k, 10.6% for AGIs $25k-50k, 30.0% for AGIs $50k-75k, 80.0% for AGIs $75k-100k, 166.0% for AGIs $100k-200k)
Ordinary dividends: $2,288 (reported on 11.8% of returns)
Here:
$2,288
State:
$7,167
(% of AGI for various income ranges: 14.9% for AGIs below $25k, 7.2% for AGIs $25k-50k, 14.4% for AGIs $50k-75k, 197.1% for AGIs $75k-100k, 294.0% for AGIs $100k-200k)
Net capital gain/loss in AGI: +$4,140 (reported on 10.4% of returns)
Here:
+$4,140
State:
+$18,919
(% of AGI for various income ranges: 17.9% for AGIs below $25k, 8.1% for AGIs $25k-50k, 29.4% for AGIs $50k-75k, 418.6% for AGIs $75k-100k, 370.0% for AGIs $100k-200k)
Profit/loss from business: +$9,744 (reported on 11.1% of returns)
Here:
+$9,744
State:
+$13,744
(% of AGI for various income ranges: 65.9% for AGIs below $25k, 152.8% for AGIs $25k-50k, 267.5% for AGIs $50k-75k, 287.1% for AGIs $75k-100k, 368.0% for AGIs $100k-200k)
Taxable individual retirement arrangement distribution: $7,291 (reported on 7.6% of returns)
45390:
$7,291
Ohio:
$18,876
(% of AGI for various income ranges: 69.5% for AGIs below $25k, 46.6% for AGIs $25k-50k, 81.2% for AGIs $50k-75k, 360.0% for AGIs $75k-100k)
Earned income credit: $2,303 (reported on 20.1% of returns)
Here:
$2,303
State:
$2,304
(% of AGI for various income ranges: 105.4% for AGIs below $25k, 80.3% for AGIs $25k-50k)
Percentage of individuals using paid preparers for their 2020 taxes: 97.2%
Here:
97%
State:
94%
(% for various income ranges: 96.4% for AGIs below $25k, 95.3% for AGIs $25k-50k, 100.0% for AGIs $50k-75k, 100.0% for AGIs $75k-100k, 100.0% for AGIs $100k-200k)
Averages for the 2012 tax year for zip code 45390, filed in 2013:
Average Adjusted Gross Income (AGI) in 2012: $36,151 (Individual Income Tax Returns)
Here:
$36,151
State:
$54,926
Salary/wage: $30,248 (reported on 83.9% of returns)
Here:
$30,248
State:
$45,869
(% of AGI for various income ranges: 73.4% for AGIs below $25k, 81.0% for AGIs $25k-50k, 77.3% for AGIs $50k-75k, 72.0% for AGIs $75k-100k, 43.8% for AGIs $100k-200k)
Taxable interest for individuals: $1,188 (reported on 23.8% of returns)
This zip code:
$1,188
Ohio:
$1,297
(% of AGI for various income ranges: 1.3% for AGIs below $25k, 0.8% for AGIs $25k-50k, 0.6% for AGIs $50k-75k, 0.8% for AGIs $75k-100k, 0.6% for AGIs $100k-200k)
Ordinary dividends: $1,688 (reported on 11.9% of returns)
Here:
$1,688
State:
$5,821
(% of AGI for various income ranges: 0.7% for AGIs below $25k, 0.4% for AGIs $25k-50k, 0.9% for AGIs $50k-75k, 0.7% for AGIs $100k-200k)
Net capital gain/loss in AGI: +$3,787 (reported on 10.5% of returns)
Here:
+$3,787
State:
+$11,232
(% of AGI for various income ranges: 0.2% for AGIs $25k-50k, 1.5% for AGIs $50k-75k, 3.7% for AGIs $100k-200k)
Profit/loss from business: +$6,822 (reported on 12.6% of returns)
Here:
+$6,822
State:
+$12,773
(% of AGI for various income ranges: 5.6% for AGIs below $25k, 2.6% for AGIs $25k-50k, 2.7% for AGIs $50k-75k, 1.4% for AGIs $75k-100k)
Taxable individual retirement arrangement distribution: $7,242 (reported on 8.4% of returns)
45390:
$7,242
Ohio:
$14,511
(% of AGI for various income ranges: 3.2% for AGIs below $25k, 1.9% for AGIs $25k-50k, 4.5% for AGIs $75k-100k)
Total itemized deductions: $17,931 (21% of AGI, reported on 11.2% of returns)
Here:
$17,931
State:
$21,278
Here:
21.4% of AGI
State:
18.8% of AGI
(% of AGI for various income ranges: 3.4% for AGIs below $25k, 3.0% for AGIs $25k-50k, 7.4% for AGIs $50k-75k, 6.0% for AGIs $75k-100k, 8.8% for AGIs $100k-200k)
Charity contributions: $3,650 (reported on 7.0% of returns)
Here:
$3,650
State:
$3,943
(% of AGI for various income ranges: 1.2% for AGIs below $25k, 1.6% for AGIs $50k-75k, 1.0% for AGIs $100k-200k)
Taxes paid: $6,225 (reported on 11.2% of returns)
45390:
$6,225
State:
$9,568
(% of AGI for various income ranges: 0.8% for AGIs below $25k, 0.6% for AGIs $25k-50k, 2.2% for AGIs $50k-75k, 2.3% for AGIs $75k-100k, 4.3% for AGIs $100k-200k)
Earned income credit: $2,258 (reported on 23.1% of returns)
Here:
$2,258
State:
$2,285
(% of AGI for various income ranges: 7.0% for AGIs below $25k, 1.2% for AGIs $25k-50k)
Percentage of individuals using paid preparers for their 2012 taxes: 69.9%
Here:
70%
State:
51%
(% for various income ranges: 66.7% for AGIs below $25k, 73.3% for AGIs $25k-50k, 70.6% for AGIs $50k-75k, 75.0% for AGIs $75k-100k, 71.4% for AGIs $100k-200k)
Averages for the 2004 tax year for zip code 45390, filed in 2005:
Average Adjusted Gross Income (AGI) in 2004: $29,392 (Individual Income Tax Returns)
Here:
$29,392
State:
$44,480
Salary/wage: $27,124 (reported on 86.8% of returns)
Here:
$27,124
State:
$39,198
(% of AGI for various income ranges: 86.5% for AGIs below $10k, 80.1% for AGIs $10k-25k, 84.2% for AGIs $25k-50k, 82.3% for AGIs $50k-75k, 77.6% for AGIs $75k-100k, 49.8% for AGIs over 100k)
Taxable interest for individuals: $1,131 (reported on 38.8% of returns)
This zip code:
$1,131
Ohio:
$1,532
(% of AGI for various income ranges: 3.6% for AGIs below $10k, 1.6% for AGIs $10k-25k, 1.6% for AGIs $25k-50k, 1.4% for AGIs $50k-75k, 0.9% for AGIs $75k-100k, 0.3% for AGIs over 100k)
Taxable dividends: $974 (reported on 15.0% of returns)
Here:
$974
State:
$3,496
(% of AGI for various income ranges: 0.7% for AGIs below $10k, 0.5% for AGIs $10k-25k, 0.6% for AGIs $25k-50k, 0.2% for AGIs $50k-75k, 0.1% for AGIs $75k-100k, 1.2% for AGIs over 100k)
Net capital gain/loss: +$4,022 (reported on 12.0% of returns)
Here:
+$4,022
State:
+$8,582
(% of AGI for various income ranges: -0.7% for AGIs below $10k, 0.3% for AGIs $10k-25k, 0.6% for AGIs $25k-50k, 1.6% for AGIs $50k-75k, 13.9% for AGIs over 100k)
Profit/loss from business: +$4,963 (reported on 14.1% of returns)
Here:
+$4,963
State:
+$10,813
(% of AGI for various income ranges: 11.7% for AGIs below $10k, 3.5% for AGIs $10k-25k, 1.8% for AGIs $25k-50k, 2.3% for AGIs $50k-75k, 1.9% for AGIs $75k-100k)
Profit/loss from farming: +$561 (reported on 5.4% of returns)
Here:
+$561
State:
-$3,706
IRA payment deduction: $2,581 (reported on 2.0% of returns)
45390:
$2,581
Ohio:
$2,794
Total itemized deductions: $12,539 (24% of AGI, reported on 12.6% of returns)
Here:
$12,539
State:
$17,503
Here:
23.9% of AGI
State:
20.8% of AGI
(% of AGI for various income ranges: 3.4% for AGIs $10k-25k, 4.3% for AGIs $25k-50k, 7.8% for AGIs $50k-75k, 7.4% for AGIs $75k-100k, 8.5% for AGIs over 100k)
Charity contributions deductions: $2,336 (4% of AGI, reported on 7.1% of returns)
Here:
$2,336
State:
$3,087
Here:
4.2% of AGI
State:
3.4% of AGI
(% of AGI for various income ranges: 0.2% for AGIs $10k-25k, 0.5% for AGIs $25k-50k, 1.1% for AGIs $50k-75k, 0.7% for AGIs $75k-100k)
Total tax: $3,046 (reported on 72.9% of returns)
45390:
$3,046
State:
$6,781
(% of AGI for various income ranges: 3.3% for AGIs below $10k, 4.6% for AGIs $10k-25k, 6.5% for AGIs $25k-50k, 8.7% for AGIs $50k-75k, 10.4% for AGIs $75k-100k, 15.8% for AGIs over 100k)
Earned income credit: $1,601 (reported on 18.4% of returns)
Here:
$1,601
State:
$1,696
Percentage of individuals using paid preparers for their 2004 taxes: 72.9%
Here:
73%
State:
55%
(% for various income ranges: 69.2% for AGIs below $10k, 74.2% for AGIs $10k-25k, 73.9% for AGIs $25k-50k, 71.7% for AGIs $50k-75k, 73.2% for AGIs $75k-100k, 86.4% for AGIs over 100k)
Likely homosexual households (counted as self-reported same-sex unmarried-partner households)
Lesbian couples: 1.1% of all households
Gay men: 0.0% of all households
Household received Food Stamps/SNAP in the past 12 months: 284 Household did not receive Food Stamps/SNAP in the past 12 months: 1,004
Women who had a birth in the past 12 months: 44 (37 now married, 7 unmarried) Women who did not have a birth in the past 12 months: 686 (363 now married, 323 unmarried)
Housing units in zip code 45390 with a mortgage: 498 (73 second mortgage, 75 both second mortgage and home equity loan) Houses without a mortgage: 13
Median monthly owner costs for units with a mortgage: $930 Median monthly owner costs for units without a mortgage: $449
Residents with income below the poverty level in 2022:
This zip code:
25.3%
Whole state:
13.4%
Residents with income below 50% of the poverty level in 2022:
This zip code:
12.9%
Whole state:
7.0%
Median number of rooms in houses and condos:
Here:
6.4
State:
6.7
Median number of rooms in apartments:
Here:
5.2
State:
4.4
Notable locations in this zip code not listed on our city pages
Notable locations in zip code 45390: Union City Golf Course (A), Zumbrum Corners (B), Kirgan Farms (C), Timmerman Farm (D), Hiestand Turkey Farm (E), Double D Wind Farm (F), Dan Lo Farms (G), Fresh Aire Farms (H), Willowcreek Dairy (I), Union City Fire Department Station 18 (J), Union City City Hall (K). Display/hide their locations on the map
Churches in zip code 45390 include: Raper Chapel (A), Pleasant Valley Church (B), Shady Grove Church (C), Sugar Grove Church of Christ (D), Evangelical United Methodist Church (E), Hillgrove Federated Church (F), Waterhouse Church (G), Poplar Grove Church (H). Display/hide their locations on the map
Cemeteries: Snell Cemetery (1), Spring Hill Cemetery (2), Raper Chapel Cemetery (3), Mount Zion Cemetery (4), Hillgrove Cemetery (5), McFarland Cemetery (6). Display/hide their locations on the map
396 married couples with children.
250 single-parent households (14 men, 236 women).
94.1% of residents of 45390 zip code speak English at home.
2.8% of residents speak Spanish at home (89% very well, 10% not well, 1% not at all).
2.1% of residents speak Asian or Pacific Island language at home (32% well, 68% not well).
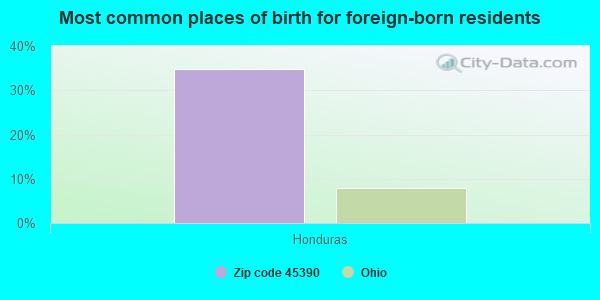
Foreign born population: 48 (1.5%) (0.0% of them are naturalized citizens)
:
1.5%
Whole state:
5.0%
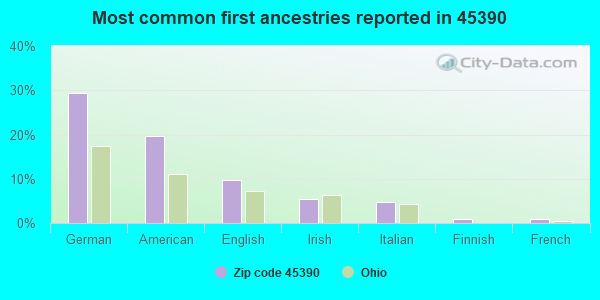
35%Honduras
29%German
20%American
10%English
5%Irish
5%Italian
1%Finnish
1%French
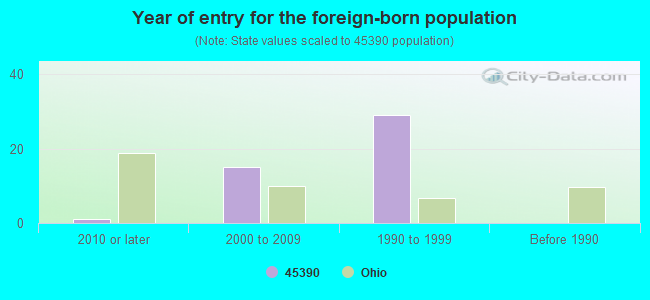
Year of entry for the foreign-born population
12010 or later
152000 to 2009
291990 to 1999
0Before 1990
Facilities with environmental interests located in this zip code:
BEVERLY GARDENS ELEMENTARY SCHOOL (5555 ENRIGHT AVE in DAYTON, OH)
(Geographic Names Information System) (National Center for Education Statistics) - STATE ID-002667 Organizations: MAD RIVER LOCAL SD (SCHOOL DISTRICT)
Housing units lacking complete plumbing facilities: 4.9% Housing units lacking complete kitchen facilities: 4.9%
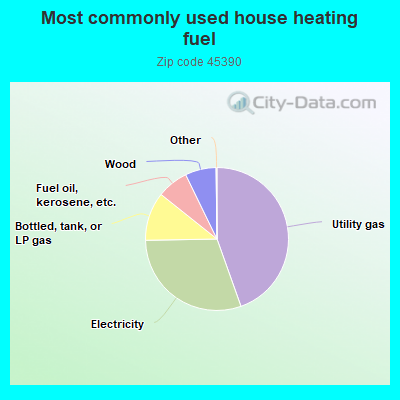
44.6%Utility gas
30.2%Electricity
11.0%Bottled, tank, or LP gas
7.1%Fuel oil, kerosene, etc.
7.0%Wood
Population in 1990: 4,123.
Place of birth for U.S.-born residents:
This state: 1,832
Northeast: 43
Midwest: 1,028
South: 288
West: 82
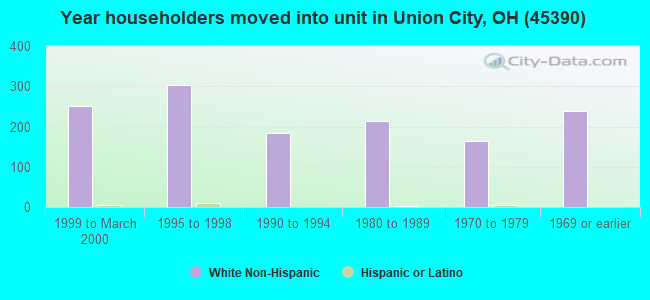
60% of the 45390 zip code residents lived in the same house 5 years ago. Out of people who lived in different houses, 57% lived in this county. Out of people who lived in different counties, 50% lived in Ohio.
83% of the 45390 zip code residents lived in the same house 1 year ago. Out of people who lived in different houses, 38% moved from this county. Out of people who lived in different houses, 14% moved from different county within same state. Out of people who lived in different houses, 46% moved from different state. Out of people who lived in different houses, 0% moved from abroad.
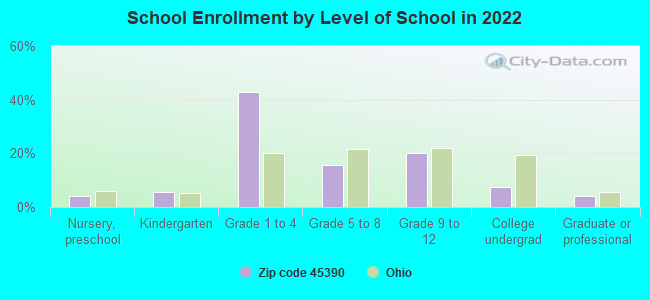
Private vs. public school enrollment:
Students in private schools in grades 1 to 8 (elementary and middle school): 20
Here:
5.0%
Ohio:
16.0%
Students in private schools in grades 9 to 12 (high school):
Here:
0.0%
Ohio:
13.1%
Students in private undergraduate colleges: 3
Here:
6.9%
Ohio:
22.3%
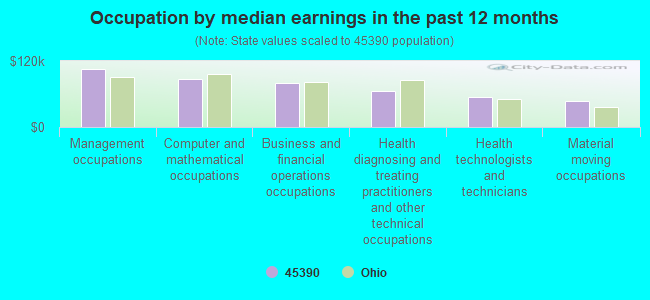
Occupation by median earnings in the past 12 months ($)
106,117Management occupations
87,553Computer and mathematical occupations
79,933Business and financial operations occupations
64,957Health diagnosing and treating practitioners and other technical occupations
55,295Health technologists and technicians
47,143Material moving occupations
Companies with federal contracts located in this zip code:
LASER KING (209 EAST PEPPERMINT DRIVE in UNION CITY, OH; small business)
$10,515 with Navy for Individual Equipment. Taking place in VA. Signed on 2005-09-01. Completion date: 2005-09-09.
Top industries in this zip code by the number of employees in 2005:
Health Care and Social Assistance: Residential Mental Retardation Facilities (50-99 employees: 1 establishment)
Health Care and Social Assistance: Nursing Care Facilities (50-99: 1)
Construction: Painting and Wall Covering Contractors (10-19: 1, 1-4: 4)
Other Services (except Public Administration): Commercial and Industrial Machinery and Equipment (except Automotive and Electronic) Repair and Maintenance (5-9: 2, 1-4: 1)
Wholesale Trade: Meat and Meat Product Merchant Wholesalers (10-19: 1)
People in group quarters in 2010:
81 people in nursing facilities/skilled-nursing facilities
2 people in workers' group living quarters and job corps centers
People in group quarters in 2000:
50 people in schools, hospitals, or wards for the intellectually disabled
49 people in nursing homes
Fatal accident statistics in 2014:
Fatal accident count: 1
Vehicles involved in fatal accidents: 2
Fatal accidents caused by drunken drivers: 0
Fatalities: 1
Persons involved in fatal accidents: 4
Pedestrians involved in fatal accidents: 0
2002 - 2018 National Fire Incident Reporting System (NFIRS) incidents
According to the data from the years 2002 - 2018 the average number of fires per year is 35. The highest number of reported fire incidents - 71 took place in 2006, and the least - 9 in 2018. The data has a declining trend.
When looking into fire subcategories, the most reports belonged to: Structure Fires (64.2%), and Outside Fires (27.8%).
Fire incident types reported to NFIRS in Zip Code 45390


+$561
-$3,706
 Nearest zip codes: 47390, 45303, 45362, 47382, 45331, 45348.
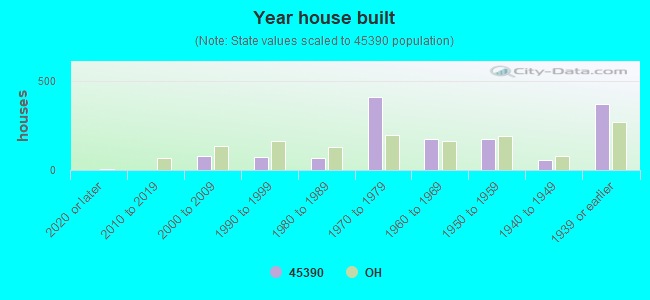


 According to the data from the years 2002 - 2018 the average number of fires per year is 35. The highest number of reported fire incidents - 71 took place in 2006, and the least - 9 in 2018. The data has a declining trend.
 When looking into fire subcategories, the most reports belonged to: Structure Fires (64.2%), and Outside Fires (27.8%).