Estimated zip code population in 2022: 16,043 Zip code population in 2010: 18,465 Zip code population in 2000: 20,107
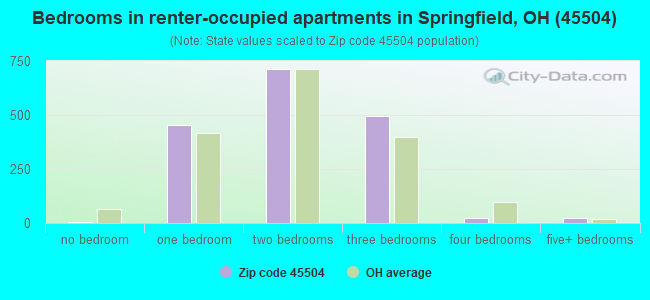
Houses and condos: 7,036 Renter-occupied apartments: 1,703
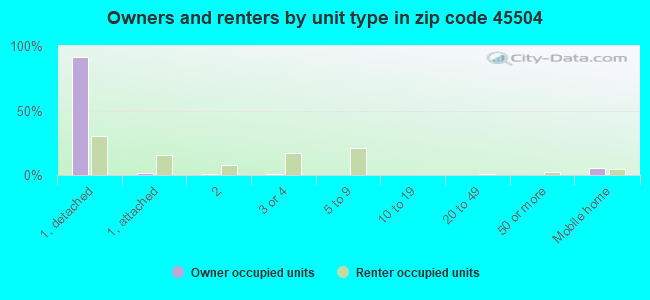
% of renters here:
27%
State:
33%
March 2022 cost of living index in zip code 45504: 92.1 (less than average, U.S. average is 100)
Land area: 23.2 sq. mi. Water area: 0.1 sq. mi.
Population density: 690 people per square mile
(low).
OSM Map
General Map
Google Map
MSN Map
OSM Map
General Map
Google Map
MSN Map
OSM Map
General Map
Google Map
MSN Map
OSM Map
General Map
Google Map
MSN Map
Please wait while loading the map...
Real estate property taxes paid for housing units in 2022:
This zip code:
1.2% ($2,103)
Ohio:
1.3% ($2,639)
Median real estate property taxes paid for housing units with mortgages in 2022: $2,185 (1.3%) Median real estate property taxes paid for housing units with no mortgage in 2022: $1,971 (1.2%)
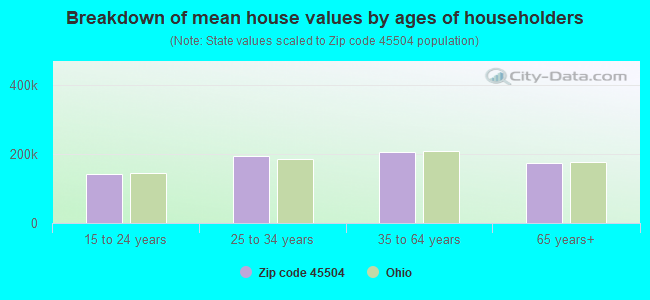
Estimated median house/condo value in 2022: $168,691
45504:
$168,691
Ohio:
$204,100
According to our research of Ohio and other state lists, there were 37 registered sex offenders living in 45504 zip code as of April 27, 2024. The ratio of all residents to sex offenders in zip code 45504 is 491 to 1. The ratio of registered sex offenders to all residents in this zip code is near the state average.
Median resident age:
This zip code:
38.7 years
Ohio median age:
39.9 years
Average household size:
This zip code:
2.3 people
Ohio:
2.4 people
Averages for the 2020 tax year for zip code 45504, filed in 2021:
Average Adjusted Gross Income (AGI) in 2020: $61,903 (Individual Income Tax Returns)
Here:
$61,903
State:
$67,288
Salary/wage: $48,914 (reported on 81.0% of returns)
Here:
$48,914
State:
$55,628
(% of AGI for various income ranges: 1099.0% for AGIs below $25k, 3464.2% for AGIs $25k-50k, 6022.6% for AGIs $50k-75k, 8777.1% for AGIs $75k-100k, 16117.8% for AGIs $100k-200k, 67406.7% for AGIs over 200k)
Taxable interest for individuals: $1,173 (reported on 30.4% of returns)
This zip code:
$1,173
Ohio:
$1,518
(% of AGI for various income ranges: 13.1% for AGIs below $25k, 14.5% for AGIs $25k-50k, 42.0% for AGIs $50k-75k, 40.8% for AGIs $75k-100k, 126.9% for AGIs $100k-200k, 1650.0% for AGIs over 200k)
Ordinary dividends: $7,591 (reported on 17.1% of returns)
Here:
$7,591
State:
$7,167
(% of AGI for various income ranges: 23.2% for AGIs below $25k, 23.0% for AGIs $25k-50k, 91.5% for AGIs $50k-75k, 139.8% for AGIs $75k-100k, 435.1% for AGIs $100k-200k, 8825.0% for AGIs over 200k)
Net capital gain/loss in AGI: +$15,938 (reported on 14.5% of returns)
Here:
+$15,938
State:
+$18,919
(% of AGI for various income ranges: 8.3% for AGIs below $25k, 19.0% for AGIs $25k-50k, 103.3% for AGIs $50k-75k, 202.4% for AGIs $75k-100k, 538.0% for AGIs $100k-200k, 20830.0% for AGIs over 200k)
Profit/loss from business: +$17,147 (reported on 12.2% of returns)
Here:
+$17,147
State:
+$13,744
(% of AGI for various income ranges: 57.4% for AGIs below $25k, 115.8% for AGIs $25k-50k, 125.5% for AGIs $50k-75k, 198.8% for AGIs $75k-100k, 790.5% for AGIs $100k-200k, 11025.0% for AGIs over 200k)
Taxable individual retirement arrangement distribution: $18,660 (reported on 10.1% of returns)
45504:
$18,660
Ohio:
$18,876
(% of AGI for various income ranges: 57.0% for AGIs below $25k, 103.5% for AGIs $25k-50k, 202.5% for AGIs $50k-75k, 380.2% for AGIs $75k-100k, 1043.1% for AGIs $100k-200k, 3841.7% for AGIs over 200k)
Self-employed (Keogh) retirement plans: $30,167 (reported on 0.4% of returns)
45504:
$30,167
Ohio:
$24,898
(% of AGI for various income ranges: 164.5% for AGIs $100k-200k)
Total itemized deductions: $35,920 (reported on 4.5% of returns)
Here:
$35,920
State:
$33,869
(% of AGI for various income ranges: 26.6% for AGIs below $25k, 46.3% for AGIs $25k-50k, 196.7% for AGIs $50k-75k, 302.2% for AGIs $75k-100k, 646.5% for AGIs $100k-200k, 7483.3% for AGIs over 200k)
Charity contributions: $15,530 (reported on 3.5% of returns)
Here:
$15,530
State:
$14,577
(% of AGI for various income ranges: 3.9% for AGIs below $25k, 32.5% for AGIs $50k-75k, 56.5% for AGIs $75k-100k, 199.5% for AGIs $100k-200k, 4095.0% for AGIs over 200k)
Taxes paid: $7,009 (reported on 4.5% of returns)
45504:
$7,009
State:
$7,681
(% of AGI for various income ranges: 3.0% for AGIs below $25k, 6.0% for AGIs $25k-50k, 29.0% for AGIs $50k-75k, 75.7% for AGIs $75k-100k, 159.1% for AGIs $100k-200k, 1316.7% for AGIs over 200k)
Earned income credit: $2,275 (reported on 16.2% of returns)
Here:
$2,275
State:
$2,304
(% of AGI for various income ranges: 93.5% for AGIs below $25k, 62.3% for AGIs $25k-50k, 1.3% for AGIs $50k-75k)
Percentage of individuals using paid preparers for their 2020 taxes: 93.3%
Here:
93%
State:
94%
(% for various income ranges: 93.6% for AGIs below $25k, 93.9% for AGIs $25k-50k, 93.3% for AGIs $50k-75k, 91.8% for AGIs $75k-100k, 91.7% for AGIs $100k-200k, 95.5% for AGIs over 200k)
Averages for the 2012 tax year for zip code 45504, filed in 2013:
Average Adjusted Gross Income (AGI) in 2012: $54,744 (Individual Income Tax Returns)
Here:
$54,744
State:
$54,926
Salary/wage: $44,341 (reported on 82.0% of returns)
Here:
$44,341
State:
$45,869
(% of AGI for various income ranges: 73.2% for AGIs below $25k, 73.6% for AGIs $25k-50k, 75.7% for AGIs $50k-75k, 73.4% for AGIs $75k-100k, 69.3% for AGIs $100k-200k, 45.1% for AGIs over 200k)
Taxable interest for individuals: $1,454 (reported on 33.8% of returns)
This zip code:
$1,454
Ohio:
$1,297
(% of AGI for various income ranges: 1.4% for AGIs below $25k, 0.8% for AGIs $25k-50k, 0.5% for AGIs $50k-75k, 0.7% for AGIs $75k-100k, 0.8% for AGIs $100k-200k, 1.2% for AGIs over 200k)
Ordinary dividends: $7,355 (reported on 19.9% of returns)
Here:
$7,355
State:
$5,821
(% of AGI for various income ranges: 1.6% for AGIs below $25k, 1.1% for AGIs $25k-50k, 1.2% for AGIs $50k-75k, 1.4% for AGIs $75k-100k, 2.2% for AGIs $100k-200k, 6.4% for AGIs over 200k)
Net capital gain/loss in AGI: +$8,175 (reported on 14.6% of returns)
Here:
+$8,175
State:
+$11,232
(% of AGI for various income ranges: 0.1% for AGIs below $25k, 0.2% for AGIs $25k-50k, 0.6% for AGIs $50k-75k, 0.4% for AGIs $75k-100k, 2.0% for AGIs $100k-200k, 6.8% for AGIs over 200k)
Profit/loss from business: +$16,833 (reported on 12.6% of returns)
Here:
+$16,833
State:
+$12,773
(% of AGI for various income ranges: 4.6% for AGIs below $25k, 2.0% for AGIs $25k-50k, 2.1% for AGIs $50k-75k, 1.9% for AGIs $75k-100k, 5.0% for AGIs $100k-200k, 6.3% for AGIs over 200k)
Taxable individual retirement arrangement distribution: $12,485 (reported on 11.1% of returns)
45504:
$12,485
Ohio:
$14,511
(% of AGI for various income ranges: 3.0% for AGIs below $25k, 2.4% for AGIs $25k-50k, 2.2% for AGIs $50k-75k, 3.1% for AGIs $75k-100k, 3.4% for AGIs $100k-200k, 1.5% for AGIs over 200k)
Self-employment retirement plans: $20,200 (reported on 0.9% of returns)
45504:
$20,200
Ohio:
$20,257
(% of AGI for various income ranges: 0.7% for AGIs $100k-200k, 0.9% for AGIs over 200k)
Total itemized deductions: $21,185 (18% of AGI, reported on 28.7% of returns)
Here:
$21,185
State:
$21,278
Here:
18.4% of AGI
State:
18.8% of AGI
(% of AGI for various income ranges: 6.6% for AGIs below $25k, 8.0% for AGIs $25k-50k, 10.7% for AGIs $50k-75k, 11.8% for AGIs $75k-100k, 14.4% for AGIs $100k-200k, 11.8% for AGIs over 200k)
Charity contributions: $4,789 (reported on 22.4% of returns)
Here:
$4,789
State:
$3,943
(% of AGI for various income ranges: 0.5% for AGIs below $25k, 0.9% for AGIs $25k-50k, 1.6% for AGIs $50k-75k, 2.0% for AGIs $75k-100k, 3.0% for AGIs $100k-200k, 2.5% for AGIs over 200k)
Taxes paid: $9,005 (reported on 28.4% of returns)
45504:
$9,005
State:
$9,568
(% of AGI for various income ranges: 1.0% for AGIs below $25k, 2.0% for AGIs $25k-50k, 3.7% for AGIs $50k-75k, 4.5% for AGIs $75k-100k, 6.3% for AGIs $100k-200k, 7.3% for AGIs over 200k)
Earned income credit: $2,294 (reported on 18.6% of returns)
Here:
$2,294
State:
$2,285
(% of AGI for various income ranges: 6.7% for AGIs below $25k, 1.0% for AGIs $25k-50k)
Percentage of individuals using paid preparers for their 2012 taxes: 46.6%
Here:
47%
State:
51%
(% for various income ranges: 41.9% for AGIs below $25k, 48.9% for AGIs $25k-50k, 48.6% for AGIs $50k-75k, 44.9% for AGIs $75k-100k, 51.5% for AGIs $100k-200k, 82.4% for AGIs over 200k)
Averages for the 2004 tax year for zip code 45504, filed in 2005:
Average Adjusted Gross Income (AGI) in 2004: $44,320 (Individual Income Tax Returns)
Here:
$44,320
State:
$44,480
Salary/wage: $37,546 (reported on 83.4% of returns)
Here:
$37,546
State:
$39,198
(% of AGI for various income ranges: 103.3% for AGIs below $10k, 73.0% for AGIs $10k-25k, 76.8% for AGIs $25k-50k, 80.4% for AGIs $50k-75k, 81.0% for AGIs $75k-100k, 55.3% for AGIs over 100k)
Taxable interest for individuals: $1,705 (reported on 42.5% of returns)
This zip code:
$1,705
Ohio:
$1,532
(% of AGI for various income ranges: 5.9% for AGIs below $10k, 2.6% for AGIs $10k-25k, 1.6% for AGIs $25k-50k, 1.2% for AGIs $50k-75k, 1.3% for AGIs $75k-100k, 1.6% for AGIs over 100k)
Taxable dividends: $4,401 (reported on 23.0% of returns)
Here:
$4,401
State:
$3,496
(% of AGI for various income ranges: 4.4% for AGIs below $10k, 1.6% for AGIs $10k-25k, 1.2% for AGIs $25k-50k, 1.1% for AGIs $50k-75k, 1.4% for AGIs $75k-100k, 4.0% for AGIs over 100k)
Net capital gain/loss: +$9,638 (reported on 17.9% of returns)
Here:
+$9,638
State:
+$8,582
(% of AGI for various income ranges: -1.3% for AGIs below $10k, 0.3% for AGIs $10k-25k, 0.4% for AGIs $25k-50k, 1.0% for AGIs $50k-75k, 0.9% for AGIs $75k-100k, 9.9% for AGIs over 100k)
Profit/loss from business: +$16,602 (reported on 12.1% of returns)
Here:
+$16,602
State:
+$10,813
(% of AGI for various income ranges: 3.8% for AGIs below $10k, 3.0% for AGIs $10k-25k, 2.4% for AGIs $25k-50k, 2.0% for AGIs $50k-75k, 2.5% for AGIs $75k-100k, 8.5% for AGIs over 100k)
IRA payment deduction: $3,304 (reported on 2.0% of returns)
45504:
$3,304
Ohio:
$2,794
(% of AGI for various income ranges: 0.2% for AGIs $10k-25k, 0.2% for AGIs $25k-50k, 0.2% for AGIs $50k-75k, 0.2% for AGIs $75k-100k, 0.1% for AGIs over 100k)
Self-employed pension: $14,121 (reported on 1.1% of returns)
Here:
$14,121
Ohio:
$13,981
Total itemized deductions: $17,466 (20% of AGI, reported on 33.3% of returns)
Here:
$17,466
State:
$17,503
Here:
20.1% of AGI
State:
20.8% of AGI
(% of AGI for various income ranges: 11.4% for AGIs below $10k, 6.6% for AGIs $10k-25k, 10.9% for AGIs $25k-50k, 13.6% for AGIs $50k-75k, 15.9% for AGIs $75k-100k, 15.0% for AGIs over 100k)
Charity contributions deductions: $3,827 (4% of AGI, reported on 28.0% of returns)
Here:
$3,827
State:
$3,087
Here:
4.1% of AGI
State:
3.4% of AGI
(% of AGI for various income ranges: 0.6% for AGIs below $10k, 0.6% for AGIs $10k-25k, 1.4% for AGIs $25k-50k, 1.9% for AGIs $50k-75k, 2.6% for AGIs $75k-100k, 3.8% for AGIs over 100k)
Total tax: $7,157 (reported on 73.9% of returns)
45504:
$7,157
State:
$6,781
(% of AGI for various income ranges: 2.7% for AGIs below $10k, 3.9% for AGIs $10k-25k, 7.2% for AGIs $25k-50k, 9.4% for AGIs $50k-75k, 10.8% for AGIs $75k-100k, 19.3% for AGIs over 100k)
Earned income credit: $1,758 (reported on 14.7% of returns)
Here:
$1,758
State:
$1,696
Percentage of individuals using paid preparers for their 2004 taxes: 52.7%
Here:
53%
State:
55%
(% for various income ranges: 45.0% for AGIs below $10k, 56.9% for AGIs $10k-25k, 55.6% for AGIs $25k-50k, 49.4% for AGIs $50k-75k, 48.0% for AGIs $75k-100k, 61.0% for AGIs over 100k)
Household received Food Stamps/SNAP in the past 12 months: 1,183 Household did not receive Food Stamps/SNAP in the past 12 months: 5,136
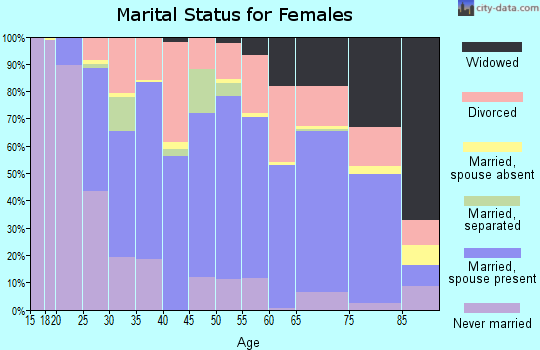
Women who had a birth in the past 12 months: 367 (138 now married, 222 unmarried) Women who did not have a birth in the past 12 months: 3,552 (1,265 now married, 2,287 unmarried)
Housing units in zip code 45504 with a mortgage: 2,813 (224 second mortgage, 11 home equity loan, 167 both second mortgage and home equity loan) Houses without a mortgage: 159
Median monthly owner costs for units with a mortgage: $1,190 Median monthly owner costs for units without a mortgage: $518
Residents with income below the poverty level in 2022:
This zip code:
10.9%
Whole state:
13.4%
Residents with income below 50% of the poverty level in 2022:
This zip code:
4.8%
Whole state:
7.0%
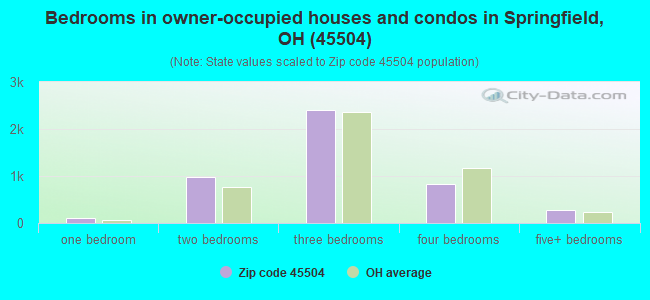
Median number of rooms in houses and condos:
Here:
6.6
State:
6.7
Median number of rooms in apartments:
Here:
4.7
State:
4.4
Notable locations in this zip code not listed on our city pages
Notable locations in zip code 45504: Weaver Observatory (A), Springfield Country Club (B), Snyder Park Golf Course (C), Emergency Medical Transport Station 5 /Strategic Ambulance (D), Eaton Medical Transportation Station 5 (E), Med Trans Emergency Medical Services (F), Medcorp Emergency Medical Services (G), Bayley Auditorium (H), Ohio Masonic Home (I), Thomas Library (J), Springfield Fire and Rescue Division Station 1 Headquarters (K), Clark County Historical Museum (L), Springfield Township Fire and Rescue Station 3 (M), Springfield Fire and Rescue Division Station 5 (N), Zimmerman Hall (O), Woodlawn Residence Hall (P), Tower Residence Hall (Q), Sprecher Hall (R), South Residence Hall (S), Shouvlin Center (T). Display/hide their locations on the map
Shopping Centers: Park Shopping Center (1), Springfield Plaza Shopping Center (2), Western Plaza Shopping Center (3), Upper Valley Mall Shopping Center (4). Display/hide their locations on the map
Churches in zip code 45504 include: Saint Pauls Church (A), Mount Calvary Church (B), First Church of the Brethren (C), Grace Evangelical Lutheran Church (D), Maiden Lane Church of God (E), Zion Evangelical Lutheran Church (F), Bethel Baptist Church (G), Weaver Chapel (H), Saint Theresa Catholic Church (I). Display/hide their locations on the map
Cemeteries: Donnelsville Cemetery (1), Callison Cemetery (2), Ferncliff Cemetery (3), Vale Cemetery (4), Bethel Baptist Cemetery (5), Saint Bernard Cemetery (6). Display/hide their locations on the map
Streams, rivers, and creeks: East Fork Donnels Creek (A), Buck Creek (B), Chapman Creek (C), Dry Run (D), Pondy Creek (E), Miller Creek (F). Display/hide their locations on the map
1,558 married couples with children.
1,302 single-parent households (268 men, 1,034 women).
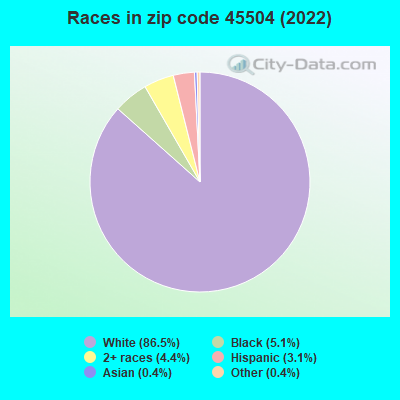
97.1% of residents of 45504 zip code speak English at home.
2.0% of residents speak Spanish at home (65% very well, 28% well, 7% not well).
0.7% of residents speak other Indo-European language at home (83% very well, 2% well, 11% not well, 4% not at all).
0.1% of residents speak Asian or Pacific Island language at home (67% very well, 33% well).
0.1% of residents speak other language at home (100% well).
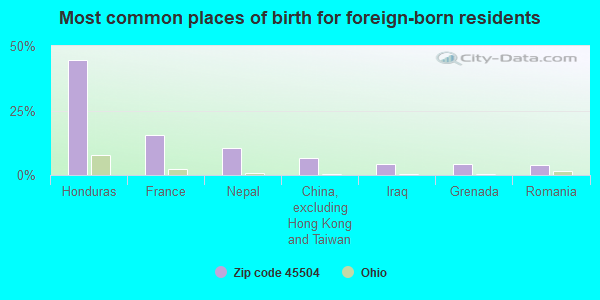
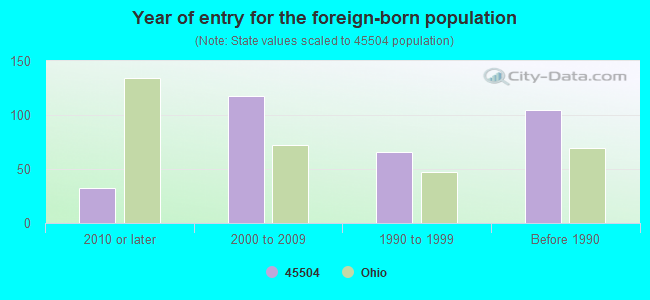
Foreign born population: 297 (1.9%) (51.0% of them are naturalized citizens)
Facilities with environmental interests located in this zip code:
BP OIL CO (2112 WEST MAIN STREET in SPRINGFIELD, OH)
AIR MINOR (AIRS/AFS) CRITERIA AND HAZARDOUS AIR POLLUTANT INVENTORY (Inventory of air pollution sources) STATE MASTER (Ohio general info) - RCRA-OHD987015286, HAZARDOUS WASTE PROGRAM Conditionally Exempt Small Quantity Generators, less than 100 kg/month of hazardous waste (Resource Conservation and Recovery Act (tracking hazardous waste)) - notification Business SIC classification: GASOLINE SERVICE STATIONS Organizations: BP OIL COMPANY (CONTACT/OWNER)
Alternative names: BP AMOCO 09771
ABLE PEST CONTROL (406 WEST MCCREIGHT AVENUE in SPRINGFIELD, OH)
STATE MASTER (Ohio general info) - RCRA-OHD008130106, HAZARDOUS WASTE PROGRAM Large Quantity Generators, more that 1000 kg of hazardous waste/month (Resource Conservation and Recovery Act (tracking hazardous waste)) Organizations: TERMINIX INTERNATIONAL (CONTACT/OPERATOR)
, BERNARD BERGER (CONTACT/OWNER)
Alternative names: TERMINIX INTERNATIONAL
ACE BODY SHOP (1405 W MAIN ST in SPRINGFIELD, OH)
STATE MASTER (Ohio general info) - RCRA-OHR000032185, HAZARDOUS WASTE PROGRAM Conditionally Exempt Small Quantity Generators, less than 100 kg/month of hazardous waste (Resource Conservation and Recovery Act (tracking hazardous waste)) - notification Organizations: ED COGAR (CONTACT/OWNER)
CENTRAL PRINTING SPRINGFIELD (1913 COMMERCE RD in SPRINGFIELD, OH)
STATE MASTER (Ohio general info) - AIR MAJOR, RCRA-OHR000008573, HAZARDOUS WASTE PROGRAM Small Quantity Generators, between 100 kg and 1000 kg of hazardous waste/month (Resource Conservation and Recovery Act (tracking hazardous waste)) - notification Organizations: CENTRAL PRINTING CO (CONTACT/OWNER)
BAISDEN EXCAVATING (3111 ST PARIS PIKE in SPRINGFIELD, OH)
Housing units lacking complete plumbing facilities: 1.1% Housing units lacking complete kitchen facilities: 2.8%
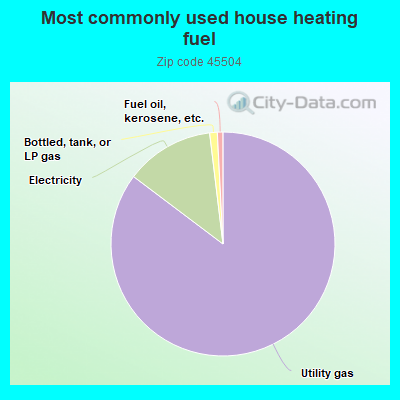
85.2%Utility gas
12.8%Electricity
1.1%Bottled, tank, or LP gas
0.8%Fuel oil, kerosene, etc.
Population in 1990: 19,854. Population change in the 1990s: +253 (+1.3%).
Place of birth for U.S.-born residents:
This state: 12,765
Northeast: 389
Midwest: 916
South: 1,260
West: 345
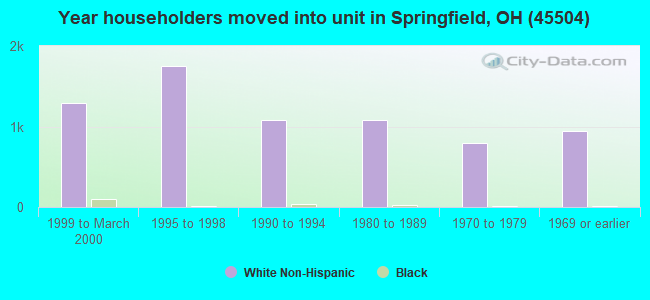
52% of the 45504 zip code residents lived in the same house 5 years ago. Out of people who lived in different houses, 60% lived in this county. Out of people who lived in different counties, 50% lived in Ohio.
88% of the 45504 zip code residents lived in the same house 1 year ago. Out of people who lived in different houses, 56% moved from this county. Out of people who lived in different houses, 26% moved from different county within same state. Out of people who lived in different houses, 15% moved from different state. Out of people who lived in different houses, 2% moved from abroad.
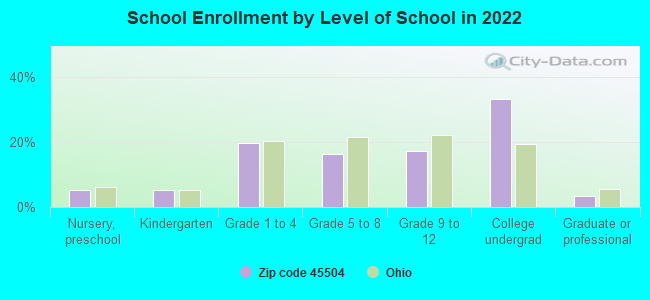
Private vs. public school enrollment:
Students in private schools in grades 1 to 8 (elementary and middle school): 246
Here:
16.2%
Ohio:
16.0%
Students in private schools in grades 9 to 12 (high school): 67
Here:
9.4%
Ohio:
13.1%
Students in private undergraduate colleges: 1,025
Here:
73.7%
Ohio:
22.3%
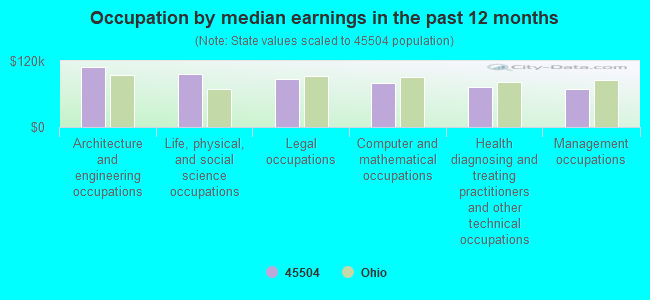
Occupation by median earnings in the past 12 months ($)
109,384Architecture and engineering occupations
95,952Life, physical, and social science occupations
87,891Legal occupations
79,973Computer and mathematical occupations
72,219Health diagnosing and treating practitioners and other technical occupations
68,879Management occupations
Companies with federal contracts located in this zip code (SPRINGFIELD, OH):
FIELD & ASSOC ,INC (2187 W FIRST STREET; small business) : $1,721,936 in 4 contractsfrom 2000 to 2004
$1,673,000 with Air Force for Maintenance, Repair or Alteration of Real Property -- Office Buildings. Signed on 2003-06-06. Completion date: 2004-02-11.
$56,813 with Air Force for Maintenance, Repair or Alteration of Real Property -- Recreational Buildings. Signed on 2004-05-17. Completion date: 2004-05-21.
$0 with Army for Maintenance, Repair or Alteration of Real Property -- Office Buildings. Signed on 2000-12-05. Completion date: 2000-12-04.
-$7,877, same as above.Signed on 2000-12-05. Completion date: 2000-12-04.
COBALT SOLUTIONS LLC (4636 NEW CARLISLE PIKE; small business) : $1,253,512 in 21 contractsfrom 2001 to 2006
Contracts for Physical Sciences -- Management and Support (R&D), Other Defense -- Advanced Development (R&D), Engineering and Technical Services, Other Defense -- Operational Systems Development (R&D), and moreby Air Force, Army, Navy Signed by year:2000: $0; 2001: $134,000; 2002: $0; 2003: $128,745; 2004: $208,709; 2005: $444,493; 2006: $337,565.
Biggest contracts:
$168,638 with Air Force for Physical Sciences -- Management and Support (R&D). Signed on 2006-01-26. Completion date: 2007-05-31.
$168,638, same as above.Signed on 2005-05-19. Completion date: 2007-05-31.
$120,000 with Army for Other Defense -- Advanced Development (R&D). Signed on 2006-05-09. Completion date: 2008-12-30.
$99,790 with Navy for Engineering and Technical Services. Signed on 2004-06-21. Completion date: 2004-12-31.
THE JAMES LEFFEL& CO (1978 COMMERCE CIRCLE; small business) 500 employees, $0 revenue. : $261,545 in 3 contractsfrom 2001 to 2003
$160,660 with U.S. Army Corps of Engineers - civil program financing only for Water Turbines and Water Wheels; and Components. Taking place in OR. Signed on 2002-01-02. Completion date: 2002-03-04.
$90,360, same as above.Signed on 2001-11-15. Completion date: 2002-03-04.
$10,525 with U.S. Army Corps of Engineers - civil program financing only for Maintenance, Repair and Rebuilding of Equipment -- Engines, Turbines, and Components. Taking place in MO. Signed on 2003-08-19. Completion date: 2003-09-23.
W R HACKETT INC (99 W NORTH ST; small business) : $25,121 in 8 contractsfrom 2005 to 2006
Contracts for Fruits and Vegetables by Defense Logistics Agency Signed by year:2000: $0; 2001: $0; 2002: $0; 2003: $0; 2004: $0; 2005: $12,834; 2006: $12,287.
Biggest contracts:
$3,845 with Defense Logistics Agency for Fruits and Vegetables. Signed on 2005-02-11. Completion date: 2005-02-11.
$3,574, same as above.Signed on 2005-01-28. Completion date: 2005-01-28.
$3,501, same as above.Signed on 2006-05-22. Completion date: 2006-05-22.
$3,271, same as above.Signed on 2006-05-08. Completion date: 2006-05-08.
TAYLOR MANUFACTURING COMPANY, (1101 W MAIN ST; small business) : $17,168 in 3 contractsfrom 2004 to 2005
$11,070 with Defense Logistics Agency for Nails, Machine Keys, and Pins. Signed on 2005-02-14. Completion date: 2005-04-24.
$3,051 with Navy for Bushings, Rings, Shims, and Spacers. Signed on 2004-02-27. Completion date: 2004-04-23.
$3,047, same as above.Signed on 2004-06-10. Completion date: 2004-09-08.
BRADLEY WEBB (286 VICTORY RD; small business)
$15,735 with Army for Photographic Projection Equipment. Taking place in VA. Signed on 2004-04-01. Completion date: 2004-04-30.
ASSOCIATES TIRE AND SERVICE, I (721 WEST COLUMBIA ST; small business)
$4,968 with Army for Tires and Tubes, Pneumatic, Except Aircraft. Signed on 2004-09-12. Completion date: 2004-10-11.
L. O.WARNER INC. (141 N. BECHTLE AVE) : $1 in 2 contractsfrom 1999 to 2000
$300,000 with Air Force for Maintenance, Repair and Rebuilding of Equipment -- Refrigeration, Air Conditioning, and Air Circulating Equipment. Signed on 1999-10-01. Completion date: 2000-10-15.
-$299,999, same as above.Signed on 2000-07-25. Completion date: 2000-07-26.
Top industries in this zip code by the number of employees in 2005:
Finance and Insurance: Direct Property and Casualty Insurance Carriers (over 1000 employees: 1 establishment, 1-4 employees: 1 establishment)
Health Care and Social Assistance: General Medical and Surgical Hospitals (over 1000: 1)
2002 - 2018 National Fire Incident Reporting System (NFIRS) incidents
Based on the data from the years 2002 - 2018 the average number of fires per year is 126. The highest number of fire incidents - 167 took place in 2002, and the least - 51 in 2017. The data has a dropping trend.
When looking into fire subcategories, the most reports belonged to: Structure Fires (41.5%), and Outside Fires (36.7%).
Fire incident types reported to NFIRS in Zip Code 45504

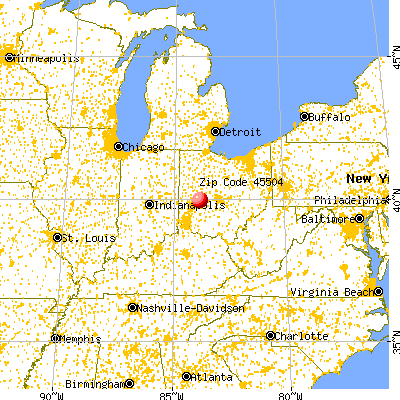


 Nearest zip codes: 45506, 45372, 45319, 45349, 45503, 45323.


 Based on the data from the years 2002 - 2018 the average number of fires per year is 126. The highest number of fire incidents - 167 took place in 2002, and the least - 51 in 2017. The data has a dropping trend.
 When looking into fire subcategories, the most reports belonged to: Structure Fires (41.5%), and Outside Fires (36.7%).