Estimated zip code population in 2022: 2,859 Zip code population in 2010: 2,395 Zip code population in 2000: 2,468
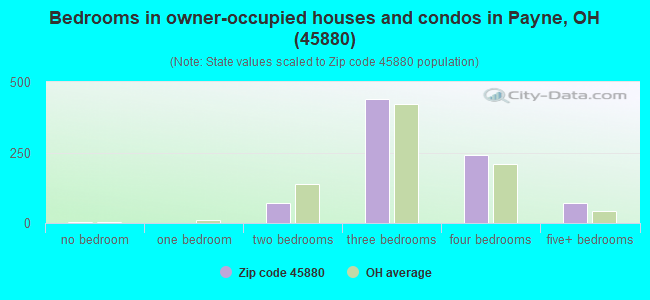
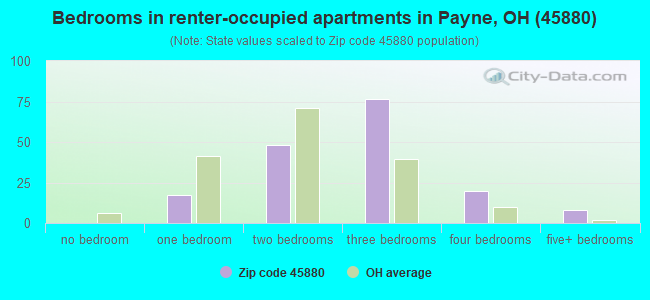
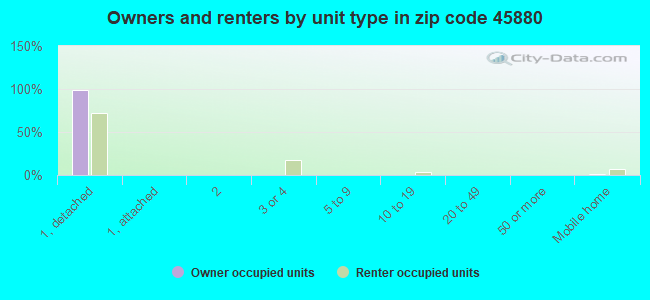
Houses and condos: 1,073 Renter-occupied apartments: 172
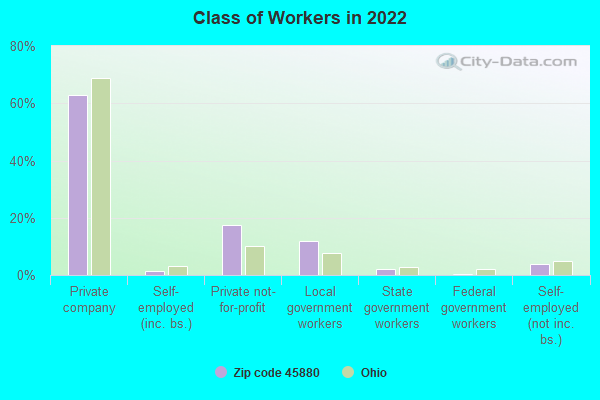
% of renters here:
17%
State:
33%
March 2022 cost of living index in zip code 45880: 82.3 (low, U.S. average is 100)
Land area: 59.2 sq. mi. Water area: 0.0 sq. mi.
Population density: 48 people per square mile
(very low).
OSM Map
General Map
Google Map
MSN Map
OSM Map
General Map
Google Map
MSN Map
OSM Map
General Map
Google Map
MSN Map
OSM Map
General Map
Google Map
MSN Map
Please wait while loading the map...
Real estate property taxes paid for housing units in 2022:
This zip code:
1.0% ($1,381)
Ohio:
1.3% ($2,639)
Median real estate property taxes paid for housing units with mortgages in 2022: $1,585 (1.0%) Median real estate property taxes paid for housing units with no mortgage in 2022: $1,170 (1.1%)
Business Search- 14 Million verified businesses
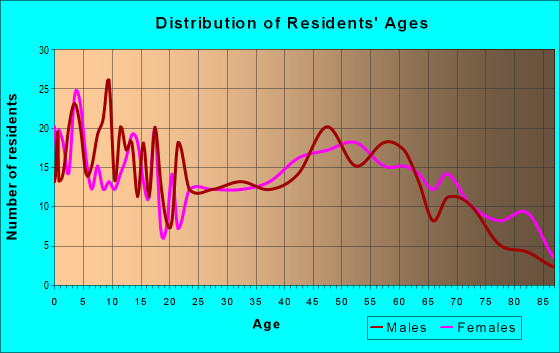
Males: 1,369
(47.9%)
Females: 1,489
(52.1%)
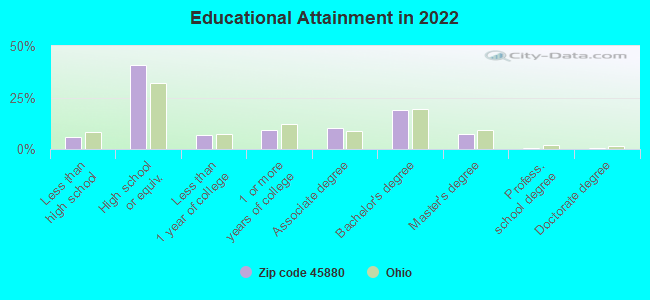
For population 25 years and over in 45880:
High school or higher: 93.4%
Bachelor's degree or higher: 26.9%
Graduate or professional degree: 8.0%
Unemployed: 2.4%
Mean travel time to work (commute): 28.0 minutes
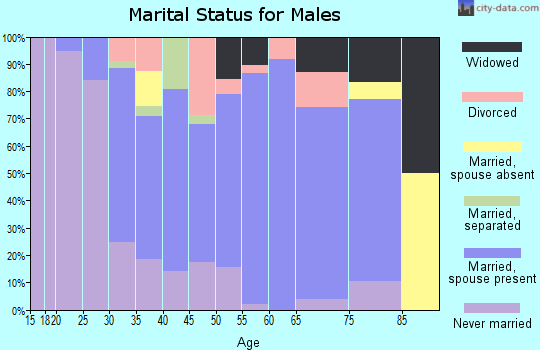
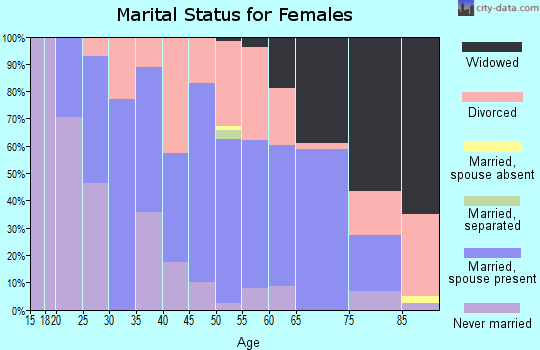
For population 15 years and over in 45880:
Never married: 20.2%
Now married: 59.9%
Separated: 0.9%
Widowed: 4.1%
Divorced: 14.8%
Zip code 45880 compared to state average:
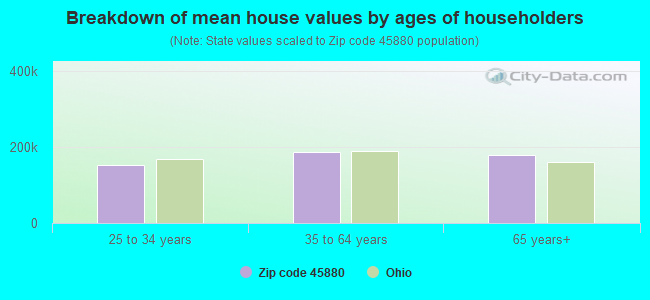
Median house value below state average.
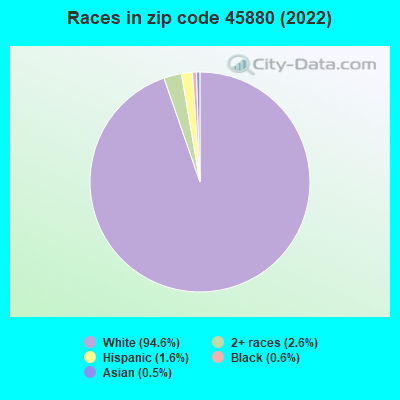
Black race population percentage significantly below state average.
Hispanic race population percentage below state average.
Median age below state average.
Foreign-born population percentage significantly below state average.
Renting percentage below state average.
Length of stay since moving in above state average.
Estimated median house/condo value in 2022: $135,065
45880:
$135,065
Ohio:
$204,100
According to our research of Ohio and other state lists, there were 2 registered sex offenders living in 45880 zip code as of April 26, 2024. The ratio of all residents to sex offenders in zip code 45880 is 1,196 to 1. The ratio of registered sex offenders to all residents in this zip code is lower than the state average.
Median resident age:
This zip code:
33.6 years
Ohio median age:
39.9 years
Average household size:
This zip code:
2.8 people
Ohio:
2.4 people
Averages for the 2020 tax year for zip code 45880, filed in 2021:
Average Adjusted Gross Income (AGI) in 2020: $57,197 (Individual Income Tax Returns)
Here:
$57,197
State:
$67,288
Salary/wage: $48,338 (reported on 81.9% of returns)
Here:
$48,338
State:
$55,628
(% of AGI for various income ranges: 1159.6% for AGIs below $25k, 3640.4% for AGIs $25k-50k, 6321.3% for AGIs $50k-75k, 8905.6% for AGIs $75k-100k, 15585.0% for AGIs $100k-200k)
Taxable interest for individuals: $1,345 (reported on 28.4% of returns)
This zip code:
$1,345
Ohio:
$1,518
(% of AGI for various income ranges: 17.4% for AGIs below $25k, 14.1% for AGIs $25k-50k, 24.0% for AGIs $50k-75k, 73.3% for AGIs $75k-100k, 141.2% for AGIs $100k-200k)
Ordinary dividends: $2,975 (reported on 13.8% of returns)
Here:
$2,975
State:
$7,167
(% of AGI for various income ranges: 14.4% for AGIs $25k-50k, 32.7% for AGIs $50k-75k, 75.6% for AGIs $75k-100k, 400.0% for AGIs $100k-200k)
Net capital gain/loss in AGI: +$3,523 (reported on 11.2% of returns)
Here:
+$3,523
State:
+$18,919
(% of AGI for various income ranges: 31.5% for AGIs $25k-50k, 61.1% for AGIs $75k-100k, 397.5% for AGIs $100k-200k)
Profit/loss from business: +$11,477 (reported on 11.2% of returns)
Here:
+$11,477
State:
+$13,744
(% of AGI for various income ranges: 67.4% for AGIs below $25k, 71.9% for AGIs $25k-50k, 187.3% for AGIs $50k-75k, 1077.5% for AGIs $100k-200k)
Taxable individual retirement arrangement distribution: $13,546 (reported on 11.2% of returns)
45880:
$13,546
Ohio:
$18,876
(% of AGI for various income ranges: 84.3% for AGIs below $25k, 93.0% for AGIs $25k-50k, 460.0% for AGIs $50k-75k, 782.5% for AGIs $100k-200k)
Total itemized deductions: $24,967 (reported on 2.6% of returns)
Here:
$24,967
State:
$33,869
(% of AGI for various income ranges: 832.2% for AGIs $75k-100k)
Charity contributions: $12,650 (reported on 1.7% of returns)
Here:
$12,650
State:
$14,577
(% of AGI for various income ranges: 168.7% for AGIs $50k-75k)
Taxes paid: $5,700 (reported on 2.6% of returns)
45880:
$5,700
State:
$7,681
(% of AGI for various income ranges: 213.8% for AGIs $100k-200k)
Earned income credit: $2,433 (reported on 12.9% of returns)
Here:
$2,433
State:
$2,304
(% of AGI for various income ranges: 97.8% for AGIs below $25k, 51.9% for AGIs $25k-50k)
Percentage of individuals using paid preparers for their 2020 taxes: 97.4%
Here:
97%
State:
94%
(% for various income ranges: 93.9% for AGIs below $25k, 97.1% for AGIs $25k-50k, 100.0% for AGIs $50k-75k, 92.3% for AGIs $75k-100k, 100.0% for AGIs $100k-200k, 150.0% for AGIs over 200k)
Averages for the 2012 tax year for zip code 45880, filed in 2013:
Average Adjusted Gross Income (AGI) in 2012: $49,918 (Individual Income Tax Returns)
Here:
$49,918
State:
$54,926
Salary/wage: $39,772 (reported on 83.0% of returns)
Here:
$39,772
State:
$45,869
(% of AGI for various income ranges: 67.2% for AGIs below $25k, 78.9% for AGIs $25k-50k, 69.6% for AGIs $50k-75k, 76.2% for AGIs $75k-100k, 48.9% for AGIs $100k-200k)
Taxable interest for individuals: $1,156 (reported on 34.8% of returns)
This zip code:
$1,156
Ohio:
$1,297
(% of AGI for various income ranges: 1.4% for AGIs below $25k, 0.6% for AGIs $25k-50k, 0.5% for AGIs $50k-75k, 0.6% for AGIs $75k-100k, 1.2% for AGIs $100k-200k)
Ordinary dividends: $2,095 (reported on 17.0% of returns)
Here:
$2,095
State:
$5,821
(% of AGI for various income ranges: 0.6% for AGIs below $25k, 0.3% for AGIs $25k-50k, 0.3% for AGIs $50k-75k, 0.4% for AGIs $75k-100k, 1.5% for AGIs $100k-200k)
Net capital gain/loss in AGI: +$15,500 (reported on 10.7% of returns)
Here:
+$15,500
State:
+$11,232
(% of AGI for various income ranges: 10.7% for AGIs $100k-200k)
Profit/loss from business: +$5,615 (reported on 11.6% of returns)
Here:
+$5,615
State:
+$12,773
(% of AGI for various income ranges: 4.0% for AGIs below $25k, 1.2% for AGIs $25k-50k, 2.3% for AGIs $50k-75k, 1.4% for AGIs $75k-100k)
Taxable individual retirement arrangement distribution: $9,046 (reported on 11.6% of returns)
45880:
$9,046
Ohio:
$14,511
(% of AGI for various income ranges: 4.3% for AGIs below $25k, 2.1% for AGIs $25k-50k, 2.4% for AGIs $50k-75k, 4.6% for AGIs $75k-100k)
Total itemized deductions: $17,948 (19% of AGI, reported on 20.5% of returns)
Here:
$17,948
State:
$21,278
Here:
18.9% of AGI
State:
18.8% of AGI
(% of AGI for various income ranges: 5.5% for AGIs $25k-50k, 7.0% for AGIs $50k-75k, 8.7% for AGIs $75k-100k, 10.2% for AGIs $100k-200k)
Charity contributions: $4,500 (reported on 16.1% of returns)
Here:
$4,500
State:
$3,943
(% of AGI for various income ranges: 0.6% for AGIs $25k-50k, 0.9% for AGIs $50k-75k, 1.7% for AGIs $75k-100k, 2.7% for AGIs $100k-200k)
Taxes paid: $6,113 (reported on 20.5% of returns)
45880:
$6,113
State:
$9,568
(% of AGI for various income ranges: 1.4% for AGIs $25k-50k, 1.7% for AGIs $50k-75k, 2.9% for AGIs $75k-100k, 4.3% for AGIs $100k-200k)
Earned income credit: $2,040 (reported on 13.4% of returns)
Here:
$2,040
State:
$2,285
(% of AGI for various income ranges: 4.8% for AGIs below $25k, 0.8% for AGIs $25k-50k)
Percentage of individuals using paid preparers for their 2012 taxes: 64.3%
Here:
64%
State:
51%
(% for various income ranges: 54.3% for AGIs below $25k, 68.6% for AGIs $25k-50k, 70.0% for AGIs $50k-75k, 63.6% for AGIs $75k-100k, 72.7% for AGIs $100k-200k)
Averages for the 2004 tax year for zip code 45880, filed in 2005:
Average Adjusted Gross Income (AGI) in 2004: $37,652 (Individual Income Tax Returns)
Here:
$37,652
State:
$44,480
Salary/wage: $33,885 (reported on 86.0% of returns)
Here:
$33,885
State:
$39,198
(% of AGI for various income ranges: 95.8% for AGIs below $10k, 67.8% for AGIs $10k-25k, 80.4% for AGIs $25k-50k, 82.5% for AGIs $50k-75k, 81.2% for AGIs $75k-100k, 60.8% for AGIs over 100k)
Taxable interest for individuals: $1,032 (reported on 44.3% of returns)
This zip code:
$1,032
Ohio:
$1,532
(% of AGI for various income ranges: 5.7% for AGIs below $10k, 3.3% for AGIs $10k-25k, 1.0% for AGIs $25k-50k, 0.7% for AGIs $50k-75k, 1.0% for AGIs $75k-100k, 0.6% for AGIs over 100k)
Taxable dividends: $1,291 (reported on 19.0% of returns)
Here:
$1,291
State:
$3,496
(% of AGI for various income ranges: 1.0% for AGIs below $10k, 0.8% for AGIs $10k-25k, 0.5% for AGIs $25k-50k, 0.3% for AGIs $50k-75k, 0.6% for AGIs $75k-100k, 1.3% for AGIs over 100k)
Net capital gain/loss: +$2,349 (reported on 12.2% of returns)
Here:
+$2,349
State:
+$8,582
(% of AGI for various income ranges: -0.5% for AGIs below $10k, -0.3% for AGIs $10k-25k, 0.3% for AGIs $25k-50k, 0.3% for AGIs $50k-75k, 3.0% for AGIs $75k-100k, 0.6% for AGIs over 100k)
Profit/loss from business: +$7,554 (reported on 12.4% of returns)
Here:
+$7,554
State:
+$10,813
(% of AGI for various income ranges: 6.4% for AGIs below $10k, 2.8% for AGIs $10k-25k, 1.7% for AGIs $25k-50k, 3.1% for AGIs $50k-75k, 4.0% for AGIs $75k-100k)
Profit/loss from farming: +$11,681 (reported on 3.9% of returns)
Here:
+$11,681
State:
-$3,706
IRA payment deduction: $2,737 (reported on 1.6% of returns)
45880:
$2,737
Ohio:
$2,794
Total itemized deductions: $13,510 (20% of AGI, reported on 22.0% of returns)
Here:
$13,510
State:
$17,503
Here:
20.2% of AGI
State:
20.8% of AGI
(% of AGI for various income ranges: 6.3% for AGIs $10k-25k, 6.6% for AGIs $25k-50k, 7.3% for AGIs $50k-75k, 10.9% for AGIs $75k-100k, 10.2% for AGIs over 100k)
Charity contributions deductions: $2,931 (4% of AGI, reported on 17.1% of returns)
Here:
$2,931
State:
$3,087
Here:
4.3% of AGI
State:
3.4% of AGI
(% of AGI for various income ranges: 1.1% for AGIs $10k-25k, 0.9% for AGIs $25k-50k, 1.2% for AGIs $50k-75k, 1.8% for AGIs $75k-100k, 2.3% for AGIs over 100k)
Total tax: $4,548 (reported on 77.2% of returns)
45880:
$4,548
State:
$6,781
(% of AGI for various income ranges: 2.9% for AGIs below $10k, 4.2% for AGIs $10k-25k, 7.3% for AGIs $25k-50k, 8.8% for AGIs $50k-75k, 10.1% for AGIs $75k-100k, 18.8% for AGIs over 100k)
Earned income credit: $1,454 (reported on 10.9% of returns)
Here:
$1,454
State:
$1,696
Percentage of individuals using paid preparers for their 2004 taxes: 63.3%
Here:
63%
State:
55%
(% for various income ranges: 49.1% for AGIs below $10k, 64.9% for AGIs $10k-25k, 68.4% for AGIs $25k-50k, 64.0% for AGIs $50k-75k, 64.3% for AGIs $75k-100k, 82.1% for AGIs over 100k)
Household received Food Stamps/SNAP in the past 12 months: 122 Household did not receive Food Stamps/SNAP in the past 12 months: 873
Women who had a birth in the past 12 months: 30 (11 now married, 18 unmarried) Women who did not have a birth in the past 12 months: 561 (346 now married, 214 unmarried)
Housing units in zip code 45880 with a mortgage: 496 (63 second mortgage, 57 both second mortgage and home equity loan) Houses without a mortgage: 61
Median monthly owner costs for units with a mortgage: $1,071 Median monthly owner costs for units without a mortgage: $450
Residents with income below the poverty level in 2022:
This zip code:
10.0%
Whole state:
13.4%
Residents with income below 50% of the poverty level in 2022:
This zip code:
8.8%
Whole state:
7.0%
Median number of rooms in houses and condos:
Here:
7.1
State:
6.7
Median number of rooms in apartments:
Here:
6.5
State:
4.4
Notable locations in this zip code not listed on our city pages
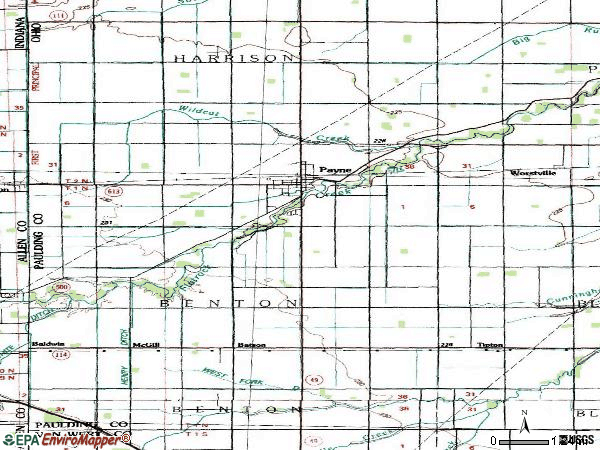
Notable locations in zip code 45880: Pleasant Valley Golf Course (A), Church of God Camp (B), Payne Volunteer Fire and Emergency Medical Services Department (C), Payne Grange Hall (D), Harrison Township Hall (E). Display/hide their locations on the map
Churches in zip code 45880 include: Payne Church of Christ (A), Saint James Lutheran Church (B), Saint Paul United Methodist Church (C), Saint John the Baptist Roman Catholic Church (D), Saint Jacobs Evangelical and Reformed Church (E), Church of God (F). Display/hide their locations on the map
Cemeteries: Snellenbarger Cemetery (1), Wiltsie Cemetery (2), Lehman Cemetery (3), Saint Johns Catholic Cemetery (4). Display/hide their locations on the map
In group quarters: 35 (-1 institutionalized population)
Size of family households: 326 2-persons, 160 3-persons, 164 4-persons, 58 5-persons, 7 6-persons, 47 7-or-more-persons
Size of nonfamily households: 181 1-person, 42 2-persons
434 married couples with children.
267 single-parent households (218 men, 49 women).
98.9% of residents of 45880 zip code speak English at home.
0.2% of residents speak Spanish at home (100% very well).
0.3% of residents speak other Indo-European language at home (89% very well, 11% not well).
0.1% of residents speak Asian or Pacific Island language at home (100% well).
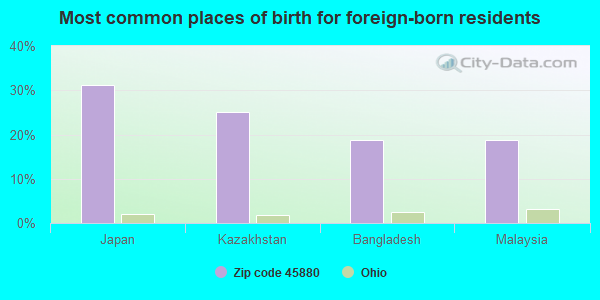
Foreign born population: 16 (0.6%) (75.3% of them are naturalized citizens)
This zip code:
0.6%
Whole state:
5.0%
31%Japan
25%Kazakhstan
19%Bangladesh
19%Malaysia
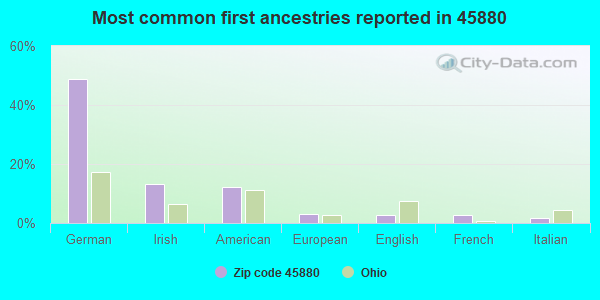
49%German
13%Irish
12%American
3%European
3%English
3%French
2%Italian
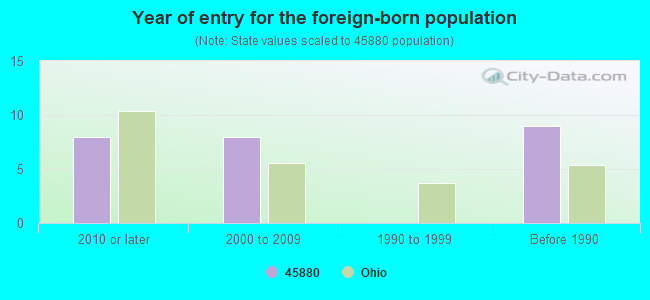
Year of entry for the foreign-born population
82010 or later
82000 to 2009
01990 to 1999
9Before 1990
Facilities with environmental interests located in this zip code:
C & Y OIL CO INC (10722 ST RTE 49 in PAYNE, OH)
STATE MASTER (Ohio general info) - -63-5541-896-2, EPCRA, RCRA-OHD987034071, HAZARDOUS WASTE PROGRAM TRANSPORTER (Resource Conservation and Recovery Act (tracking hazardous waste)) - notification Organizations: YENSER RUSSEL (CONTACT/OWNER)
, RUSSEL YENSER (CONTACT/OWNER)
Housing units lacking complete plumbing facilities: 1.0% Housing units lacking complete kitchen facilities: 1.4%
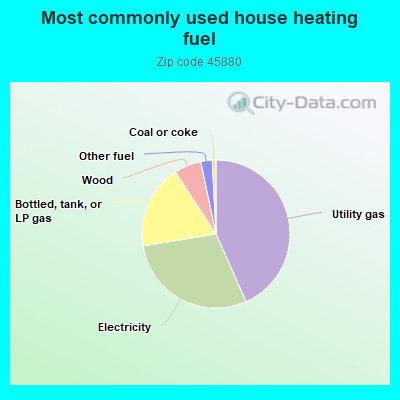
43.4%Utility gas
29.1%Electricity
18.4%Bottled, tank, or LP gas
5.9%Wood
2.5%Other fuel
0.8%Coal or coke
Population in 1990: 2,766.
Place of birth for U.S.-born residents:
This state: 1,798
Northeast: 28
Midwest: 847
South: 119
West: 30
61% of the 45880 zip code residents lived in the same house 5 years ago. Out of people who lived in different houses, 70% lived in this county. Out of people who lived in different counties, 50% lived in Ohio.
88% of the 45880 zip code residents lived in the same house 1 year ago. Out of people who lived in different houses, 43% moved from this county. Out of people who lived in different houses, 24% moved from different county within same state. Out of people who lived in different houses, 33% moved from different state.
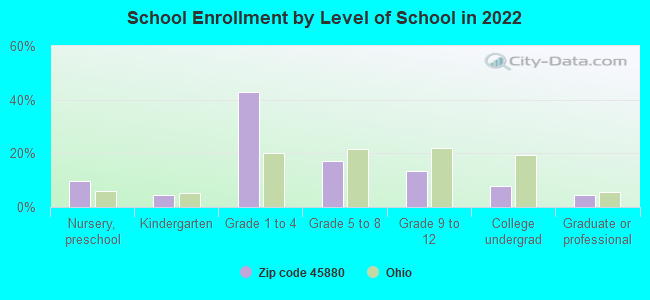
Private vs. public school enrollment:
Students in private schools in grades 1 to 8 (elementary and middle school): 72
Here:
14.9%
Ohio:
16.0%
Students in private schools in grades 9 to 12 (high school): 4
Here:
3.7%
Ohio:
13.1%
Students in private undergraduate colleges: 8
Here:
12.8%
Ohio:
22.3%
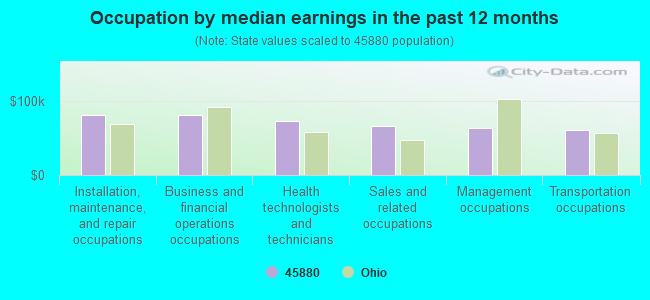
Occupation by median earnings in the past 12 months ($)
81,880Installation, maintenance, and repair occupations
81,206Business and financial operations occupations
73,127Health technologists and technicians
66,366Sales and related occupations
64,112Management occupations
61,620Transportation occupations
Companies with federal contracts located in this zip code:
MARANATHA INDUSTRIES, INC (102 SOUTH MAIN STREET in PAYNE, OH; small business) : $15,921,888 in 31 contractsfrom 2001 to 2006
Contracts for Headsets, Handsets, Microphones and Speakers, Oscillators and Piezoelectric Crystals, Radio and Television Communication Equipment, Except Airborne, Telephone and Telegraph Equipment by Army, Defense Logistics Agency, Bureau of Prisoners/Federal Prison System Signed by year:2000: $0; 2001: $797,150; 2002: $815,742; 2003: $3,136,050; 2004: $6,564,536; 2005: $2,908,410; 2006: $1,700,000.
Biggest contracts:
$1,700,000 with Army for Headsets, Handsets, Microphones and Speakers. Signed on 2006-01-31. Completion date: 2008-09-30.
$1,700,000, same as above.Signed on 2005-06-30. Completion date: 2008-09-30.
$1,699,958, same as above.Signed on 2004-12-21. Completion date: 2009-02-28.
$1,394,000, same as above.Signed on 2004-02-19. Completion date: 2009-02-28.
Top industries in this zip code by the number of employees in 2005:
Health Care and Social Assistance: Nursing Care Facilities (50-99 employees: 1 establishment)
Construction: Drywall and Insulation Contractors (20-49: 1, 10-19: 1)
Health Care and Social Assistance: Community Food Services (20-49: 1)
Wholesale Trade: Grain and Field Bean Merchant Wholesalers (10-19: 1, 1-4: 1)
Construction: Other Building Equipment Contractors (10-19: 1)
Accommodation and Food Services: Limited-Service Restaurants (10-19: 1)
People in group quarters in 2010:
21 people in nursing facilities/skilled-nursing facilities
People in group quarters in 2000:
48 people in nursing homes
2 people in religious group quarters
Fatal accident statistics in 2013:
Fatal accident count: 1
Vehicles involved in fatal accidents: 1
Fatal accidents caused by drunken drivers: 0
Fatalities: 1
Persons involved in fatal accidents: 1
Pedestrians involved in fatal accidents: 0
Fatal accident statistics in 2010:
Fatal accident count: 2
Vehicles involved in fatal accidents: 4
Fatal accidents caused by drunken drivers: 0
Fatalities: 3
Persons involved in fatal accidents: 6
Pedestrians involved in fatal accidents: 0
2002 - 2018 National Fire Incident Reporting System (NFIRS) incidents
According to the data from the years 2002 - 2018 the average number of fire incidents per year is 19. The highest number of fire incidents - 38 took place in 2015, and the least - 10 in 2013. The data has a decreasing trend.
When looking into fire subcategories, the most incidents belonged to: Structure Fires (47.2%), and Outside Fires (38.9%).
Fire incident types reported to NFIRS in Zip Code 45880


+$11,681
-$3,706
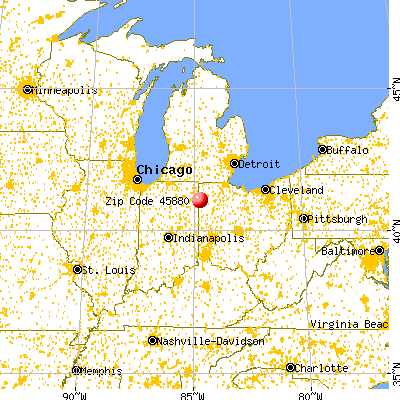
 Nearest zip codes: 45813, 45886, 46797, 45851, 45832, 45855.


 According to the data from the years 2002 - 2018 the average number of fire incidents per year is 19. The highest number of fire incidents - 38 took place in 2015, and the least - 10 in 2013. The data has a decreasing trend.
 When looking into fire subcategories, the most incidents belonged to: Structure Fires (47.2%), and Outside Fires (38.9%).