Estimated zip code population in 2022: 38,558 Zip code population in 2010: 30,309 Zip code population in 2000: 22,790
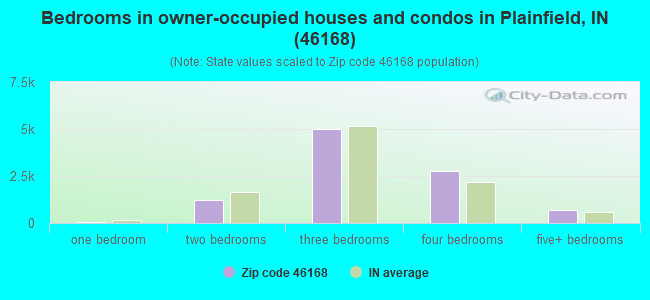
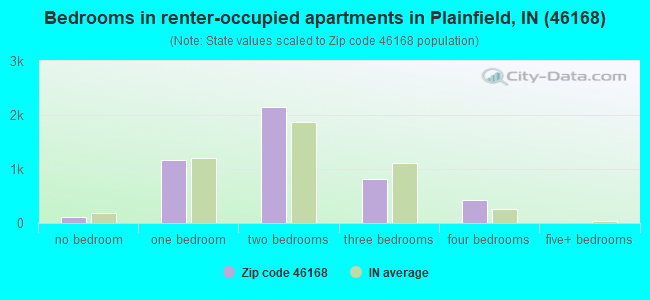
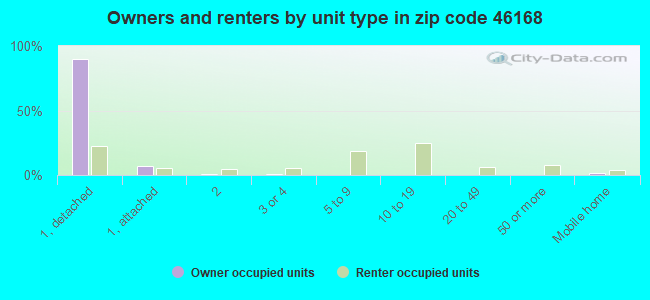
Houses and condos: 14,790 Renter-occupied apartments: 4,629
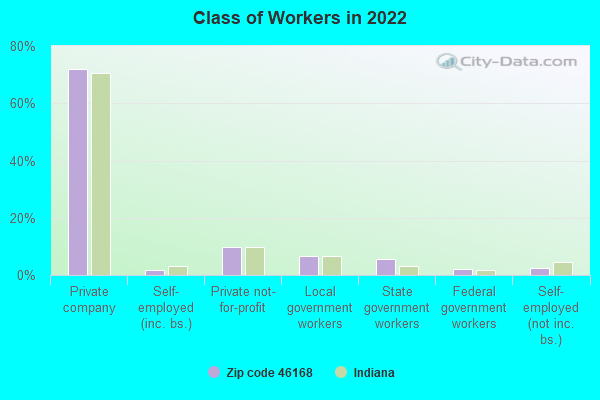
% of renters here:
32%
State:
29%
March 2022 cost of living index in zip code 46168: 88.7 (less than average, U.S. average is 100)
Land area: 32.3 sq. mi. Water area: 0.2 sq. mi.
Population density: 1,195 people per square mile
(low).
OSM Map
General Map
Google Map
MSN Map
OSM Map
General Map
Google Map
MSN Map
OSM Map
General Map
Google Map
MSN Map
OSM Map
General Map
Google Map
MSN Map
Please wait while loading the map...
Real estate property taxes paid for housing units in 2022:
This zip code:
0.7% ($2,109)
Indiana:
0.7% ($1,467)
Median real estate property taxes paid for housing units with mortgages in 2022: $2,197 (0.7%) Median real estate property taxes paid for housing units with no mortgage in 2022: $2,021 (0.8%)
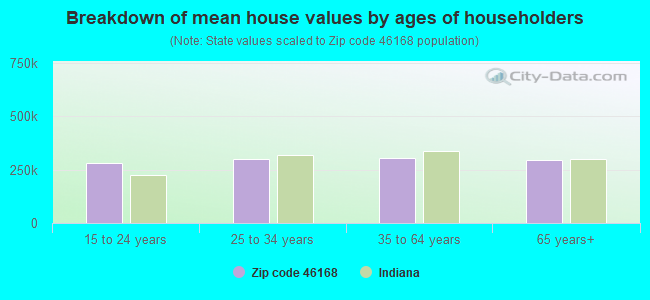
Estimated median house/condo value in 2022: $288,952
46168:
$288,952
Indiana:
$208,700
According to our research of Indiana and other state lists, there were 6 registered sex offenders living in 46168 zip code as of April 27, 2024. The ratio of all residents to sex offenders in zip code 46168 is 5,567 to 1. The ratio of registered sex offenders to all residents in this zip code is much lower than the state average.
Median resident age:
This zip code:
37.2 years
Indiana median age:
38.2 years
Average household size:
This zip code:
2.5 people
Indiana:
2.4 people
Averages for the 2020 tax year for zip code 46168, filed in 2021:
Average Adjusted Gross Income (AGI) in 2020: $71,359 (Individual Income Tax Returns)
Here:
$71,359
State:
$64,978
Salary/wage: $61,877 (reported on 82.4% of returns)
Here:
$61,877
State:
$55,245
(% of AGI for various income ranges: 1085.4% for AGIs below $25k, 3529.8% for AGIs $25k-50k, 6270.9% for AGIs $50k-75k, 8969.7% for AGIs $75k-100k, 17300.0% for AGIs $100k-200k, 62671.2% for AGIs over 200k)
Taxable interest for individuals: $1,081 (reported on 27.2% of returns)
This zip code:
$1,081
Indiana:
$1,351
(% of AGI for various income ranges: 15.5% for AGIs below $25k, 21.1% for AGIs $25k-50k, 25.5% for AGIs $50k-75k, 49.7% for AGIs $75k-100k, 68.4% for AGIs $100k-200k, 559.2% for AGIs over 200k)
Ordinary dividends: $3,740 (reported on 18.2% of returns)
Here:
$3,740
State:
$5,827
(% of AGI for various income ranges: 20.1% for AGIs below $25k, 29.3% for AGIs $25k-50k, 64.1% for AGIs $50k-75k, 110.4% for AGIs $75k-100k, 201.7% for AGIs $100k-200k, 1443.5% for AGIs over 200k)
Net capital gain/loss in AGI: +$16,005 (reported on 16.3% of returns)
Here:
+$16,005
State:
+$17,730
(% of AGI for various income ranges: 5.2% for AGIs below $25k, 15.9% for AGIs $25k-50k, 59.3% for AGIs $50k-75k, 135.4% for AGIs $75k-100k, 442.4% for AGIs $100k-200k, 13614.2% for AGIs over 200k)
Profit/loss from business: +$11,583 (reported on 13.1% of returns)
Here:
+$11,583
State:
+$12,144
(% of AGI for various income ranges: 77.1% for AGIs below $25k, 105.0% for AGIs $25k-50k, 193.4% for AGIs $50k-75k, 233.3% for AGIs $75k-100k, 362.9% for AGIs $100k-200k, 2535.8% for AGIs over 200k)
Taxable individual retirement arrangement distribution: $19,657 (reported on 10.3% of returns)
46168:
$19,657
Indiana:
$18,302
(% of AGI for various income ranges: 55.8% for AGIs below $25k, 103.9% for AGIs $25k-50k, 239.3% for AGIs $50k-75k, 431.9% for AGIs $75k-100k, 679.7% for AGIs $100k-200k, 2465.4% for AGIs over 200k)
Self-employed (Keogh) retirement plans: $20,600 (reported on 0.2% of returns)
46168:
$20,600
Indiana:
$27,160
(% of AGI for various income ranges: 316.9% for AGIs over 200k)
Total itemized deductions: $31,220 (reported on 7.1% of returns)
Here:
$31,220
State:
$35,601
(% of AGI for various income ranges: 46.5% for AGIs below $25k, 102.9% for AGIs $25k-50k, 268.4% for AGIs $50k-75k, 354.0% for AGIs $75k-100k, 706.4% for AGIs $100k-200k, 4006.2% for AGIs over 200k)
Charity contributions: $12,675 (reported on 5.9% of returns)
Here:
$12,675
State:
$15,596
(% of AGI for various income ranges: 2.7% for AGIs below $25k, 28.2% for AGIs $25k-50k, 76.1% for AGIs $50k-75k, 115.0% for AGIs $75k-100k, 242.0% for AGIs $100k-200k, 1763.8% for AGIs over 200k)
Taxes paid: $7,250 (reported on 7.0% of returns)
46168:
$7,250
State:
$7,542
(% of AGI for various income ranges: 5.0% for AGIs below $25k, 13.4% for AGIs $25k-50k, 44.9% for AGIs $50k-75k, 78.5% for AGIs $75k-100k, 200.9% for AGIs $100k-200k, 973.8% for AGIs over 200k)
Earned income credit: $2,079 (reported on 11.7% of returns)
Here:
$2,079
State:
$2,298
(% of AGI for various income ranges: 64.7% for AGIs below $25k, 54.7% for AGIs $25k-50k, 1.0% for AGIs $50k-75k)
Percentage of individuals using paid preparers for their 2020 taxes: 93.7%
Here:
94%
State:
94%
(% for various income ranges: 91.1% for AGIs below $25k, 94.2% for AGIs $25k-50k, 95.0% for AGIs $50k-75k, 94.4% for AGIs $75k-100k, 94.9% for AGIs $100k-200k, 96.1% for AGIs over 200k)
Averages for the 2012 tax year for zip code 46168, filed in 2013:
Average Adjusted Gross Income (AGI) in 2012: $55,468 (Individual Income Tax Returns)
Here:
$55,468
State:
$52,932
Salary/wage: $50,161 (reported on 85.7% of returns)
Here:
$50,161
State:
$45,173
(% of AGI for various income ranges: 73.0% for AGIs below $25k, 79.3% for AGIs $25k-50k, 77.7% for AGIs $50k-75k, 79.1% for AGIs $75k-100k, 83.3% for AGIs $100k-200k, 57.4% for AGIs over 200k)
Taxable interest for individuals: $924 (reported on 30.5% of returns)
This zip code:
$924
Indiana:
$1,311
(% of AGI for various income ranges: 1.1% for AGIs below $25k, 0.6% for AGIs $25k-50k, 0.5% for AGIs $50k-75k, 0.4% for AGIs $75k-100k, 0.4% for AGIs $100k-200k, 0.5% for AGIs over 200k)
Ordinary dividends: $2,734 (reported on 18.5% of returns)
Here:
$2,734
State:
$4,690
(% of AGI for various income ranges: 1.1% for AGIs below $25k, 0.9% for AGIs $25k-50k, 0.8% for AGIs $50k-75k, 0.8% for AGIs $75k-100k, 0.7% for AGIs $100k-200k, 1.8% for AGIs over 200k)
Net capital gain/loss in AGI: +$6,038 (reported on 13.4% of returns)
Here:
+$6,038
State:
+$10,406
(% of AGI for various income ranges: 0.5% for AGIs $50k-75k, 0.4% for AGIs $75k-100k, 1.1% for AGIs $100k-200k, 8.8% for AGIs over 200k)
Profit/loss from business: +$11,701 (reported on 12.6% of returns)
Here:
+$11,701
State:
+$11,105
(% of AGI for various income ranges: 4.7% for AGIs below $25k, 2.6% for AGIs $25k-50k, 1.7% for AGIs $50k-75k, 1.8% for AGIs $75k-100k, 2.2% for AGIs $100k-200k, 5.7% for AGIs over 200k)
Taxable individual retirement arrangement distribution: $13,173 (reported on 11.0% of returns)
46168:
$13,173
Indiana:
$13,841
(% of AGI for various income ranges: 2.9% for AGIs below $25k, 2.4% for AGIs $25k-50k, 3.0% for AGIs $50k-75k, 2.8% for AGIs $75k-100k, 2.4% for AGIs $100k-200k, 2.6% for AGIs over 200k)
Self-employment retirement plans: $16,860 (reported on 0.3% of returns)
46168:
$16,860
Indiana:
$21,482
Total itemized deductions: $18,802 (20% of AGI, reported on 35.1% of returns)
Here:
$18,802
State:
$20,913
Here:
19.7% of AGI
State:
18.2% of AGI
(% of AGI for various income ranges: 7.6% for AGIs below $25k, 9.4% for AGIs $25k-50k, 11.4% for AGIs $50k-75k, 12.9% for AGIs $75k-100k, 13.4% for AGIs $100k-200k, 12.8% for AGIs over 200k)
Charity contributions: $3,673 (reported on 28.8% of returns)
Here:
$3,673
State:
$4,697
(% of AGI for various income ranges: 0.8% for AGIs below $25k, 1.3% for AGIs $25k-50k, 1.7% for AGIs $50k-75k, 2.1% for AGIs $75k-100k, 2.3% for AGIs $100k-200k, 2.5% for AGIs over 200k)
Taxes paid: $6,556 (reported on 35.1% of returns)
46168:
$6,556
State:
$7,456
(% of AGI for various income ranges: 1.4% for AGIs below $25k, 2.3% for AGIs $25k-50k, 3.3% for AGIs $50k-75k, 4.3% for AGIs $75k-100k, 5.5% for AGIs $100k-200k, 5.7% for AGIs over 200k)
Earned income credit: $2,125 (reported on 13.7% of returns)
Here:
$2,125
State:
$2,265
(% of AGI for various income ranges: 5.1% for AGIs below $25k, 1.0% for AGIs $25k-50k)
Percentage of individuals using paid preparers for their 2012 taxes: 46.2%
Here:
46%
State:
53%
(% for various income ranges: 42.5% for AGIs below $25k, 44.8% for AGIs $25k-50k, 49.3% for AGIs $50k-75k, 48.4% for AGIs $75k-100k, 50.8% for AGIs $100k-200k, 61.5% for AGIs over 200k)
Averages for the 2004 tax year for zip code 46168, filed in 2005:
Average Adjusted Gross Income (AGI) in 2004: $49,216 (Individual Income Tax Returns)
Here:
$49,216
State:
$44,790
Salary/wage: $44,196 (reported on 87.1% of returns)
Here:
$44,196
State:
$39,615
(% of AGI for various income ranges: 103.6% for AGIs below $10k, 74.4% for AGIs $10k-25k, 80.6% for AGIs $25k-50k, 81.9% for AGIs $50k-75k, 86.3% for AGIs $75k-100k, 69.8% for AGIs over 100k)
Taxable interest for individuals: $1,421 (reported on 47.1% of returns)
This zip code:
$1,421
Indiana:
$1,535
(% of AGI for various income ranges: 5.4% for AGIs below $10k, 3.0% for AGIs $10k-25k, 1.4% for AGIs $25k-50k, 1.0% for AGIs $50k-75k, 1.0% for AGIs $75k-100k, 1.2% for AGIs over 100k)
Taxable dividends: $2,136 (reported on 23.7% of returns)
Here:
$2,136
State:
$2,998
(% of AGI for various income ranges: 3.0% for AGIs below $10k, 1.1% for AGIs $10k-25k, 1.0% for AGIs $25k-50k, 0.7% for AGIs $50k-75k, 0.6% for AGIs $75k-100k, 1.4% for AGIs over 100k)
Net capital gain/loss: +$8,910 (reported on 17.9% of returns)
Here:
+$8,910
State:
+$8,619
(% of AGI for various income ranges: -0.5% for AGIs below $10k, 0.7% for AGIs $10k-25k, 0.3% for AGIs $25k-50k, 0.7% for AGIs $50k-75k, 1.0% for AGIs $75k-100k, 8.3% for AGIs over 100k)
Profit/loss from business: +$10,607 (reported on 12.2% of returns)
Here:
+$10,607
State:
+$10,071
(% of AGI for various income ranges: 5.0% for AGIs below $10k, 3.3% for AGIs $10k-25k, 2.4% for AGIs $25k-50k, 2.1% for AGIs $50k-75k, 1.9% for AGIs $75k-100k, 3.3% for AGIs over 100k)
IRA payment deduction: $2,964 (reported on 1.7% of returns)
46168:
$2,964
Indiana:
$2,840
(% of AGI for various income ranges: 0.1% for AGIs $10k-25k, 0.1% for AGIs $25k-50k, 0.1% for AGIs $50k-75k, 0.1% for AGIs $75k-100k, 0.1% for AGIs over 100k)
Self-employed pension: $11,467 (reported on 0.5% of returns)
Here:
$11,467
Indiana:
$15,305
(% of AGI for various income ranges: 0.1% for AGIs $50k-75k, 0.1% for AGIs $75k-100k, 0.3% for AGIs over 100k)
Total itemized deductions: $16,481 (20% of AGI, reported on 41.1% of returns)
Here:
$16,481
State:
$17,065
Here:
20.1% of AGI
State:
19.5% of AGI
(% of AGI for various income ranges: 14.7% for AGIs below $10k, 10.1% for AGIs $10k-25k, 11.9% for AGIs $25k-50k, 15.3% for AGIs $50k-75k, 16.3% for AGIs $75k-100k, 13.0% for AGIs over 100k)
Charity contributions deductions: $2,868 (3% of AGI, reported on 35.5% of returns)
Here:
$2,868
State:
$3,550
Here:
3.3% of AGI
State:
3.8% of AGI
(% of AGI for various income ranges: 1.1% for AGIs below $10k, 1.0% for AGIs $10k-25k, 1.5% for AGIs $25k-50k, 2.0% for AGIs $50k-75k, 2.3% for AGIs $75k-100k, 2.5% for AGIs over 100k)
Total tax: $6,860 (reported on 78.9% of returns)
46168:
$6,860
State:
$6,914
(% of AGI for various income ranges: 2.4% for AGIs below $10k, 4.1% for AGIs $10k-25k, 7.0% for AGIs $25k-50k, 8.5% for AGIs $50k-75k, 10.0% for AGIs $75k-100k, 17.0% for AGIs over 100k)
Earned income credit: $1,623 (reported on 10.6% of returns)
Here:
$1,623
State:
$1,685
Percentage of individuals using paid preparers for their 2004 taxes: 52.5%
Here:
52%
State:
59%
(% for various income ranges: 43.7% for AGIs below $10k, 57.2% for AGIs $10k-25k, 53.4% for AGIs $25k-50k, 53.7% for AGIs $50k-75k, 51.4% for AGIs $75k-100k, 55.8% for AGIs over 100k)
Likely homosexual households (counted as self-reported same-sex unmarried-partner households)
Lesbian couples: 0.3% of all households
Gay men: 0.1% of all households
Household received Food Stamps/SNAP in the past 12 months: 746 Household did not receive Food Stamps/SNAP in the past 12 months: 13,659
Women who had a birth in the past 12 months: 943 (653 now married, 289 unmarried) Women who did not have a birth in the past 12 months: 7,903 (3,835 now married, 4,075 unmarried)
Housing units in zip code 46168 with a mortgage: 6,771 (732 second mortgage, 76 home equity loan, 565 both second mortgage and home equity loan) Houses without a mortgage: 262
Median monthly owner costs for units with a mortgage: $1,466 Median monthly owner costs for units without a mortgage: $567
Residents with income below the poverty level in 2022:
This zip code:
6.9%
Whole state:
12.6%
Residents with income below 50% of the poverty level in 2022:
This zip code:
3.2%
Whole state:
6.3%
Median number of rooms in houses and condos:
Here:
6.8
State:
6.6
Median number of rooms in apartments:
Here:
4.1
State:
4.3
Notable locations in this zip code not listed on our city pages
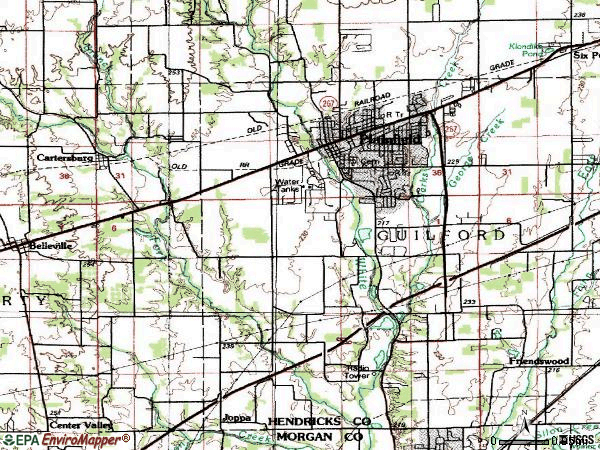
Notable locations in zip code 46168: Oaktree Golf Course (A), Plainfield Industrial Center (B), Plainfield Fire Department (C), Cartersburg Fire Department (D), Indiana Youth Center (E), Plainfield Fire Department Headquarters (F), Plainfield Fire Department Station 122 (G), Plainfield Fire Department Station 121 (H). Display/hide their locations on the map
Churches in zip code 46168 include: First Baptist Church (A), Plainfield United Methodist Church (B), Saint Mark's Episcopal Church (C), Hope United Presbyterian Church (D), Calvary Bible Wesleyan Church (E), Plainfield Friends Meetinghouse (F), New Beginning Church (G), Bethel African Methodist Episcopal Church (H), United Community Church of the Nazarene (I). Display/hide their locations on the map
Cemeteries: Indiana Boy's School Cemetery (1), Maple Hill Cemetery (2), Irons Cemetery (3), Sugar Grove Cemetery (4), Miles Cemetery (5). Display/hide their locations on the map
Streams, rivers, and creeks: West Fork Hendricks Creek (A), Rogers Creek (B), George Creek (C), Friends Creek (D), Cosner Branch (E), Clarks Creek (F), Moore Creek (G), March Creek (H), Black Creek (I). Display/hide their locations on the map
6,248 married couples with children.
1,661 single-parent households (401 men, 1,260 women).
89.6% of residents of 46168 zip code speak English at home.
4.2% of residents speak Spanish at home (73% very well, 21% well, 6% not well).
4.3% of residents speak other Indo-European language at home (63% very well, 14% well, 16% not well, 7% not at all).
1.1% of residents speak Asian or Pacific Island language at home (58% very well, 38% well, 4% not well).
1.0% of residents speak other language at home (33% very well, 54% well, 13% not well).
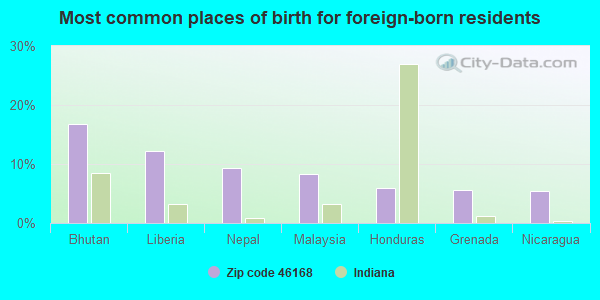
Foreign born population: 2,762 (7.2%) (68.1% of them are naturalized citizens)
This zip code:
7.2%
Whole state:
6.1%
17%Bhutan
12%Liberia
9%Nepal
8%Malaysia
6%Honduras
6%Grenada
5%Nicaragua
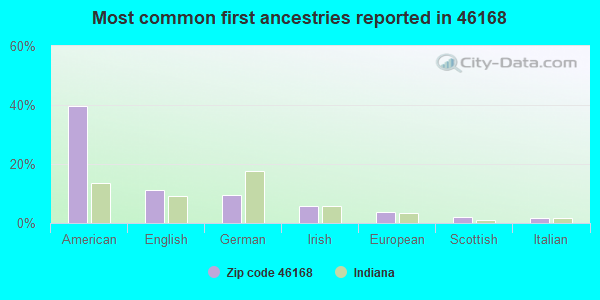
40%American
11%English
9%German
6%Irish
4%European
2%Scottish
2%Italian
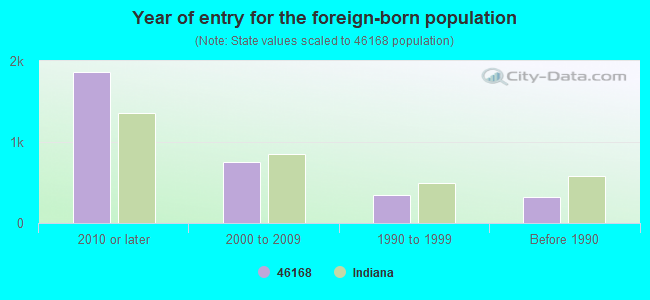
Year of entry for the foreign-born population
1,8632010 or later
7512000 to 2009
3431990 to 1999
327Before 1990
Major facilities with environmental interests located in this zip code:
AVON YARD BIG FOUR YARD (491 S 800 E in PLAINFIELD, IN)
STATE MASTER (Indiana facility tracking) - CRTK-2207, EPCRA, CRTK-23215, CRTK-7391, CRTK-8070, CRTK-9722, LUST-199312558, LEAKING STORAGE TANK, LUST-199510530, LUST-199808516, UST-10903, UNDERGROUND STORAGE TANK PROGRAM National Pollutant Discharge Elimination System NON-MAJOR (Tracking pollutant discharge elimination systems) - permit (Resource Conservation and Recovery Act (tracking hazardous waste)) Conditionally Exempt Small Quantity Generators, less than 100 kg/month of hazardous waste (Resource Conservation and Recovery Act (tracking hazardous waste)) HAZARDOUS WASTE BIENNIAL REPORTER (Resource Conservation and Recovery Act (tracking hazardous waste)) Business SIC classification: RAILROAD SWITCHING AND TERMINAL ESTABLISHMENTS Business NAICS classification: LINE-HAUL RAILROADS. Organizations: DAVID WILLIAM JONES (CONTACT/OPERATOR)
, AVON YARD IN-CSXT (CONTACT/OPERATOR)
, CSX TRANSPORTATION INCORP (CONTACT/OWNER)
, CSX TRANSPORTATION (CONTACT/OWNER)
, CONSOLIDATED RAIL CORP (CONTACT/OWNER)
, CONRAIL (CONTACT/OWNER)
, CSX TRANSPORTATION INC (CONTACT/OWNER)
, CSX TRANSPORTATION, INC. (CONTACT/OWNER)
Alternative names: AVON YARD IN-CSXT, CONRAIL AVON YARD, CONRAIL AVON YARD CAR SHOP, CONRAIL AVON YARD JOURNAL OILER, CONRAIL MATERIAL DIST CTR, CSX TRANSPORTATION INC, CSX TRANSPORTATION, INC.- AVON
PLAINFIELD JUVENILE CORRECTION FACILITY (501 W MAIN ST in PLAINFIELD, IN)
AIR MAJOR (AIRS/AFS) STATE MASTER (Indiana facility tracking) - ACES-OP-06300002, AIR PROGRAM, CRTK-6935, EPCRA, UST-14078, UNDERGROUND STORAGE TANK PROGRAM COMPLIANCE ACTIVITY (Tracking inspections of insecticide, fungicide, and rodenticide, and toxic substances) CRITERIA AND HAZARDOUS AIR POLLUTANT INVENTORY (Inventory of air pollution sources) (Resource Conservation and Recovery Act (tracking hazardous waste)) COMMUNITY WATER SYSTEM (SDWIS) - SDWIS-IN5232007 7306, WATER TREATMENT PLANT Business SIC classification: CORRECTIONAL INSTITUTIONS Organizations: PLAINFIELD JUVENILE CORRECTIONAL FAC (CONTACT/OPERATOR)
, INDIANA STATE OF (CONTACT/OWNER)
Alternative names: CHARLTON INDIANA BOYS SCHOOL 32
PUBLIC SERVICE INDIANA CO (1000 E MAIN ST in PLAINFIELD, IN)
STATE MASTER (Indiana facility tracking) - CRTK-2242, EPCRA, SPILL-198908087, RELEASE ASSESSMENT, SPILL-198909108, SPILL-199906099, UST-10398, UNDERGROUND STORAGE TANK PROGRAM, LUST-198908087, LEAKING STORAGE TANK, LUST-198909108, LUST-199008588, LUST-199210540, LUST-199709523, STATE MASTER (Indiana facility tracking) COMPLIANCE ACTIVITY (Tracking inspections of insecticide, fungicide, and rodenticide, and toxic substances) Small Quantity Generators, between 100 kg and 1000 kg of hazardous waste/month (Resource Conservation and Recovery Act (tracking hazardous waste)) - notification USED OIL PROGRAM (Resource Conservation and Recovery Act (tracking hazardous waste)) (Resource Conservation and Recovery Act (tracking hazardous waste)) Business NAICS classification: FOSSIL FUEL ELECTRIC POWER GENERATION. Organizations: CINERGY/PSI-CORP OFC COMPLEX (CONTACT/OPERATOR)
, PSI ENERGY INC (CONTACT/OWNER)
, PUBLIC SERVICE COMPANY OF INDIANA INC (CONTACT/OWNER)
Alternative names: CINERGY/PSI - CORPORATE OFFICE COMPLEX, PSI, PSI ENERGY
MILESTONE CONTRACTORS (7012 S CR 750 E in PLAINFIELD, IN)
AIR SYNTHETIC MINOR (AIRS/AFS) STATE MASTER (Indiana facility tracking) - CRTK-21145, EPCRA, CRTK-21636, STATE MASTER (Indiana facility tracking) - ACES-CP-06303154, AIR PROGRAM, ACES-CP-2085, ACES-OP-06303154, USED OIL PROGRAM (Resource Conservation and Recovery Act (tracking hazardous waste)) Business SIC classification: ASPHALT PAVING MIXTURES AND BLOCKS Organizations: MILESTONE CONTRACTORS LP (CONTACT/OWNER)
Alternative names: DALTON ASPHALT, MILESTONE CONTRACTORS, L.P., MILESTONE CONTRACTORS LP
AMOCO SERVICE STATION 525 (2068 E HADLEY ROAD in PLAINFIELD, IN)
AIR MINOR (AIRS/AFS) STATE MASTER (Indiana facility tracking) - ACES-OP-06300033, AIR PROGRAM, CRTK-7615, EPCRA, LUST-199007527, LEAKING STORAGE TANK, UST-1061, UNDERGROUND STORAGE TANK PROGRAM (Resource Conservation and Recovery Act (tracking hazardous waste)) Conditionally Exempt Small Quantity Generators, less than 100 kg/month of hazardous waste (Resource Conservation and Recovery Act (tracking hazardous waste)) - notification Business SIC classification: GASOLINE SERVICE STATIONS Organizations: AMOCO OIL COMPANY (CONTACT/OWNER)
, AMOCO OIL (CONTACT/OWNER)
Alternative names: AMOCO 525, GENES STANDARD
CAMPFIELDS AUTO REPAIR (1805 E MAIN ST in PLAINFIELD, IN)
STATE MASTER (Indiana facility tracking) - CRTK-7578, EPCRA, LUST-198911076, LEAKING STORAGE TANK, SPILL-198911076, RELEASE ASSESSMENT, UST-1092, UNDERGROUND STORAGE TANK PROGRAM National Pollutant Discharge Elimination System NON-MAJOR (Tracking pollutant discharge elimination systems) - permit (Resource Conservation and Recovery Act (tracking hazardous waste)) Business SIC classification: GASOLINE SERVICE STATIONS Organizations: MICHAEL W. TODD #16384 (CONTACT/OPERATOR)
, AMOCO OIL CO (CONTACT/OWNER)
, HPE LLC (CONTACT/OWNER)
Alternative names: AMOCO 10067 PLAINFIELD, AMOCO STATION #10067
OAK RITE MFG CORP (701 N CARR RD in PLAINFIELD, IN)
AIR MINOR (AIRS/AFS) STATE MASTER (Indiana facility tracking) - ACES-OP-06300044, AIR PROGRAM, CRTK-1293, EPCRA (Resource Conservation and Recovery Act (tracking hazardous waste)) Business SIC classification: NONCLASSIFIABLE ESTABLISHMENTS Organizations: OAKS RICHARD G AND STEWARD GERALD L (CONTACT/OWNER)
PLAINFIELD WWTP (990 S CENTER ST in PLAINFIELD, IN)
STATE MASTER (Indiana facility tracking) - CRTK-3119, EPCRA National Pollutant Discharge Elimination System MAJOR (Tracking pollutant discharge elimination systems) - permit (Resource Conservation and Recovery Act (tracking hazardous waste)) Business SIC classification: SEWERAGE SYSTEMS Organizations: SCOTT SCHUTTE 15183 (CONTACT/OPERATOR)
, PLAINFIELD TOWN COUNCIL (CONTACT/OWNER)
Alternative names: PLAINFIELD MUNICIPAL STP, PLAINFIELD TOWN OF SEWAGE
PLAINFIELD HIGH SCHOOL (709 STAFFORD RD in PLAINFIELD, IN)
STATE MASTER (Indiana facility tracking) - LUST-199206502, LEAKING STORAGE TANK, UST-8844, UNDERGROUND STORAGE TANK PROGRAM (National Center for Education Statistics) - STATE ID-2749 Organizations: PLAINFIELD COMMUNITY SCH CORP (SCHOOL DISTRICT)
HANNA CHEVROLET GEO INC (704 W MAIN ST in PLAINFIELD, IN)
STATE MASTER (Indiana facility tracking) - UST-22203, UNDERGROUND STORAGE TANK PROGRAM (Resource Conservation and Recovery Act (tracking hazardous waste)) Business NAICS classification: AUTOMOTIVE BODY, PAINT, AND INTERIOR REPAIR AND MAINTENANCE. Organizations: LARKIN'S COLLISION CTR (CONTACT/OPERATOR)
, HANNA DONALD M (CONTACT/OWNER)
, STEVE LARKIN (CONTACT/OWNER)
Alternative names: HANNA CHEVROLET INC
PLAINFIELD REST AREA I 70 (SR I70 & SR 267 JCT 1 MI W in PLAINFIELD, IN)
STATE MASTER (Indiana facility tracking) - IN-NPDES-IN0031526, National Pollutant Discharge Elimination System Permit National Pollutant Discharge Elimination System NON-MAJOR (Tracking pollutant discharge elimination systems) - permit Business SIC classification: REGULATION AND ADMINISTRATION OF TRANSPORTATION PROGRAMS Organizations: MARK GREENWOOD 14276 092703 (CONTACT/OPERATOR)
, PLAINFIELD TOWN HALL (CONTACT/OWNER)
Alternative names: PLAINFIELD REST AREA I-70 WWTP
CVS PHARMACY (1700 E MAIN ST in PLAINFIELD, IN)
STATE MASTER (Indiana facility tracking) - CRTK-4181, EPCRA, LUST-199001516, LEAKING STORAGE TANK, LUST-199307044, LUST-199705523, UST-188, UNDERGROUND STORAGE TANK PROGRAM HAZARDOUS WASTE BIENNIAL REPORTER (Resource Conservation and Recovery Act (tracking hazardous waste)) (Resource Conservation and Recovery Act (tracking hazardous waste)) Organizations: SHELL SVC STA 117183 (CONTACT/OPERATOR)
, EQUILON ENTERPRISES LLC DBA SHELL OIL PR (CONTACT/OWNER)
Alternative names: MUSTERS PLAZA SHELL, SHELL SVC STA 117183
DEERPATH UTILITIES INC (1000 SR 267 in PLAINFIELD, IN)
STATE MASTER (Indiana facility tracking) - CRTK-9396, EPCRA National Pollutant Discharge Elimination System NON-MAJOR (Tracking pollutant discharge elimination systems) - permit Business SIC classification: LAND SUBDIVIDERS AND DEVELOPERS, EXCEPT CEMETERIES Organizations: MARK GREENWOOD 14276 (CONTACT/OPERATOR)
, DEER PATH UTILITIES INC (CONTACT/OWNER)
Alternative names: DEER PATH UTILITIES INC., DEER PATH UTILITES, INC
Housing units lacking complete plumbing facilities: 0.3% Housing units lacking complete kitchen facilities: 1.4%
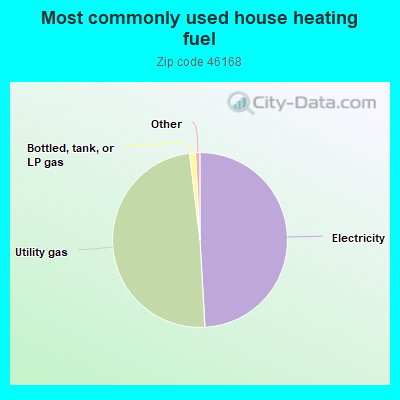
49.1%Electricity
49.0%Utility gas
1.1%Bottled, tank, or LP gas
Population in 1990: 29,182.
Place of birth for U.S.-born residents:
This state: 24,533
Northeast: 867
Midwest: 4,539
South: 3,608
West: 1,929
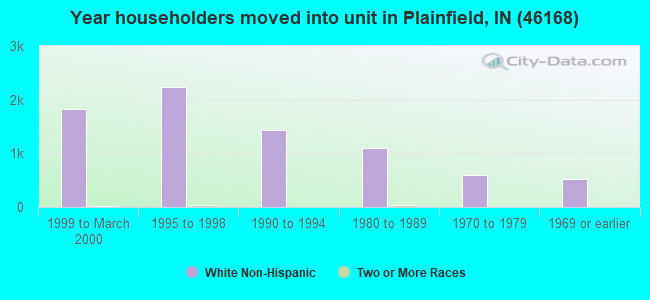
51% of the 46168 zip code residents lived in the same house 5 years ago. Out of people who lived in different houses, 34% lived in this county. Out of people who lived in different counties, 50% lived in Indiana.
82% of the 46168 zip code residents lived in the same house 1 year ago. Out of people who lived in different houses, 37% moved from this county. Out of people who lived in different houses, 41% moved from different county within same state. Out of people who lived in different houses, 20% moved from different state. Out of people who lived in different houses, 1% moved from abroad.
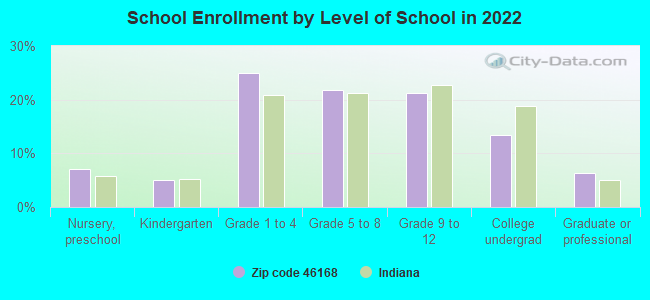
Private vs. public school enrollment:
Students in private schools in grades 1 to 8 (elementary and middle school): 310
Here:
8.0%
Indiana:
14.9%
Students in private schools in grades 9 to 12 (high school): 110
Here:
6.3%
Indiana:
11.4%
Students in private undergraduate colleges: 198
Here:
17.7%
Indiana:
22.3%
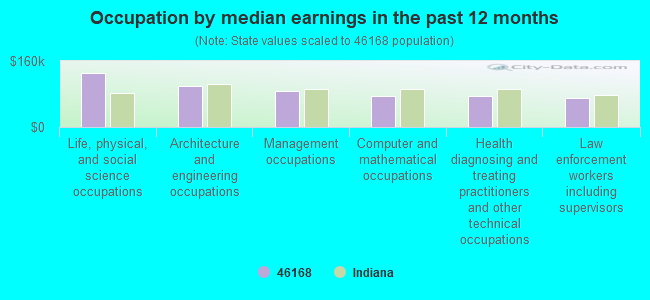
Occupation by median earnings in the past 12 months ($)
130,976Life, physical, and social science occupations
99,771Architecture and engineering occupations
88,188Management occupations
75,076Computer and mathematical occupations
74,466Health diagnosing and treating practitioners and other technical occupations
70,209Law enforcement workers including supervisors
Companies with federal contracts located in this zip code:
WBH INC (164 NORTH MILL STREET in PLAINFIELD, IN; small business) : $674,793 in 17 contractsfrom 2003 to 2006
Contracts for Harvesting Equipment, Packing and Gasket Materials, Aircraft Ground Servicing Equipment, Aircraft Maintenance and Repair Shop Specialized Equipment, and moreby U.S. Coast Guard, Defense Logistics Agency, Navy Signed by year:2000: $0; 2001: $0; 2002: $0; 2003: $129,706; 2004: $349,765; 2005: $125,009; 2006: $70,313.
Biggest contracts:
$95,791 with U.S. Coast Guard for Harvesting Equipment. Taking place in NC. Signed on 2004-10-06. Completion date: 2004-10-21.
$95,791, same as above.Signed on 2004-09-21. Completion date: 2004-12-29.
$70,313 with Defense Logistics Agency for Packing and Gasket Materials. Signed on 2006-01-11. Completion date: 2006-05-12.
$59,650, same as above.Signed on 2003-11-20. Completion date: 2004-03-19.
P S I ENERGY INC (1000 E MAIN ST in PLAINFIELD, IN) : $139,258 in 4 contractsfrom 2003 to 2006
$69,751 with Army for Electric Services. Signed on 2006-03-30. Completion date: 2006-04-30.
$66,071, same as above.Signed on 2006-03-13. Completion date: 2006-04-15.
$2,625, same as above.Signed on 2003-09-26. Completion date: 2004-09-30.
$811 with Bureau of Prisoners/Federal Prison System for Other Utilities. Signed on 2005-02-03. Completion date: 2005-02-14.
PHOTON PRIME, INC (119 S VINE ST in PLAINFIELD, IN; small business)
$100,000 with Air Force for Weapons -- Advanced Development (R&D). Signed on 2002-06-07. Completion date: 2003-05-21.
JANIK ENTERPRISES, INC (1860 STAFFORD ROAD in PLAINFIELD, IN; small business) : $77,594 in 11 contractsfrom 2001 to 2004
Contracts for Construction of Structures and Facilities -- Other Administrative Facilities and Service Buildings, Maintenance, Repair or Alteration of Real Property -- Other Non-Building Facilities, Maintenance, Repair or Alteration of Real Property -- Miscellaneous Buildings, Maintenance, Repair or Alteration of Real Property -- Office Buildings by Army, Navy Signed by year:2000: $0; 2001: $2,000; 2002: $16,959; 2003: $58,160; 2004: $475; 2005: $0; 2006: $0.
Biggest contracts:
$56,100 with Army for Construction of Structures and Facilities -- Other Administrative Facilities and Service Buildings. Signed on 2002-04-24. Completion date: 2002-07-09.
$18,850 with Navy for Maintenance, Repair or Alteration of Real Property -- Other Non-Building Facilities. Signed on 2003-07-01. Completion date: 2003-08-11.
$13,900 with Navy for Maintenance, Repair or Alteration of Real Property -- Miscellaneous Buildings. Signed on 2003-09-09. Completion date: 2003-09-30.
$12,990, same as above.Signed on 2003-08-27. Completion date: 2008-10-11.
ARCANUM PROFESSIONAL SERVICES (7895 FOX RUN PATH in PLAINFIELD, IN; small business) : $24,000 in 3 contractsin 2003
$22,000 with U.S. Army Corps of Engineers - civil program financing only for Architect - Engineer Services (including landscaping, interior layout, and designing). Taking place in KY. Signed on 2003-05-23. Completion date: 2003-05-21.
$1,000 with Army for Architect - Engineer Services (including landscaping, interior layout, and designing). Signed on 2003-10-09. Completion date: 2003-10-09.
$1,000 with U.S. Army Corps of Engineers - civil program financing only for Architect - Engineer Services (including landscaping, interior layout, and designing). Signed on 2003-10-09. Completion date: 2003-10-09.
Tractor Supply Company (129 N Perry Road in Plainfield, IN; small business)
$8,428 with Natural Resources Conservation Service for Vehicular Furniture and Accessories. Signed on 2005-09-30. Completion date: 2006-03-01.
Top industries in this zip code by the number of employees in 2005:
2002 - 2018 National Fire Incident Reporting System (NFIRS) incidents
According to the data from the years 2002 - 2018 the average number of fire incidents per year is 104. The highest number of fire incidents - 182 took place in 2010, and the least - 29 in 2014. The data has a decreasing trend.
When looking into fire subcategories, the most reports belonged to: Structure Fires (44.8%), and Outside Fires (31.4%).
Fire incident types reported to NFIRS in Zip Code 46168


 Nearest zip codes: 46231, 46123, 46113, 46158, 46183, 46241.


 According to the data from the years 2002 - 2018 the average number of fire incidents per year is 104. The highest number of fire incidents - 182 took place in 2010, and the least - 29 in 2014. The data has a decreasing trend.
 When looking into fire subcategories, the most reports belonged to: Structure Fires (44.8%), and Outside Fires (31.4%).