Estimated zip code population in 2022: 4,090 Zip code population in 2010: 4,435 Zip code population in 2000: 4,340
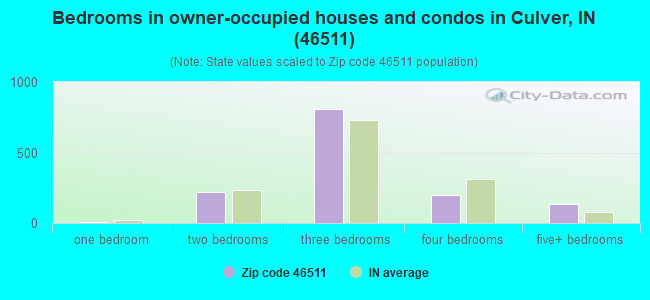
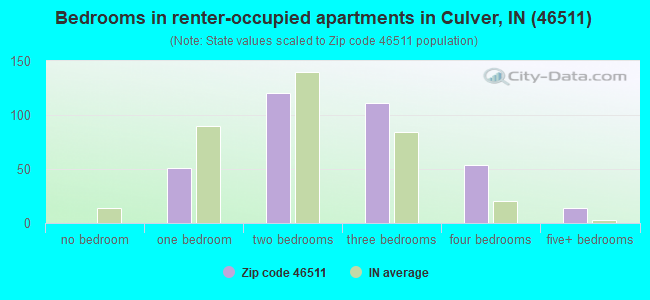
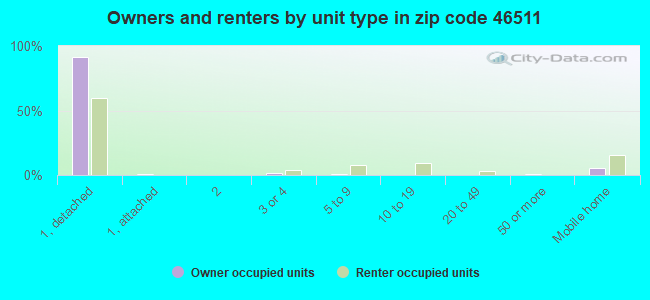
Houses and condos: 2,615 Renter-occupied apartments: 354
% of renters here:
20%
State:
29%
March 2022 cost of living index in zip code 46511: 86.9 (less than average, U.S. average is 100)
Land area: 66.9 sq. mi. Water area: 3.5 sq. mi.
Population density: 61 people per square mile
(very low).
OSM Map
General Map
Google Map
MSN Map
OSM Map
General Map
Google Map
MSN Map
OSM Map
General Map
Google Map
MSN Map
OSM Map
General Map
Google Map
MSN Map
Please wait while loading the map...
Real estate property taxes paid for housing units in 2022:
This zip code:
0.5% ($1,270)
Indiana:
0.7% ($1,467)
Median real estate property taxes paid for housing units with mortgages in 2022: $1,143 (0.5%) Median real estate property taxes paid for housing units with no mortgage in 2022: $1,759 (0.7%)
Estimated median house/condo value in 2022: $242,688
46511:
$242,688
Indiana:
$208,700
According to our research of Indiana and other state lists, there was 1 registered sex offender living in 46511 zip code as of April 27, 2024. The ratio of all residents to sex offenders in zip code 46511 is 4,288 to 1. The ratio of registered sex offenders to all residents in this zip code is much lower than the state average.
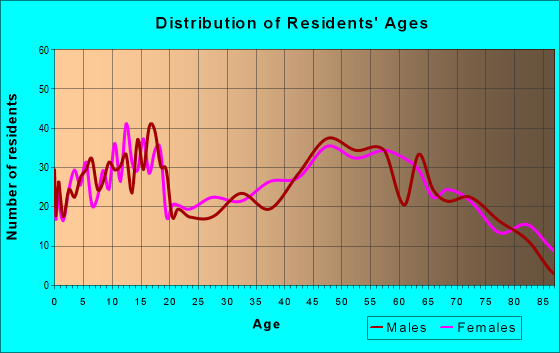
Median resident age:
This zip code:
48.4 years
Indiana median age:
38.2 years
Average household size:
This zip code:
2.3 people
Indiana:
2.4 people
Averages for the 2020 tax year for zip code 46511, filed in 2021:
Average Adjusted Gross Income (AGI) in 2020: $68,108 (Individual Income Tax Returns)
Here:
$68,108
State:
$64,978
Salary/wage: $54,494 (reported on 77.7% of returns)
Here:
$54,494
State:
$55,245
(% of AGI for various income ranges: 1038.3% for AGIs below $25k, 3607.4% for AGIs $25k-50k, 5985.5% for AGIs $50k-75k, 9226.9% for AGIs $75k-100k, 15513.1% for AGIs $100k-200k)
Taxable interest for individuals: $1,429 (reported on 38.1% of returns)
This zip code:
$1,429
Indiana:
$1,351
(% of AGI for various income ranges: 31.1% for AGIs below $25k, 31.1% for AGIs $25k-50k, 38.2% for AGIs $50k-75k, 98.5% for AGIs $75k-100k, 120.0% for AGIs $100k-200k)
Ordinary dividends: $8,614 (reported on 20.8% of returns)
Here:
$8,614
State:
$5,827
(% of AGI for various income ranges: 37.7% for AGIs below $25k, 28.3% for AGIs $25k-50k, 97.3% for AGIs $50k-75k, 228.5% for AGIs $75k-100k, 410.6% for AGIs $100k-200k)
Net capital gain/loss in AGI: +$25,366 (reported on 17.3% of returns)
Here:
+$25,366
State:
+$17,730
(% of AGI for various income ranges: 11.9% for AGIs below $25k, 15.4% for AGIs $25k-50k, 207.7% for AGIs $50k-75k, 66.2% for AGIs $75k-100k, 916.9% for AGIs $100k-200k)
Profit/loss from business: +$10,863 (reported on 13.4% of returns)
Here:
+$10,863
State:
+$12,144
(% of AGI for various income ranges: 92.8% for AGIs below $25k, 98.3% for AGIs $25k-50k, 255.0% for AGIs $50k-75k, 410.8% for AGIs $75k-100k, 394.4% for AGIs $100k-200k)
Taxable individual retirement arrangement distribution: $17,848 (reported on 12.4% of returns)
46511:
$17,848
Indiana:
$18,302
(% of AGI for various income ranges: 65.5% for AGIs below $25k, 116.9% for AGIs $25k-50k, 383.6% for AGIs $50k-75k, 406.2% for AGIs $75k-100k, 820.0% for AGIs $100k-200k)
Total itemized deductions: $37,045 (reported on 5.4% of returns)
Here:
$37,045
State:
$35,601
(% of AGI for various income ranges: 513.6% for AGIs $50k-75k, 529.4% for AGIs $100k-200k)
Charity contributions: $15,233 (reported on 4.5% of returns)
Here:
$15,233
State:
$15,596
(% of AGI for various income ranges: 116.8% for AGIs $50k-75k, 72.5% for AGIs $100k-200k)
Taxes paid: $7,736 (reported on 5.4% of returns)
46511:
$7,736
State:
$7,542
(% of AGI for various income ranges: 103.2% for AGIs $50k-75k, 154.4% for AGIs $100k-200k)
Earned income credit: $2,171 (reported on 13.9% of returns)
Here:
$2,171
State:
$2,298
(% of AGI for various income ranges: 89.1% for AGIs below $25k, 54.0% for AGIs $25k-50k)
Percentage of individuals using paid preparers for their 2020 taxes: 93.6%
Here:
94%
State:
94%
(% for various income ranges: 91.7% for AGIs below $25k, 95.6% for AGIs $25k-50k, 93.5% for AGIs $50k-75k, 94.7% for AGIs $75k-100k, 92.6% for AGIs $100k-200k, 100.0% for AGIs over 200k)
Averages for the 2012 tax year for zip code 46511, filed in 2013:
Average Adjusted Gross Income (AGI) in 2012: $60,306 (Individual Income Tax Returns)
Here:
$60,306
State:
$52,932
Salary/wage: $47,007 (reported on 81.2% of returns)
Here:
$47,007
State:
$45,173
(% of AGI for various income ranges: 66.6% for AGIs below $25k, 81.9% for AGIs $25k-50k, 78.4% for AGIs $50k-75k, 76.8% for AGIs $75k-100k, 66.8% for AGIs $100k-200k, 39.1% for AGIs over 200k)
Taxable interest for individuals: $987 (reported on 39.1% of returns)
This zip code:
$987
Indiana:
$1,311
(% of AGI for various income ranges: 1.6% for AGIs below $25k, 0.5% for AGIs $25k-50k, 0.6% for AGIs $50k-75k, 0.6% for AGIs $75k-100k, 0.7% for AGIs $100k-200k, 0.5% for AGIs over 200k)
Ordinary dividends: $4,989 (reported on 19.3% of returns)
Here:
$4,989
State:
$4,690
(% of AGI for various income ranges: 2.4% for AGIs below $25k, 0.7% for AGIs $25k-50k, 0.7% for AGIs $50k-75k, 1.4% for AGIs $75k-100k, 1.8% for AGIs $100k-200k, 2.2% for AGIs over 200k)
Net capital gain/loss in AGI: +$9,087 (reported on 15.2% of returns)
Here:
+$9,087
State:
+$10,406
(% of AGI for various income ranges: 0.4% for AGIs $50k-75k, 1.3% for AGIs $75k-100k, 3.1% for AGIs $100k-200k, 4.9% for AGIs over 200k)
Profit/loss from business: +$7,822 (reported on 16.2% of returns)
Here:
+$7,822
State:
+$11,105
(% of AGI for various income ranges: 6.3% for AGIs below $25k, 2.2% for AGIs $25k-50k, 1.8% for AGIs $50k-75k, 1.9% for AGIs $75k-100k, 4.2% for AGIs $100k-200k)
Taxable individual retirement arrangement distribution: $12,662 (reported on 13.2% of returns)
46511:
$12,662
Indiana:
$13,841
(% of AGI for various income ranges: 4.6% for AGIs below $25k, 1.7% for AGIs $25k-50k, 3.2% for AGIs $50k-75k, 3.4% for AGIs $75k-100k, 6.7% for AGIs $100k-200k)
Total itemized deductions: $26,131 (17% of AGI, reported on 21.3% of returns)
Here:
$26,131
State:
$20,913
Here:
16.6% of AGI
State:
18.2% of AGI
(% of AGI for various income ranges: 7.3% for AGIs below $25k, 5.7% for AGIs $25k-50k, 8.4% for AGIs $50k-75k, 9.6% for AGIs $75k-100k, 10.8% for AGIs $100k-200k, 10.7% for AGIs over 200k)
Charity contributions: $5,691 (reported on 17.8% of returns)
Here:
$5,691
State:
$4,697
(% of AGI for various income ranges: 0.6% for AGIs below $25k, 0.8% for AGIs $25k-50k, 1.1% for AGIs $50k-75k, 1.8% for AGIs $75k-100k, 2.2% for AGIs $100k-200k, 2.3% for AGIs over 200k)
Taxes paid: $9,610 (reported on 21.3% of returns)
46511:
$9,610
State:
$7,456
(% of AGI for various income ranges: 1.1% for AGIs below $25k, 1.2% for AGIs $25k-50k, 1.9% for AGIs $50k-75k, 2.9% for AGIs $75k-100k, 4.4% for AGIs $100k-200k, 5.3% for AGIs over 200k)
Earned income credit: $2,067 (reported on 15.2% of returns)
Here:
$2,067
State:
$2,265
(% of AGI for various income ranges: 4.8% for AGIs below $25k, 1.1% for AGIs $25k-50k)
Percentage of individuals using paid preparers for their 2012 taxes: 54.8%
Here:
55%
State:
53%
(% for various income ranges: 50.0% for AGIs below $25k, 52.1% for AGIs $25k-50k, 58.6% for AGIs $50k-75k, 58.8% for AGIs $75k-100k, 66.7% for AGIs $100k-200k, 80.0% for AGIs over 200k)
Averages for the 2004 tax year for zip code 46511, filed in 2005:
Average Adjusted Gross Income (AGI) in 2004: $40,072 (Individual Income Tax Returns)
Here:
$40,072
State:
$44,790
Salary/wage: $34,708 (reported on 82.3% of returns)
Here:
$34,708
State:
$39,615
(% of AGI for various income ranges: 93.2% for AGIs below $10k, 68.7% for AGIs $10k-25k, 84.2% for AGIs $25k-50k, 83.0% for AGIs $50k-75k, 81.7% for AGIs $75k-100k, 43.6% for AGIs over 100k)
Taxable interest for individuals: $1,483 (reported on 48.0% of returns)
This zip code:
$1,483
Indiana:
$1,535
(% of AGI for various income ranges: 9.5% for AGIs below $10k, 4.2% for AGIs $10k-25k, 1.4% for AGIs $25k-50k, 0.9% for AGIs $50k-75k, 0.8% for AGIs $75k-100k, 1.9% for AGIs over 100k)
Taxable dividends: $4,650 (reported on 22.0% of returns)
Here:
$4,650
State:
$2,998
(% of AGI for various income ranges: 4.0% for AGIs below $10k, 2.1% for AGIs $10k-25k, 1.4% for AGIs $25k-50k, 1.3% for AGIs $50k-75k, 0.8% for AGIs $75k-100k, 5.6% for AGIs over 100k)
Net capital gain/loss: +$16,182 (reported on 19.3% of returns)
Here:
+$16,182
State:
+$8,619
(% of AGI for various income ranges: -0.5% for AGIs below $10k, 1.6% for AGIs $10k-25k, 1.1% for AGIs $25k-50k, 0.7% for AGIs $50k-75k, 0.3% for AGIs $75k-100k, 26.5% for AGIs over 100k)
Profit/loss from business: +$9,730 (reported on 16.4% of returns)
Here:
+$9,730
State:
+$10,071
(% of AGI for various income ranges: 1.9% for AGIs below $10k, 5.3% for AGIs $10k-25k, 2.4% for AGIs $25k-50k, 3.2% for AGIs $50k-75k, 3.3% for AGIs $75k-100k, 6.1% for AGIs over 100k)
IRA payment deduction: $2,804 (reported on 2.6% of returns)
46511:
$2,804
Indiana:
$2,840
Total itemized deductions: $16,259 (21% of AGI, reported on 25.0% of returns)
Here:
$16,259
State:
$17,065
Here:
21.4% of AGI
State:
19.5% of AGI
(% of AGI for various income ranges: 15.4% for AGIs below $10k, 10.8% for AGIs $10k-25k, 7.8% for AGIs $25k-50k, 10.3% for AGIs $50k-75k, 9.6% for AGIs $75k-100k, 11.8% for AGIs over 100k)
Charity contributions deductions: $3,249 (4% of AGI, reported on 20.7% of returns)
Here:
$3,249
State:
$3,550
Here:
4.0% of AGI
State:
3.8% of AGI
(% of AGI for various income ranges: 0.8% for AGIs below $10k, 1.0% for AGIs $10k-25k, 0.9% for AGIs $25k-50k, 1.2% for AGIs $50k-75k, 1.5% for AGIs $75k-100k, 3.2% for AGIs over 100k)
Total tax: $5,449 (reported on 71.9% of returns)
46511:
$5,449
State:
$6,914
(% of AGI for various income ranges: 2.8% for AGIs below $10k, 4.5% for AGIs $10k-25k, 6.5% for AGIs $25k-50k, 8.3% for AGIs $50k-75k, 10.3% for AGIs $75k-100k, 16.2% for AGIs over 100k)
Earned income credit: $1,788 (reported on 14.4% of returns)
Here:
$1,788
State:
$1,685
Percentage of individuals using paid preparers for their 2004 taxes: 64.5%
Here:
65%
State:
59%
(% for various income ranges: 56.0% for AGIs below $10k, 67.9% for AGIs $10k-25k, 65.7% for AGIs $25k-50k, 65.5% for AGIs $50k-75k, 67.2% for AGIs $75k-100k, 75.9% for AGIs over 100k)
Household received Food Stamps/SNAP in the past 12 months: 145 Household did not receive Food Stamps/SNAP in the past 12 months: 1,580
Women who had a birth in the past 12 months: 7 (8 now married, 0 unmarried) Women who did not have a birth in the past 12 months: 716 (312 now married, 404 unmarried)
Housing units in zip code 46511 with a mortgage: 834 (75 second mortgage, 59 both second mortgage and home equity loan) Houses without a mortgage: 64
Median monthly owner costs for units with a mortgage: $1,135 Median monthly owner costs for units without a mortgage: $521
Residents with income below the poverty level in 2022:
This zip code:
22.5%
Whole state:
12.6%
Residents with income below 50% of the poverty level in 2022:
This zip code:
10.8%
Whole state:
6.3%
Median number of rooms in houses and condos:
Here:
7.2
State:
6.6
Median number of rooms in apartments:
Here:
5.3
State:
4.3
Notable locations in this zip code not listed on our city pages
Cemeteries: Zion Cemetery (1), Cromley Cemetery (2), Washington Cemetery (3), North Union Cemetery (4), Masonic Cemetery (5), Burr Oak Cemetery (6). Display/hide their locations on the map
391 married couples with children.
51 single-parent households (18 men, 33 women).
97.0% of residents of 46511 zip code speak English at home.
1.0% of residents speak Spanish at home (100% very well).
1.7% of residents speak other Indo-European language at home (88% very well, 8% well, 5% not well).
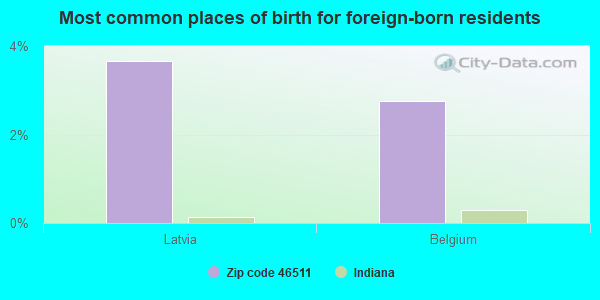
Foreign born population: 112 (2.8%) (96.2% of them are naturalized citizens)
This zip code:
2.8%
Whole state:
6.1%
4%Latvia
3%Belgium
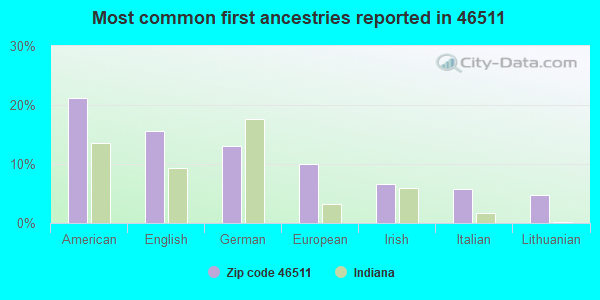
21%American
16%English
13%German
10%European
7%Irish
6%Italian
5%Lithuanian
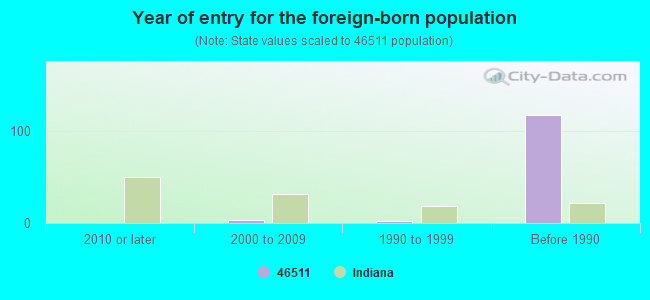
Year of entry for the foreign-born population
02010 or later
32000 to 2009
21990 to 1999
117Before 1990
Major facilities with environmental interests located in this zip code:
CULVER EDUCATIONAL FOUNDATION (1300 ACADEMY RD 148 in CULVER, IN)
STATE MASTER (Indiana facility tracking) - ACES-OP-09900062, AIR PROGRAM, CRTK-385, EPCRA, UST-3233, UNDERGROUND STORAGE TANK PROGRAM COMPLIANCE ACTIVITY (Tracking inspections of insecticide, fungicide, and rodenticide, and toxic substances) Conditionally Exempt Small Quantity Generators, less than 100 kg/month of hazardous waste (Resource Conservation and Recovery Act (tracking hazardous waste)) COMMUNITY WATER SYSTEM (SDWIS) - SDWIS-IN5250004 7433, WATER TREATMENT PLANT Business SIC classification: ELEMENTARY AND SECONDARY SCHOOLS Organizations: THE CULVER EDUCATIONAL FOUNDATION (CONTACT/OPERATOR)
, CULVER EDUCATIONAL FOUNDATION THE (CONTACT/OWNER)
Alternative names: CULVER ACADEMIES, CULVER EDUC FOUNDATION
AT AND T LONG LINES CULVER IND (R R 1 in CULVER, IN)
STATE MASTER (Indiana facility tracking) - CRTK-1133, EPCRA (Resource Conservation and Recovery Act (tracking hazardous waste))
CULVER MUNICIPAL WWTP (1280 HOOSIER LANE in CULVER, IN)
STATE MASTER (Indiana facility tracking) - CRTK-21837, EPCRA National Pollutant Discharge Elimination System NON-MAJOR (Tracking pollutant discharge elimination systems) - permit Business SIC classification: SEWERAGE SYSTEMS Organizations: JOE SHEPPARD CERT OPER (CONTACT/OPERATOR)
, TOWN COUNCIL PRESIDENT (CONTACT/OWNER)
Alternative names: CULVER MUNICIPAL STP, TOWN OF CULVER STP
CULVER MUNICIPAL PROPERTY (610 E LAKE SHORE DR in CULVER, IN)
STATE MASTER (Indiana facility tracking) - LUST-199004546, LEAKING STORAGE TANK, UST-15048, UNDERGROUND STORAGE TANK PROGRAM (Resource Conservation and Recovery Act (tracking hazardous waste)) Organizations: J DICKE AND CO (CONTACT/OWNER)
Alternative names: CULVER TOWN OF, D & M AUTO REPAIR
CULVER ELEMENTARY SCHOOL (401 N SCHOOL in CULVER, IN)
(Geographic Names Information System) (National Center for Education Statistics) - STATE ID-5928 Organizations: CULVER COMMUNITY SCHOOLS CORP (SCHOOL DISTRICT)
CULVER EXPRESS (203 N MAIN ST in CULVER, IN)
STATE MASTER (Indiana facility tracking) - CRTK-5040, EPCRA, UST-2360, UNDERGROUND STORAGE TANK PROGRAM Conditionally Exempt Small Quantity Generators, less than 100 kg/month of hazardous waste (Resource Conservation and Recovery Act (tracking hazardous waste)) - notification Organizations: GOOD OIL CO (CONTACT/OWNER)
Alternative names: AMOCO HARNESS
CULVER COMMUNITY HIGH SCH (701 N SCHOOL in CULVER, IN)
(National Center for Education Statistics) - STATE ID-5245 Organizations: CULVER COMMUNITY SCHOOLS CORP (SCHOOL DISTRICT)
CULVER COMMUNITY MIDDLE SCH (1 CAVALIER DR in CULVER, IN)
(National Center for Education Statistics) - STATE ID-5931 Organizations: CULVER COMMUNITY SCHOOLS CORP (SCHOOL DISTRICT)
A & R BUILDING AMERITRUST BANK (415 LAKESHORE DR in CULVER, IN)
STATE MASTER (Indiana facility tracking) (Resource Conservation and Recovery Act (tracking hazardous waste)) Organizations: A&R BUILDING AMERITRUST BANK (CONTACT/OPERATOR)
, AMERITRUST NATIONAL BANK MICHIGAN (CONTACT/OWNER)
CULVER ACADAMIES GROUNDS DEPT (S SYCAMORE RD AND W 17TH in CULVER, IN)
STATE MASTER (Indiana facility tracking) (Resource Conservation and Recovery Act (tracking hazardous waste))
CULVER TOOL AND ENGINEERING CO (19307 W 17TH RD in CULVER, IN)
STATE MASTER (Indiana facility tracking) (Resource Conservation and Recovery Act (tracking hazardous waste)) Organizations: CULVER TOOL AND ENGINNERING INC (CONTACT/OWNER)
MAOCO FERTILIZER PLANT (HWY 10 & 17 NORTH 1/8 MI in CULVER, IN)
STATE MASTER (Indiana facility tracking) (Resource Conservation and Recovery Act (tracking hazardous waste))
MARSHALL ELECTRIC (514 W MILL ST in CULVER, IN)
STATE MASTER (Indiana facility tracking) (Resource Conservation and Recovery Act (tracking hazardous waste))
Housing units lacking complete plumbing facilities: 1.7% Housing units lacking complete kitchen facilities: 2.1%
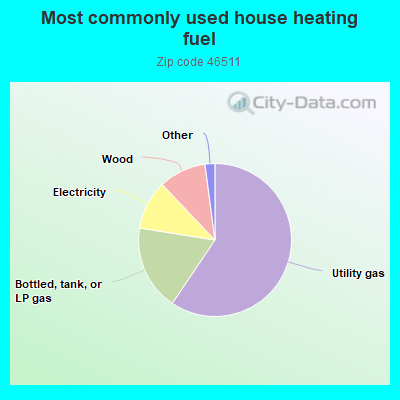
59.5%Utility gas
18.1%Bottled, tank, or LP gas
10.4%Electricity
10.0%Wood
0.8%Other fuel
0.7%Fuel oil, kerosene, etc.
0.7%No fuel used
Population in 1990: 3,289. Population change in the 1990s: +1,051 (+32.0%).
Place of birth for U.S.-born residents:
This state: 2,711
Northeast: 97
Midwest: 593
South: 364
West: 178
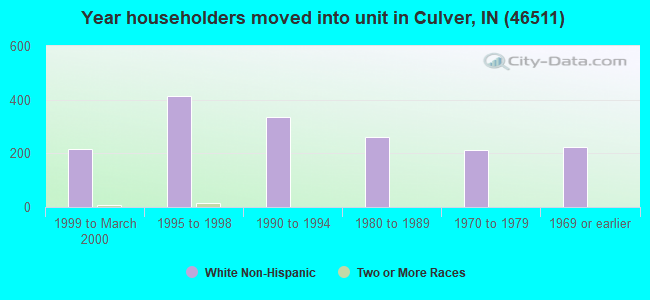
63% of the 46511 zip code residents lived in the same house 5 years ago. Out of people who lived in different houses, 37% lived in this county. Out of people who lived in different counties, 50% lived in Indiana.
93% of the 46511 zip code residents lived in the same house 1 year ago. Out of people who lived in different houses, 40% moved from this county. Out of people who lived in different houses, 35% moved from different county within same state. Out of people who lived in different houses, 20% moved from different state. Out of people who lived in different houses, 10% moved from abroad.
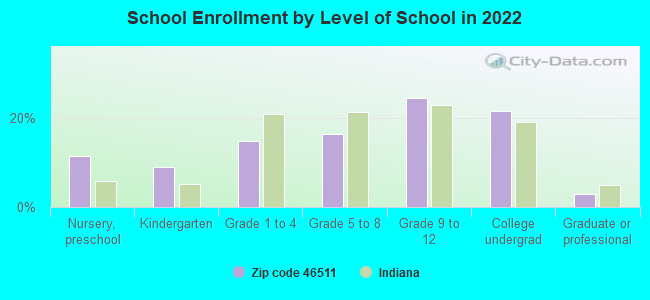
Private vs. public school enrollment:
Students in private schools in grades 1 to 8 (elementary and middle school): 51
Here:
26.4%
Indiana:
14.9%
Students in private schools in grades 9 to 12 (high school): 53
Here:
35.0%
Indiana:
11.4%
Students in private undergraduate colleges: 46
Here:
34.2%
Indiana:
22.3%
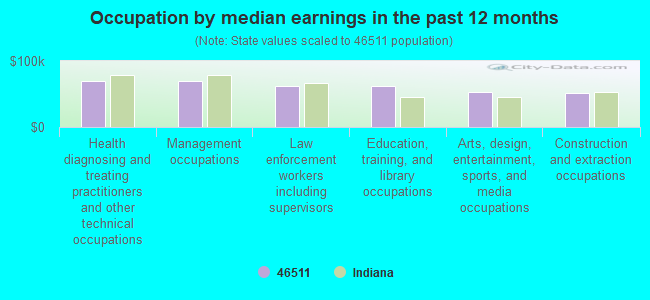
Occupation by median earnings in the past 12 months ($)
69,291Health diagnosing and treating practitioners and other technical occupations
68,954Management occupations
62,447Law enforcement workers including supervisors
62,045Education, training, and library occupations
53,398Arts, design, entertainment, sports, and media occupations
51,350Construction and extraction occupations
Top industries in this zip code by the number of employees in 2005:
Educational Services: Elementary and Secondary Schools (500-999 employees: 1 establishment)
Accommodation and Food Services: Full-Service Restaurants (20-49: 3, 10-19: 2)
Health Care and Social Assistance: Nursing Care Facilities (50-99: 1)
Administrative and Support and Waste Management and Remediation Services: Solid Waste Collection (20-49: 1)
Accommodation and Food Services: Limited-Service Restaurants (10-19: 1, 1-4: 4)
Finance and Insurance: Insurance Agencies and Brokerages (5-9: 2, 1-4: 1)
Construction: Plumbing, Heating, and Air-Conditioning Contractors (5-9: 2, 1-4: 1)
People in group quarters in 2010:
66 people in nursing facilities/skilled-nursing facilities
People in group quarters in 2000:
61 people in nursing homes
7 people in other group homes
3 people in homes or halfway houses for drug/alcohol abuse
2002 - 2018 National Fire Incident Reporting System (NFIRS) incidents
Based on the data from the years 2002 - 2018 the average number of fire incidents per year is 10. The highest number of reported fires - 33 took place in 2004, and the least - 0 in 2014. The data has a decreasing trend.
When looking into fire subcategories, the most incidents belonged to: Outside Fires (46.2%), and Structure Fires (37.4%).
Fire incident types reported to NFIRS in Zip Code 46511
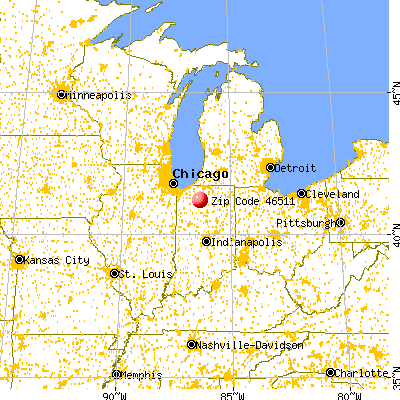


 Nearest zip codes: 46922, 46960, 46968, 46531, 46563, 46501.
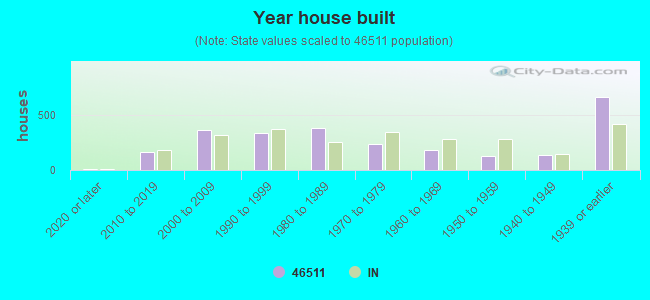


 Based on the data from the years 2002 - 2018 the average number of fire incidents per year is 10. The highest number of reported fires - 33 took place in 2004, and the least - 0 in 2014. The data has a decreasing trend.
 When looking into fire subcategories, the most incidents belonged to: Outside Fires (46.2%), and Structure Fires (37.4%).