Estimated zip code population in 2022: 4,086 Zip code population in 2010: 3,637 Zip code population in 2000: 3,340
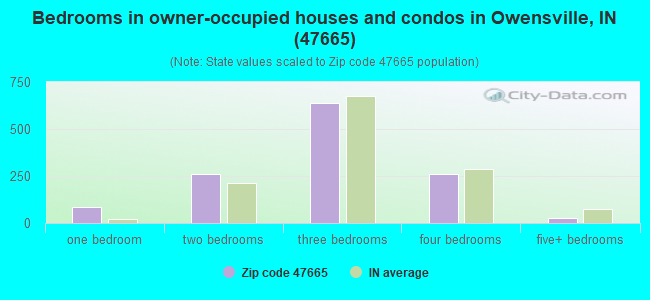
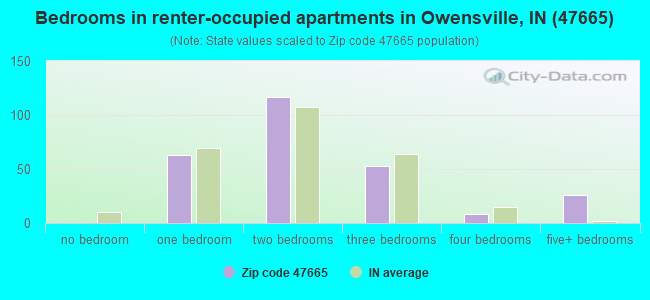
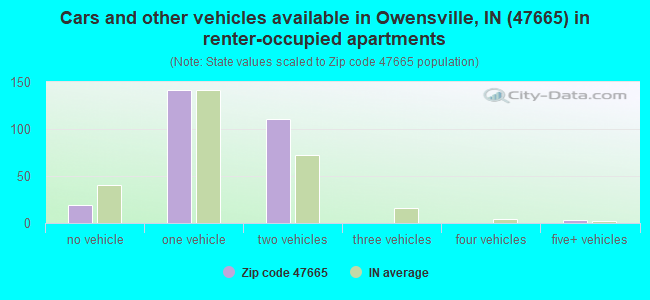
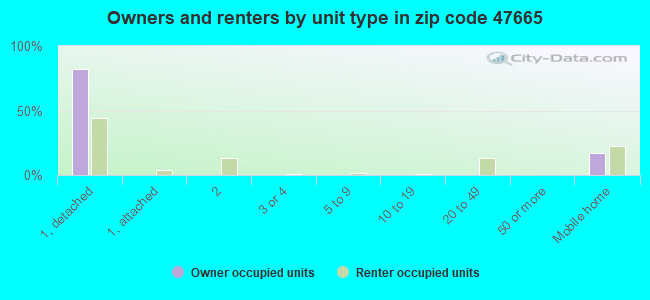
Houses and condos: 1,675 Renter-occupied apartments: 274
% of renters here:
18%
State:
29%
March 2022 cost of living index in zip code 47665: 86.0 (less than average, U.S. average is 100)
Land area: 70.4 sq. mi. Water area: 0.7 sq. mi.
Population density: 58 people per square mile
(very low).
OSM Map
General Map
Google Map
MSN Map
OSM Map
General Map
Google Map
MSN Map
OSM Map
General Map
Google Map
MSN Map
OSM Map
General Map
Google Map
MSN Map
Please wait while loading the map...
Real estate property taxes paid for housing units in 2022:
This zip code:
0.6% ($1,214)
Indiana:
0.7% ($1,467)
Median real estate property taxes paid for housing units with mortgages in 2022: $1,352 (0.6%) Median real estate property taxes paid for housing units with no mortgage in 2022: $990 (0.6%)
Business Search- 14 Million verified businesses
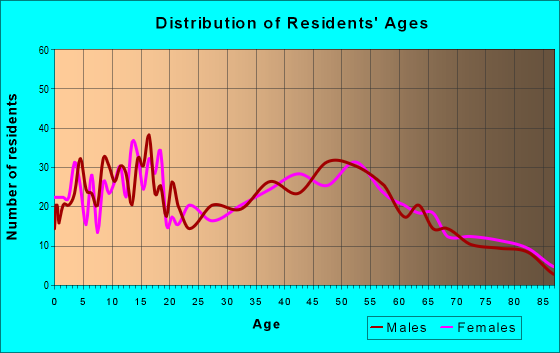
Males: 1,903
(46.6%)
Females: 2,182
(53.4%)
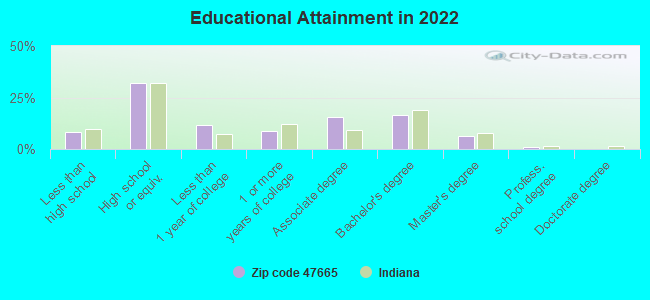
For population 25 years and over in 47665:
High school or higher: 91.5%
Bachelor's degree or higher: 23.6%
Graduate or professional degree: 7.1%
Unemployed: 2.9%
Mean travel time to work (commute): 27.4 minutes
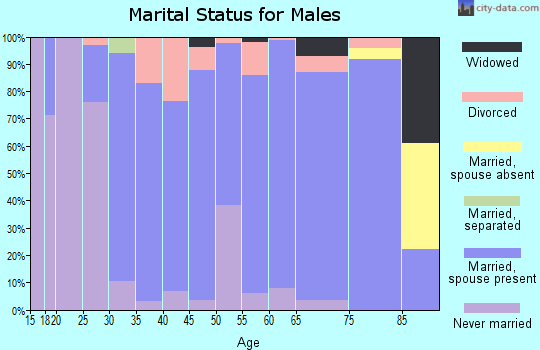
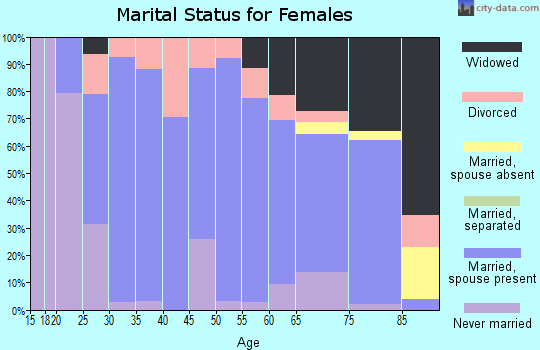
For population 15 years and over in 47665:
Never married: 24.2%
Now married: 58.6%
Separated: 0.4%
Widowed: 4.2%
Divorced: 12.6%
Zip code 47665 compared to state average:
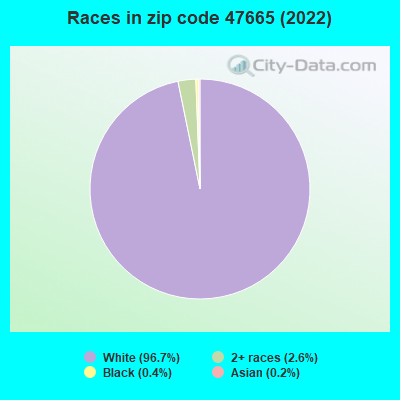
Black race population percentage significantly below state average.
Hispanic race population percentage significantly below state average.
Foreign-born population percentage significantly below state average.
Renting percentage below state average.
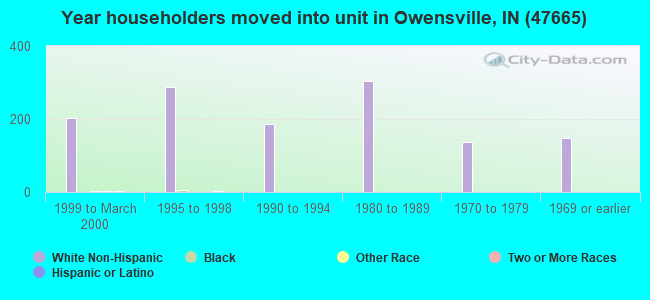
Length of stay since moving in significantly above state average.
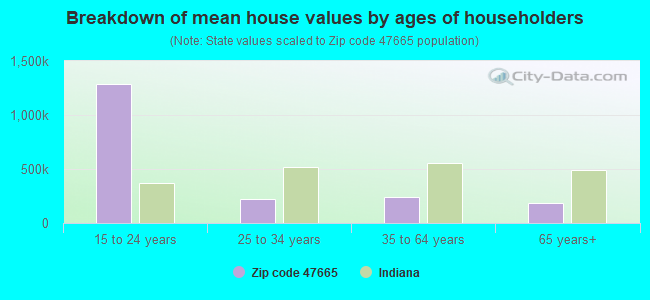
Estimated median house/condo value in 2022: $206,654
47665:
$206,654
Indiana:
$208,700
Median resident age:
This zip code:
39.9 years
Indiana median age:
38.2 years
Average household size:
This zip code:
2.6 people
Indiana:
2.4 people
Averages for the 2020 tax year for zip code 47665, filed in 2021:
Average Adjusted Gross Income (AGI) in 2020: $60,934 (Individual Income Tax Returns)
Here:
$60,934
State:
$64,978
Salary/wage: $54,130 (reported on 84.8% of returns)
Here:
$54,130
State:
$55,245
(% of AGI for various income ranges: 1158.9% for AGIs below $25k, 3560.7% for AGIs $25k-50k, 6487.7% for AGIs $50k-75k, 8761.8% for AGIs $75k-100k, 14722.0% for AGIs $100k-200k)
Taxable interest for individuals: $584 (reported on 25.1% of returns)
This zip code:
$584
Indiana:
$1,351
(% of AGI for various income ranges: 10.0% for AGIs below $25k, 17.7% for AGIs $25k-50k, 23.6% for AGIs $50k-75k, 11.8% for AGIs $75k-100k, 45.5% for AGIs $100k-200k)
Ordinary dividends: $2,481 (reported on 18.1% of returns)
Here:
$2,481
State:
$5,827
(% of AGI for various income ranges: 21.1% for AGIs below $25k, 33.0% for AGIs $25k-50k, 64.1% for AGIs $50k-75k, 56.5% for AGIs $75k-100k, 179.5% for AGIs $100k-200k)
Net capital gain/loss in AGI: +$6,873 (reported on 15.2% of returns)
Here:
+$6,873
State:
+$17,730
(% of AGI for various income ranges: 37.1% for AGIs below $25k, 71.3% for AGIs $25k-50k, 86.8% for AGIs $50k-75k, 85.9% for AGIs $75k-100k, 553.0% for AGIs $100k-200k)
Profit/loss from business: +$11,007 (reported on 8.8% of returns)
Here:
+$11,007
State:
+$12,144
(% of AGI for various income ranges: 49.3% for AGIs $25k-50k, 167.7% for AGIs $50k-75k, 137.6% for AGIs $75k-100k, 450.0% for AGIs $100k-200k)
Taxable individual retirement arrangement distribution: $15,253 (reported on 11.1% of returns)
47665:
$15,253
Indiana:
$18,302
(% of AGI for various income ranges: 65.4% for AGIs below $25k, 93.7% for AGIs $25k-50k, 260.9% for AGIs $50k-75k, 222.9% for AGIs $75k-100k, 717.5% for AGIs $100k-200k)
Total itemized deductions: $28,050 (reported on 2.3% of returns)
Here:
$28,050
State:
$35,601
(% of AGI for various income ranges: 510.0% for AGIs $50k-75k)
Charity contributions: $10,133 (reported on 1.8% of returns)
Here:
$10,133
State:
$15,596
(% of AGI for various income ranges: 138.2% for AGIs $50k-75k)
Taxes paid: $4,850 (reported on 2.3% of returns)
47665:
$4,850
State:
$7,542
(% of AGI for various income ranges: 88.2% for AGIs $50k-75k)
Earned income credit: $2,095 (reported on 12.9% of returns)
Here:
$2,095
State:
$2,298
(% of AGI for various income ranges: 73.4% for AGIs below $25k, 68.0% for AGIs $25k-50k)
Percentage of individuals using paid preparers for their 2020 taxes: 97.7%
Here:
98%
State:
94%
(% for various income ranges: 96.1% for AGIs below $25k, 100.0% for AGIs $25k-50k, 93.5% for AGIs $50k-75k, 100.0% for AGIs $75k-100k, 100.0% for AGIs $100k-200k, 100.0% for AGIs over 200k)
Averages for the 2012 tax year for zip code 47665, filed in 2013:
Average Adjusted Gross Income (AGI) in 2012: $50,028 (Individual Income Tax Returns)
Here:
$50,028
State:
$52,932
Salary/wage: $44,655 (reported on 86.0% of returns)
Here:
$44,655
State:
$45,173
(% of AGI for various income ranges: 72.6% for AGIs below $25k, 81.4% for AGIs $25k-50k, 82.5% for AGIs $50k-75k, 83.1% for AGIs $75k-100k, 67.1% for AGIs $100k-200k)
Taxable interest for individuals: $782 (reported on 26.2% of returns)
This zip code:
$782
Indiana:
$1,311
(% of AGI for various income ranges: 0.7% for AGIs below $25k, 0.5% for AGIs $25k-50k, 0.2% for AGIs $50k-75k, 0.4% for AGIs $75k-100k, 0.4% for AGIs $100k-200k)
Ordinary dividends: $1,881 (reported on 18.0% of returns)
Here:
$1,881
State:
$4,690
(% of AGI for various income ranges: 1.1% for AGIs below $25k, 0.7% for AGIs $25k-50k, 0.3% for AGIs $50k-75k, 0.7% for AGIs $75k-100k, 0.8% for AGIs $100k-200k)
Net capital gain/loss in AGI: +$8,473 (reported on 12.8% of returns)
Here:
+$8,473
State:
+$10,406
(% of AGI for various income ranges: 0.1% for AGIs $50k-75k, 0.9% for AGIs $75k-100k, 6.2% for AGIs $100k-200k)
Profit/loss from business: +$9,685 (reported on 11.6% of returns)
Here:
+$9,685
State:
+$11,105
(% of AGI for various income ranges: 3.4% for AGIs below $25k, 1.9% for AGIs $25k-50k, 1.0% for AGIs $50k-75k, 2.7% for AGIs $75k-100k, 2.7% for AGIs $100k-200k)
Taxable individual retirement arrangement distribution: $11,562 (reported on 9.3% of returns)
47665:
$11,562
Indiana:
$13,841
(% of AGI for various income ranges: 3.8% for AGIs below $25k, 2.2% for AGIs $25k-50k, 3.9% for AGIs $50k-75k, 2.1% for AGIs $100k-200k)
Total itemized deductions: $17,580 (19% of AGI, reported on 20.3% of returns)
Here:
$17,580
State:
$20,913
Here:
19.0% of AGI
State:
18.2% of AGI
(% of AGI for various income ranges: 7.8% for AGIs below $25k, 5.4% for AGIs $25k-50k, 5.7% for AGIs $50k-75k, 6.6% for AGIs $75k-100k, 9.3% for AGIs $100k-200k)
Charity contributions: $4,274 (reported on 13.4% of returns)
Here:
$4,274
State:
$4,697
(% of AGI for various income ranges: 1.2% for AGIs $25k-50k, 0.8% for AGIs $50k-75k, 1.0% for AGIs $75k-100k, 1.7% for AGIs $100k-200k)
Taxes paid: $5,151 (reported on 20.3% of returns)
47665:
$5,151
State:
$7,456
(% of AGI for various income ranges: 0.6% for AGIs below $25k, 1.0% for AGIs $25k-50k, 1.5% for AGIs $50k-75k, 2.0% for AGIs $75k-100k, 3.5% for AGIs $100k-200k)
Earned income credit: $2,080 (reported on 14.5% of returns)
Here:
$2,080
State:
$2,265
(% of AGI for various income ranges: 5.1% for AGIs below $25k, 1.2% for AGIs $25k-50k)
Percentage of individuals using paid preparers for their 2012 taxes: 65.1%
Here:
65%
State:
53%
(% for various income ranges: 59.7% for AGIs below $25k, 69.2% for AGIs $25k-50k, 63.3% for AGIs $50k-75k, 72.7% for AGIs $75k-100k, 68.4% for AGIs $100k-200k)
Averages for the 2004 tax year for zip code 47665, filed in 2005:
Average Adjusted Gross Income (AGI) in 2004: $40,967 (Individual Income Tax Returns)
Here:
$40,967
State:
$44,790
Salary/wage: $38,741 (reported on 87.3% of returns)
Here:
$38,741
State:
$39,615
(% of AGI for various income ranges: 93.1% for AGIs below $10k, 75.6% for AGIs $10k-25k, 85.1% for AGIs $25k-50k, 85.2% for AGIs $50k-75k, 89.2% for AGIs $75k-100k, 71.6% for AGIs over 100k)
Taxable interest for individuals: $1,013 (reported on 41.2% of returns)
This zip code:
$1,013
Indiana:
$1,535
(% of AGI for various income ranges: 6.7% for AGIs below $10k, 1.8% for AGIs $10k-25k, 1.1% for AGIs $25k-50k, 0.4% for AGIs $50k-75k, 0.6% for AGIs $75k-100k, 1.2% for AGIs over 100k)
Taxable dividends: $1,039 (reported on 23.8% of returns)
Here:
$1,039
State:
$2,998
(% of AGI for various income ranges: 1.6% for AGIs below $10k, 1.1% for AGIs $10k-25k, 0.6% for AGIs $25k-50k, 0.5% for AGIs $50k-75k, 0.2% for AGIs $75k-100k, 0.9% for AGIs over 100k)
Net capital gain/loss: +$6,865 (reported on 17.7% of returns)
Here:
+$6,865
State:
+$8,619
(% of AGI for various income ranges: -1.7% for AGIs below $10k, 1.5% for AGIs $10k-25k, 0.7% for AGIs $25k-50k, 1.9% for AGIs $50k-75k, 2.0% for AGIs $75k-100k, 8.7% for AGIs over 100k)
Profit/loss from business: +$5,329 (reported on 10.3% of returns)
Here:
+$5,329
State:
+$10,071
(% of AGI for various income ranges: 8.9% for AGIs below $10k, -0.1% for AGIs $10k-25k, 2.6% for AGIs $25k-50k, 1.6% for AGIs $50k-75k, 0.8% for AGIs $75k-100k, 0.1% for AGIs over 100k)
IRA payment deduction: $2,857 (reported on 1.3% of returns)
47665:
$2,857
Indiana:
$2,840
Total itemized deductions: $14,114 (18% of AGI, reported on 22.7% of returns)
Here:
$14,114
State:
$17,065
Here:
18.3% of AGI
State:
19.5% of AGI
(% of AGI for various income ranges: 10.7% for AGIs below $10k, 4.6% for AGIs $10k-25k, 5.4% for AGIs $25k-50k, 7.0% for AGIs $50k-75k, 9.7% for AGIs $75k-100k, 10.6% for AGIs over 100k)
Charity contributions deductions: $3,124 (4% of AGI, reported on 17.3% of returns)
Here:
$3,124
State:
$3,550
Here:
3.9% of AGI
State:
3.8% of AGI
(% of AGI for various income ranges: 1.0% for AGIs $10k-25k, 0.8% for AGIs $25k-50k, 1.1% for AGIs $50k-75k, 1.5% for AGIs $75k-100k, 2.1% for AGIs over 100k)
Total tax: $5,099 (reported on 75.5% of returns)
47665:
$5,099
State:
$6,914
(% of AGI for various income ranges: 3.0% for AGIs below $10k, 3.7% for AGIs $10k-25k, 6.6% for AGIs $25k-50k, 8.5% for AGIs $50k-75k, 10.0% for AGIs $75k-100k, 15.9% for AGIs over 100k)
Earned income credit: $1,477 (reported on 12.1% of returns)
Here:
$1,477
State:
$1,685
Percentage of individuals using paid preparers for their 2004 taxes: 68.8%
Here:
69%
State:
59%
(% for various income ranges: 61.0% for AGIs below $10k, 70.3% for AGIs $10k-25k, 71.5% for AGIs $25k-50k, 73.0% for AGIs $50k-75k, 65.5% for AGIs $75k-100k, 74.2% for AGIs over 100k)
Household received Food Stamps/SNAP in the past 12 months: 86 Household did not receive Food Stamps/SNAP in the past 12 months: 1,452
Women who had a birth in the past 12 months: 61 (61 now married, 3 unmarried) Women who did not have a birth in the past 12 months: 764 (412 now married, 353 unmarried)
Housing units in zip code 47665 with a mortgage: 719 (31 second mortgage, 32 both second mortgage and home equity loan) Houses without a mortgage: 11
Median monthly owner costs for units with a mortgage: $1,312 Median monthly owner costs for units without a mortgage: $383
Residents with income below the poverty level in 2022:
This zip code:
5.6%
Whole state:
12.6%
Residents with income below 50% of the poverty level in 2022:
This zip code:
2.8%
Whole state:
6.3%
Median number of rooms in houses and condos:
Here:
6.5
State:
6.6
Median number of rooms in apartments:
Here:
4.8
State:
4.3
Notable locations in this zip code not listed on our city pages
Cemeteries: Benson Cemetery (1), Skelton Cemetery (2), Clark Cemetery (3), Oak Grove Cemetery (4), Mauck Cemetery (5). Display/hide their locations on the map
Streams, rivers, and creeks: Seed Run (A), Paper Run (B), Skelton Branch (C), Skelton Creek (D), Smith Run (E), Johnson Drain (F), Owen Run (G), Hand Branch (H), David Run (I). Display/hide their locations on the map
In group quarters: 68 (-1 institutionalized population)
Size of family households: 430 2-persons, 364 3-persons, 173 4-persons, 129 5-persons, 60 6-persons
Size of nonfamily households: 340 1-person, 43 2-persons
806 married couples with children.
101 single-parent households (14 men, 87 women).
98.3% of residents of 47665 zip code speak English at home.
0.3% of residents speak Spanish at home (82% very well, 18% well).
0.3% of residents speak other Indo-European language at home (100% very well).
0.1% of residents speak Asian or Pacific Island language at home (100% well).
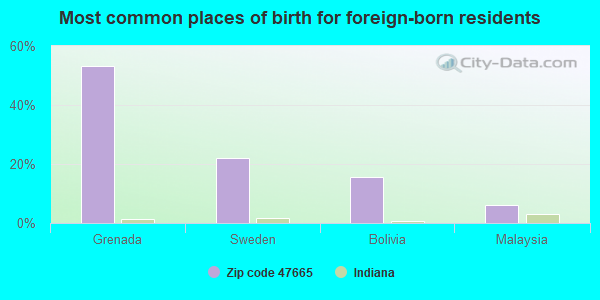
Foreign born population: 33 (0.8%) (64.5% of them are naturalized citizens)
This zip code:
0.8%
Whole state:
6.1%
53%Grenada
22%Sweden
16%Bolivia
6%Malaysia
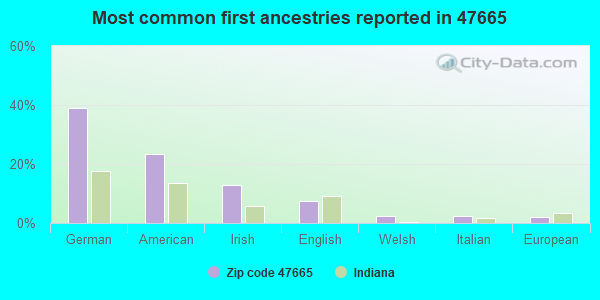
39%German
23%American
13%Irish
7%English
2%Welsh
2%Italian
2%European
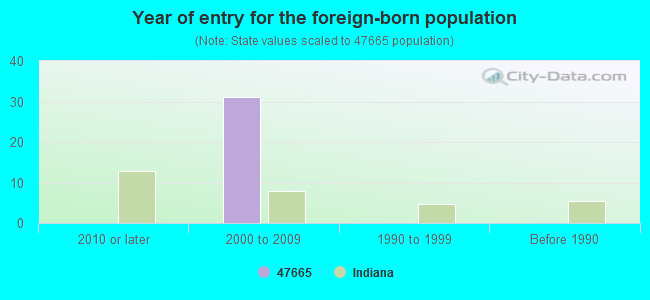
Year of entry for the foreign-born population
02010 or later
312000 to 2009
01990 to 1999
0Before 1990
Facilities with environmental interests located in this zip code:
CONSOLIDATED GRAIN & BARGE-JOHNSON (RR 1 JOHNSON in OWENSVILLE, IN)
STATE MASTER (Indiana facility tracking) - ACES-OP-05100030, AIR PROGRAM CRITERIA AND HAZARDOUS AIR POLLUTANT INVENTORY (Inventory of air pollution sources) Business SIC classification: GRAIN AND FIELD BEANS
OWENSVILLE COMMUNITY SCHOOL (SR 65 in OWENSVILLE, IN)
(National Center for Education Statistics) - STATE ID-2241 Organizations: SOUTH GIBSON SCHOOL CORP (SCHOOL DISTRICT)
OWENSVILLE MUNICIPAL WWTP (SR 65 & MILL ST in OWENSVILLE, IN)
STATE MASTER (Indiana facility tracking) National Pollutant Discharge Elimination System NON-MAJOR (Tracking pollutant discharge elimination systems) - permit Business SIC classification: SEWERAGE SYSTEMS Organizations: RANDY ROSS CERT OPER (CONTACT/OPERATOR)
, OWENSVILLE MUNICIPAL STP (CONTACT/OWNER)
Alternative names: OWENSVILLE MUNICIPAL STP
OWENSVILLE STATION (CNTY RD 550 W AND CNTY RD 350 in OWENSVILLE, IN)
STATE MASTER (Indiana facility tracking) (Resource Conservation and Recovery Act (tracking hazardous waste)) Organizations: ASHLAND OIL INC (CONTACT/OWNER)
Housing units lacking complete plumbing facilities: 0.5% Housing units lacking complete kitchen facilities: 0.5%
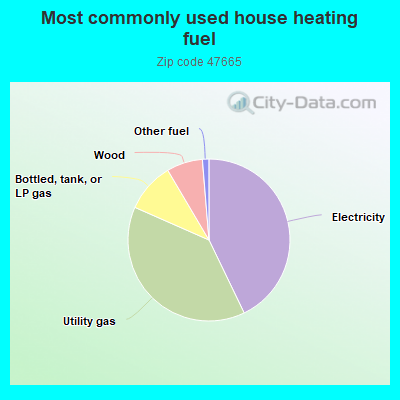
42.9%Electricity
38.8%Utility gas
9.9%Bottled, tank, or LP gas
7.2%Wood
1.3%Other fuel
Population in 1990: 3,159. Population change in the 1990s: +181 (+5.7%).
Place of birth for U.S.-born residents:
This state: 3,391
Northeast: 11
Midwest: 439
South: 156
West: 27
68% of the 47665 zip code residents lived in the same house 5 years ago. Out of people who lived in different houses, 61% lived in this county. Out of people who lived in different counties, 50% lived in Indiana.
96% of the 47665 zip code residents lived in the same house 1 year ago. Out of people who lived in different houses, 63% moved from this county. Out of people who lived in different houses, 23% moved from different county within same state. Out of people who lived in different houses, 25% moved from different state.
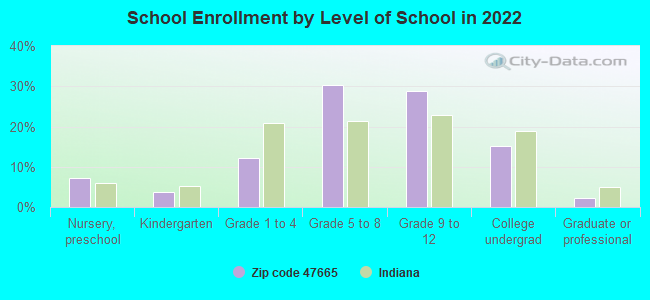
Private vs. public school enrollment:
Students in private schools in grades 1 to 8 (elementary and middle school): 187
Here:
39.9%
Indiana:
14.9%
Students in private schools in grades 9 to 12 (high school): 50
Here:
15.9%
Indiana:
11.4%
Students in private undergraduate colleges: 28
Here:
16.9%
Indiana:
22.3%
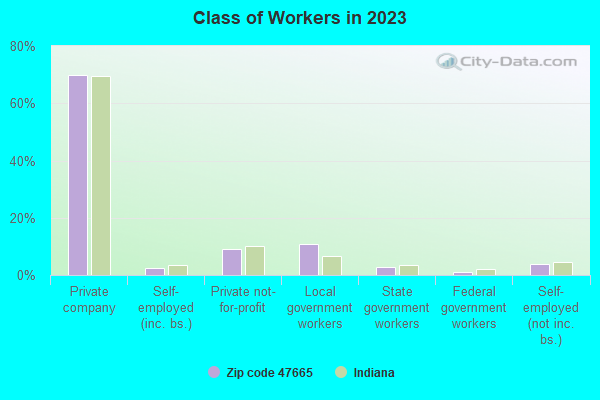
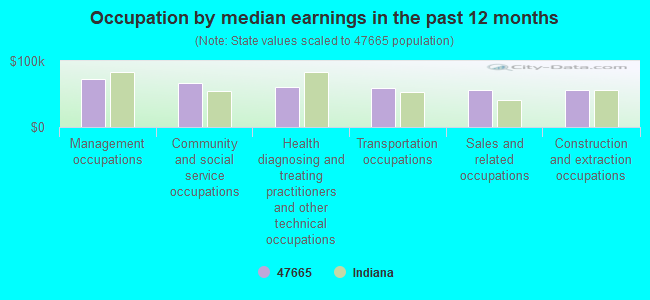
Occupation by median earnings in the past 12 months ($)
72,719Management occupations
66,930Community and social service occupations
60,874Health diagnosing and treating practitioners and other technical occupations
59,690Transportation occupations
55,453Sales and related occupations
55,422Construction and extraction occupations
Top industries in this zip code by the number of employees in 2005:
Utilities: Fossil Fuel Electric Power Generation (250-499 employees: 1 establishment)
Utilities: Electric Power Distribution (100-249: 1)
Real Estate and Rental and Leasing: Other Commercial and Industrial Machinery and Equipment Rental and Leasing (100-249: 1)
Administrative and Support and Waste Management and Remediation Services: Landscaping Services (50-99: 1)
Construction: Other Heavy and Civil Engineering Construction (20-49: 1)
Other Services (except Public Administration): Religious Organizations (5-9: 3, 1-4: 4)
Health Care and Social Assistance: Child Day Care Services (5-9: 2, 1-4: 1)
People in group quarters in 2010:
54 people in nursing facilities/skilled-nursing facilities
People in group quarters in 2000:
59 people in nursing homes
Fatal accident statistics in 2014:
Fatal accident count: 1
Vehicles involved in fatal accidents: 1
Fatal accidents caused by drunken drivers: 0
Fatalities: 1
Persons involved in fatal accidents: 1
Pedestrians involved in fatal accidents: 0
Fatal accident statistics in 2012:
Fatal accident count: 1
Vehicles involved in fatal accidents: 3
Fatal accidents caused by drunken drivers: 1
Fatalities: 1
Persons involved in fatal accidents: 3
Pedestrians involved in fatal accidents: 0
Home Mortgage Disclosure Act Aggregated Statistics For Year 2009 (Based on 2 partial tracts)
A) FHA, FSA/RHS & VA Home Purchase Loans
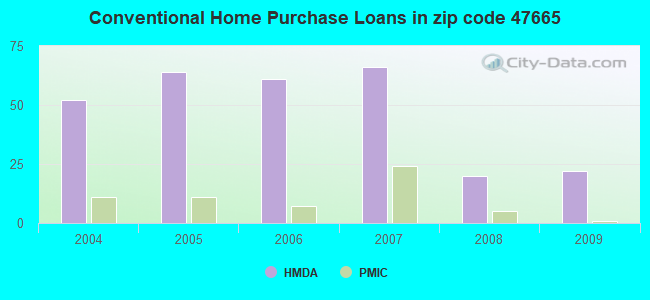
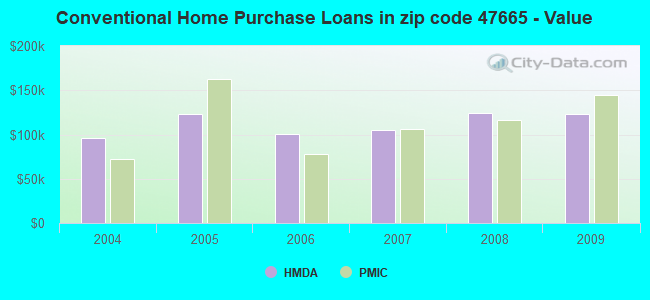
B) Conventional Home Purchase Loans
C) Refinancings
D) Home Improvement Loans
F) Non-occupant Loans on < 5 Family Dwellings (A B C & D)
G) Loans On Manufactured Home Dwelling (A B C & D)
Number
Average Value
Number
Average Value
Number
Average Value
Number
Average Value
Number
Average Value
Number
Average Value
LOANS ORIGINATED
15
$102,061
22
$123,150
98
$114,554
4
$29,155
3
$85,880
9
$66,142
APPLICATIONS APPROVED, NOT ACCEPTED
1
$168,140
0
$0
8
$134,244
0
$0
0
$0
1
$168,140
APPLICATIONS DENIED
8
$132,210
4
$108,480
23
$88,494
5
$25,764
1
$66,440
4
$64,750
APPLICATIONS WITHDRAWN
0
$0
4
$91,530
28
$152,114
0
$0
0
$0
1
$81,360
FILES CLOSED FOR INCOMPLETENESS
0
$0
0
$0
0
$0
0
$0
0
$0
0
$0
Aggregated Statistics For Year 2008 (Based on 2 partial tracts)
A) FHA, FSA/RHS & VA Home Purchase Loans
B) Conventional Home Purchase Loans
C) Refinancings
D) Home Improvement Loans
F) Non-occupant Loans on < 5 Family Dwellings (A B C & D)
G) Loans On Manufactured Home Dwelling (A B C & D)
Number
Average Value
Number
Average Value
Number
Average Value
Number
Average Value
Number
Average Value
Number
Average Value
LOANS ORIGINATED
16
$81,191
20
$124,142
76
$111,228
19
$21,125
4
$64,410
16
$75,173
APPLICATIONS APPROVED, NOT ACCEPTED
0
$0
1
$196,620
3
$100,797
0
$0
0
$0
0
$0
APPLICATIONS DENIED
9
$91,002
12
$96,728
50
$103,951
12
$27,346
1
$13,560
11
$51,035
APPLICATIONS WITHDRAWN
1
$85,430
4
$147,125
23
$138,312
3
$105,767
1
$86,780
1
$178,990
FILES CLOSED FOR INCOMPLETENESS
0
$0
1
$97,630
1
$134,240
0
$0
0
$0
0
$0
Aggregated Statistics For Year 2007 (Based on 2 partial tracts)
A) FHA, FSA/RHS & VA Home Purchase Loans
B) Conventional Home Purchase Loans
C) Refinancings
D) Home Improvement Loans
F) Non-occupant Loans on < 5 Family Dwellings (A B C & D)
G) Loans On Manufactured Home Dwelling (A B C & D)
Number
Average Value
Number
Average Value
Number
Average Value
Number
Average Value
Number
Average Value
Number
Average Value
LOANS ORIGINATED
9
$124,752
66
$104,556
54
$96,979
8
$26,950
3
$78,647
15
$60,297
APPLICATIONS APPROVED, NOT ACCEPTED
0
$0
4
$58,648
16
$106,107
3
$53,337
0
$0
7
$69,156
APPLICATIONS DENIED
1
$104,410
12
$115,825
42
$105,219
16
$63,986
0
$0
8
$70,004
APPLICATIONS WITHDRAWN
1
$78,650
5
$125,294
24
$113,000
0
$0
4
$95,938
3
$113,000
FILES CLOSED FOR INCOMPLETENESS
0
$0
4
$34,918
4
$134,582
0
$0
1
$37,970
0
$0
Aggregated Statistics For Year 2006 (Based on 2 partial tracts)
A) FHA, FSA/RHS & VA Home Purchase Loans
B) Conventional Home Purchase Loans
C) Refinancings
D) Home Improvement Loans
F) Non-occupant Loans on < 5 Family Dwellings (A B C & D)
G) Loans On Manufactured Home Dwelling (A B C & D)
Number
Average Value
Number
Average Value
Number
Average Value
Number
Average Value
Number
Average Value
Number
Average Value
LOANS ORIGINATED
14
$117,100
61
$100,766
58
$89,753
15
$52,884
8
$75,766
19
$79,718
APPLICATIONS APPROVED, NOT ACCEPTED
0
$0
3
$107,123
7
$69,156
4
$10,510
0
$0
1
$13,560
APPLICATIONS DENIED
4
$124,752
18
$78,648
49
$103,831
8
$70,004
1
$127,460
14
$60,729
APPLICATIONS WITHDRAWN
1
$151,870
4
$98,988
22
$109,466
1
$13,560
1
$172,210
3
$90,400
FILES CLOSED FOR INCOMPLETENESS
1
$70,510
0
$0
7
$73,030
0
$0
0
$0
0
$0
Aggregated Statistics For Year 2005 (Based on 2 partial tracts)
A) FHA, FSA/RHS & VA Home Purchase Loans
B) Conventional Home Purchase Loans
C) Refinancings
D) Home Improvement Loans
F) Non-occupant Loans on < 5 Family Dwellings (A B C & D)
G) Loans On Manufactured Home Dwelling (A B C & D)
Number
Average Value
Number
Average Value
Number
Average Value
Number
Average Value
Number
Average Value
Number
Average Value
LOANS ORIGINATED
18
$92,584
64
$122,993
76
$86,035
20
$17,628
7
$76,711
34
$67,999
APPLICATIONS APPROVED, NOT ACCEPTED
1
$143,740
8
$101,022
18
$74,881
1
$20,340
0
$0
9
$58,007
APPLICATIONS DENIED
4
$75,598
18
$68,854
42
$75,968
19
$33,757
3
$40,227
24
$51,245
APPLICATIONS WITHDRAWN
0
$0
9
$105,014
19
$123,967
7
$87,753
0
$0
12
$75,145
FILES CLOSED FOR INCOMPLETENESS
0
$0
0
$0
12
$102,830
0
$0
0
$0
1
$78,650
Aggregated Statistics For Year 2004 (Based on 2 partial tracts)
A) FHA, FSA/RHS & VA Home Purchase Loans
B) Conventional Home Purchase Loans
C) Refinancings
D) Home Improvement Loans
F) Non-occupant Loans on < 5 Family Dwellings (A B C & D)
G) Loans On Manufactured Home Dwelling (A B C & D)
Detailed PMIC statistics for the following Tracts:0501.00
2002 - 2018 National Fire Incident Reporting System (NFIRS) incidents
Based on the data from the years 2002 - 2018 the average number of fires per year is 17. The highest number of fire incidents - 48 took place in 2010, and the least - 3 in 2016. The data has a decreasing trend.
When looking into fire subcategories, the most reports belonged to: Outside Fires (48.4%), and Structure Fires (27.9%).
Fire incident types reported to NFIRS in Zip Code 47665
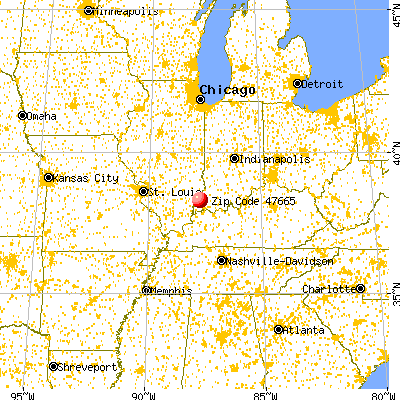


 Nearest zip codes: 47612, 47633, 47670, 62852, 47648, 47616.
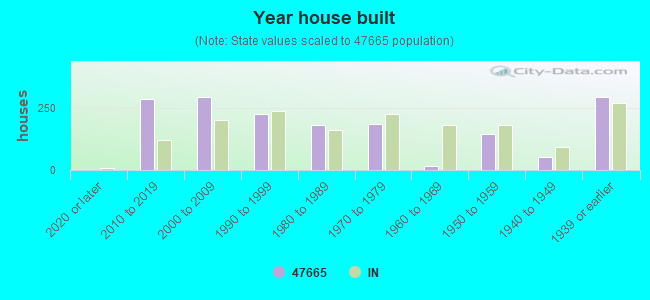


 Based on the data from the years 2002 - 2018 the average number of fires per year is 17. The highest number of fire incidents - 48 took place in 2010, and the least - 3 in 2016. The data has a decreasing trend.
 When looking into fire subcategories, the most reports belonged to: Outside Fires (48.4%), and Structure Fires (27.9%).