Estimated zip code population in 2022: 39,550 Zip code population in 2010: 40,831 Zip code population in 2000: 40,586
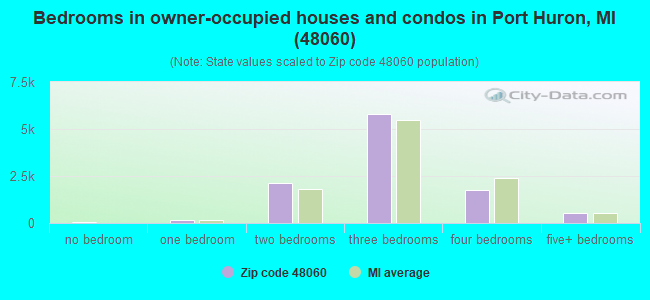
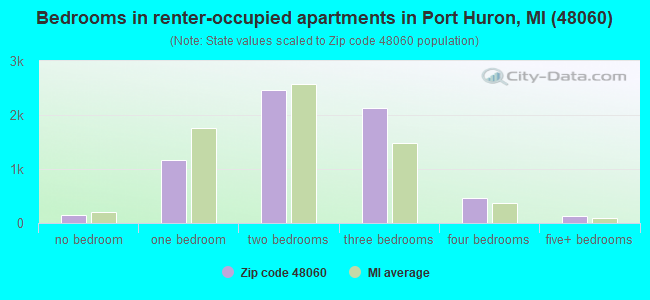
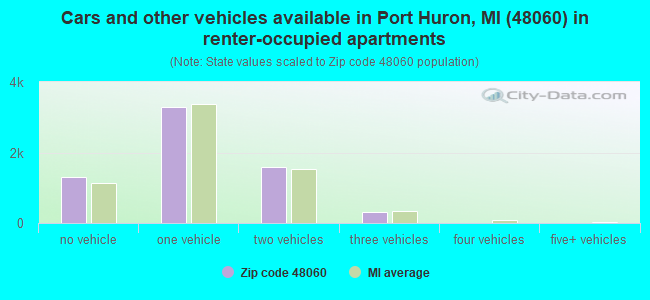
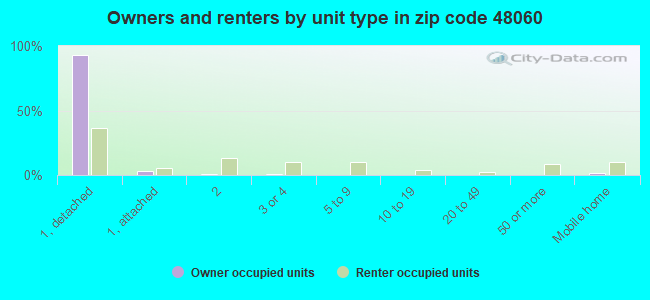
Houses and condos: 18,289 Renter-occupied apartments: 6,515
% of renters here:
38%
State:
27%
March 2022 cost of living index in zip code 48060: 95.5 (near average, U.S. average is 100)
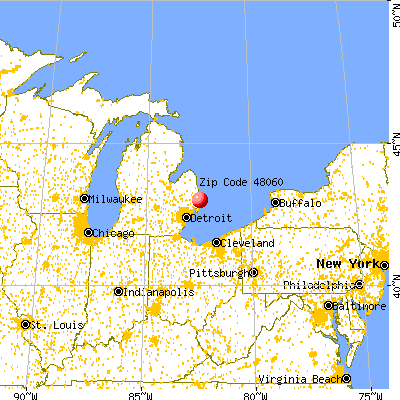
Land area: 20.8 sq. mi. Water area: 3.1 sq. mi.
Population density: 1,897 people per square mile
(low).
OSM Map
General Map
Google Map
MSN Map
OSM Map
General Map
Google Map
MSN Map
OSM Map
General Map
Google Map
MSN Map
OSM Map
General Map
Google Map
MSN Map
Please wait while loading the map...
Real estate property taxes paid for housing units in 2022:
This zip code:
1.3% ($2,012)
Michigan:
1.2% ($2,746)
Median real estate property taxes paid for housing units with mortgages in 2022: $2,143 (1.4%) Median real estate property taxes paid for housing units with no mortgage in 2022: $1,892 (1.4%)
Averages for the 2020 tax year for zip code 48060, filed in 2021:
Average Adjusted Gross Income (AGI) in 2020: $43,412 (Individual Income Tax Returns)
Here:
$43,412
State:
$68,945
Salary/wage: $37,229 (reported on 77.5% of returns)
Here:
$37,229
State:
$57,142
(% of AGI for various income ranges: 927.6% for AGIs below $25k, 3121.6% for AGIs $25k-50k, 5830.1% for AGIs $50k-75k, 8659.1% for AGIs $75k-100k, 14734.5% for AGIs $100k-200k, 78416.7% for AGIs over 200k)
Taxable interest for individuals: $897 (reported on 23.1% of returns)
This zip code:
$897
Michigan:
$1,630
(% of AGI for various income ranges: 9.2% for AGIs below $25k, 11.3% for AGIs $25k-50k, 28.3% for AGIs $50k-75k, 61.6% for AGIs $75k-100k, 125.8% for AGIs $100k-200k, 1348.3% for AGIs over 200k)
Ordinary dividends: $5,288 (reported on 11.3% of returns)
Here:
$5,288
State:
$6,972
(% of AGI for various income ranges: 14.8% for AGIs below $25k, 20.3% for AGIs $25k-50k, 58.1% for AGIs $50k-75k, 162.1% for AGIs $75k-100k, 353.6% for AGIs $100k-200k, 7143.3% for AGIs over 200k)
Net capital gain/loss in AGI: +$13,130 (reported on 10.0% of returns)
Here:
+$13,130
State:
+$20,064
(% of AGI for various income ranges: 2.7% for AGIs below $25k, 14.1% for AGIs $25k-50k, 55.0% for AGIs $50k-75k, 140.6% for AGIs $75k-100k, 492.8% for AGIs $100k-200k, 29526.7% for AGIs over 200k)
Profit/loss from business: +$8,548 (reported on 11.7% of returns)
Here:
+$8,548
State:
+$11,172
(% of AGI for various income ranges: 58.5% for AGIs below $25k, 75.3% for AGIs $25k-50k, 107.4% for AGIs $50k-75k, 162.1% for AGIs $75k-100k, 360.3% for AGIs $100k-200k, 9588.3% for AGIs over 200k)
Taxable individual retirement arrangement distribution: $15,093 (reported on 7.6% of returns)
48060:
$15,093
Michigan:
$19,803
(% of AGI for various income ranges: 37.1% for AGIs below $25k, 61.1% for AGIs $25k-50k, 170.6% for AGIs $50k-75k, 450.4% for AGIs $75k-100k, 842.1% for AGIs $100k-200k, 5223.3% for AGIs over 200k)
Self-employed (Keogh) retirement plans: $22,200 (reported on 0.1% of returns)
48060:
$22,200
Michigan:
$25,132
(% of AGI for various income ranges: 9.5% for AGIs $25k-50k)
Total itemized deductions: $28,734 (reported on 2.3% of returns)
Here:
$28,734
State:
$34,117
(% of AGI for various income ranges: 19.3% for AGIs below $25k, 27.4% for AGIs $25k-50k, 113.1% for AGIs $50k-75k, 215.9% for AGIs $75k-100k, 388.5% for AGIs $100k-200k, 5561.7% for AGIs over 200k)
Charity contributions: $8,072 (reported on 1.9% of returns)
Here:
$8,072
State:
$13,548
(% of AGI for various income ranges: 1.6% for AGIs below $25k, 2.8% for AGIs $25k-50k, 21.0% for AGIs $50k-75k, 47.4% for AGIs $75k-100k, 100.3% for AGIs $100k-200k, 1871.7% for AGIs over 200k)
Taxes paid: $7,014 (reported on 2.3% of returns)
48060:
$7,014
State:
$7,972
(% of AGI for various income ranges: 2.7% for AGIs below $25k, 4.4% for AGIs $25k-50k, 29.9% for AGIs $50k-75k, 53.2% for AGIs $75k-100k, 125.6% for AGIs $100k-200k, 1253.3% for AGIs over 200k)
Earned income credit: $2,235 (reported on 22.2% of returns)
Here:
$2,235
State:
$2,251
(% of AGI for various income ranges: 94.9% for AGIs below $25k, 80.7% for AGIs $25k-50k, 2.0% for AGIs $50k-75k)
Percentage of individuals using paid preparers for their 2020 taxes: 93.8%
Here:
94%
State:
93%
(% for various income ranges: 93.1% for AGIs below $25k, 94.7% for AGIs $25k-50k, 94.3% for AGIs $50k-75k, 93.3% for AGIs $75k-100k, 93.8% for AGIs $100k-200k, 96.0% for AGIs over 200k)
Averages for the 2012 tax year for zip code 48060, filed in 2013:
Average Adjusted Gross Income (AGI) in 2012: $35,671 (Individual Income Tax Returns)
Here:
$35,671
State:
$55,609
Salary/wage: $31,894 (reported on 80.8% of returns)
Here:
$31,894
State:
$46,782
(% of AGI for various income ranges: 72.1% for AGIs below $25k, 77.2% for AGIs $25k-50k, 74.6% for AGIs $50k-75k, 74.7% for AGIs $75k-100k, 72.7% for AGIs $100k-200k, 49.5% for AGIs over 200k)
Taxable interest for individuals: $1,199 (reported on 22.8% of returns)
This zip code:
$1,199
Michigan:
$1,491
(% of AGI for various income ranges: 0.8% for AGIs below $25k, 0.6% for AGIs $25k-50k, 0.6% for AGIs $50k-75k, 0.8% for AGIs $75k-100k, 0.6% for AGIs $100k-200k, 1.8% for AGIs over 200k)
Ordinary dividends: $3,833 (reported on 13.3% of returns)
Here:
$3,833
State:
$6,225
(% of AGI for various income ranges: 1.0% for AGIs below $25k, 1.0% for AGIs $25k-50k, 1.0% for AGIs $50k-75k, 1.4% for AGIs $75k-100k, 1.4% for AGIs $100k-200k, 4.4% for AGIs over 200k)
Net capital gain/loss in AGI: +$2,932 (reported on 9.6% of returns)
Here:
+$2,932
State:
+$9,326
(% of AGI for various income ranges: 0.2% for AGIs $50k-75k, 0.4% for AGIs $75k-100k, 1.2% for AGIs $100k-200k, 5.8% for AGIs over 200k)
Profit/loss from business: +$8,903 (reported on 12.1% of returns)
Here:
+$8,903
State:
+$11,523
(% of AGI for various income ranges: 6.8% for AGIs below $25k, 2.0% for AGIs $25k-50k, 1.9% for AGIs $50k-75k, 1.5% for AGIs $75k-100k, 3.0% for AGIs $100k-200k, 3.1% for AGIs over 200k)
Taxable individual retirement arrangement distribution: $11,599 (reported on 9.4% of returns)
48060:
$11,599
Michigan:
$15,298
(% of AGI for various income ranges: 2.7% for AGIs below $25k, 2.3% for AGIs $25k-50k, 3.1% for AGIs $50k-75k, 3.1% for AGIs $75k-100k, 3.9% for AGIs $100k-200k, 3.8% for AGIs over 200k)
Self-employment retirement plans: $16,033 (reported on 0.2% of returns)
48060:
$16,033
Michigan:
$20,834
Total itemized deductions: $17,755 (21% of AGI, reported on 18.7% of returns)
Here:
$17,755
State:
$21,628
Here:
21.3% of AGI
State:
18.4% of AGI
(% of AGI for various income ranges: 5.0% for AGIs below $25k, 7.0% for AGIs $25k-50k, 9.4% for AGIs $50k-75k, 11.3% for AGIs $75k-100k, 13.1% for AGIs $100k-200k, 11.9% for AGIs over 200k)
Charity contributions: $3,005 (reported on 15.1% of returns)
Here:
$3,005
State:
$4,225
(% of AGI for various income ranges: 0.5% for AGIs below $25k, 0.8% for AGIs $25k-50k, 1.3% for AGIs $50k-75k, 1.6% for AGIs $75k-100k, 2.0% for AGIs $100k-200k, 1.7% for AGIs over 200k)
Taxes paid: $6,195 (reported on 18.6% of returns)
48060:
$6,195
State:
$8,327
(% of AGI for various income ranges: 0.9% for AGIs below $25k, 1.8% for AGIs $25k-50k, 2.9% for AGIs $50k-75k, 4.0% for AGIs $75k-100k, 5.4% for AGIs $100k-200k, 6.2% for AGIs over 200k)
Earned income credit: $2,258 (reported on 28.6% of returns)
Here:
$2,258
State:
$2,306
(% of AGI for various income ranges: 8.6% for AGIs below $25k, 1.5% for AGIs $25k-50k)
Percentage of individuals using paid preparers for their 2012 taxes: 58.9%
Here:
59%
State:
57%
(% for various income ranges: 56.4% for AGIs below $25k, 59.0% for AGIs $25k-50k, 62.0% for AGIs $50k-75k, 64.4% for AGIs $75k-100k, 67.7% for AGIs $100k-200k, 91.7% for AGIs over 200k)
Averages for the 2004 tax year for zip code 48060, filed in 2005:
Average Adjusted Gross Income (AGI) in 2004: $34,757 (Individual Income Tax Returns)
Here:
$34,757
State:
$48,204
Salary/wage: $32,173 (reported on 85.0% of returns)
Here:
$32,173
State:
$42,791
(% of AGI for various income ranges: 112.6% for AGIs below $10k, 77.7% for AGIs $10k-25k, 82.4% for AGIs $25k-50k, 84.3% for AGIs $50k-75k, 81.5% for AGIs $75k-100k, 64.4% for AGIs over 100k)
Taxable interest for individuals: $1,302 (reported on 38.5% of returns)
This zip code:
$1,302
Michigan:
$1,725
(% of AGI for various income ranges: 7.0% for AGIs below $10k, 1.7% for AGIs $10k-25k, 1.3% for AGIs $25k-50k, 1.0% for AGIs $50k-75k, 1.1% for AGIs $75k-100k, 1.5% for AGIs over 100k)
Taxable dividends: $2,262 (reported on 18.1% of returns)
Here:
$2,262
State:
$3,420
(% of AGI for various income ranges: 3.6% for AGIs below $10k, 1.2% for AGIs $10k-25k, 1.0% for AGIs $25k-50k, 0.7% for AGIs $50k-75k, 1.1% for AGIs $75k-100k, 1.6% for AGIs over 100k)
Net capital gain/loss: +$9,632 (reported on 11.9% of returns)
Here:
+$9,632
State:
+$8,532
(% of AGI for various income ranges: -1.4% for AGIs below $10k, 0.1% for AGIs $10k-25k, 0.4% for AGIs $25k-50k, 0.7% for AGIs $50k-75k, 1.1% for AGIs $75k-100k, 13.0% for AGIs over 100k)
Profit/loss from business: +$7,856 (reported on 11.1% of returns)
Here:
+$7,856
State:
+$9,547
(% of AGI for various income ranges: 8.0% for AGIs below $10k, 3.1% for AGIs $10k-25k, 1.7% for AGIs $25k-50k, 1.5% for AGIs $50k-75k, 1.4% for AGIs $75k-100k, 4.2% for AGIs over 100k)
IRA payment deduction: $2,467 (reported on 1.9% of returns)
48060:
$2,467
Michigan:
$2,875
(% of AGI for various income ranges: 0.2% for AGIs below $10k, 0.1% for AGIs $10k-25k, 0.2% for AGIs $25k-50k, 0.1% for AGIs $50k-75k, 0.1% for AGIs $75k-100k, 0.1% for AGIs over 100k)
Self-employed pension: $10,087 (reported on 0.3% of returns)
Here:
$10,087
Michigan:
$13,826
Total itemized deductions: $15,169 (22% of AGI, reported on 27.6% of returns)
Here:
$15,169
State:
$18,509
Here:
22.0% of AGI
State:
20.7% of AGI
(% of AGI for various income ranges: 10.0% for AGIs below $10k, 7.2% for AGIs $10k-25k, 11.1% for AGIs $25k-50k, 13.5% for AGIs $50k-75k, 15.1% for AGIs $75k-100k, 13.0% for AGIs over 100k)
Charity contributions deductions: $2,597 (4% of AGI, reported on 24.1% of returns)
Here:
$2,597
State:
$3,365
Here:
3.6% of AGI
State:
3.6% of AGI
(% of AGI for various income ranges: 0.7% for AGIs below $10k, 0.7% for AGIs $10k-25k, 1.3% for AGIs $25k-50k, 1.7% for AGIs $50k-75k, 2.2% for AGIs $75k-100k, 3.1% for AGIs over 100k)
Total tax: $4,852 (reported on 68.2% of returns)
48060:
$4,852
State:
$7,691
(% of AGI for various income ranges: 2.6% for AGIs below $10k, 3.6% for AGIs $10k-25k, 6.6% for AGIs $25k-50k, 8.5% for AGIs $50k-75k, 10.4% for AGIs $75k-100k, 17.6% for AGIs over 100k)
Earned income credit: $1,687 (reported on 21.9% of returns)
Here:
$1,687
State:
$1,737
Percentage of individuals using paid preparers for their 2004 taxes: 63.6%
Here:
64%
State:
60%
(% for various income ranges: 57.5% for AGIs below $10k, 66.5% for AGIs $10k-25k, 63.8% for AGIs $25k-50k, 64.9% for AGIs $50k-75k, 66.8% for AGIs $75k-100k, 71.1% for AGIs over 100k)
Likely homosexual households (counted as self-reported same-sex unmarried-partner households)
Lesbian couples: 0.1% of all households
Gay men: 0.1% of all households
Household received Food Stamps/SNAP in the past 12 months: 4,701 Household did not receive Food Stamps/SNAP in the past 12 months: 12,540
Women who had a birth in the past 12 months: 450 (234 now married, 211 unmarried) Women who did not have a birth in the past 12 months: 8,923 (2,941 now married, 5,995 unmarried)
Housing units in zip code 48060 with a mortgage: 5,813 (342 second mortgage, 13 home equity loan, 302 both second mortgage and home equity loan) Houses without a mortgage: 149
Median monthly owner costs for units with a mortgage: $1,113 Median monthly owner costs for units without a mortgage: $521
Residents with income below the poverty level in 2022:
This zip code:
22.1%
Whole state:
13.4%
Residents with income below 50% of the poverty level in 2022:
This zip code:
10.0%
Whole state:
6.9%
Median number of rooms in houses and condos:
Here:
6.4
State:
6.5
Median number of rooms in apartments:
Here:
4.8
State:
4.3
Notable locations in this zip code not listed on our city pages
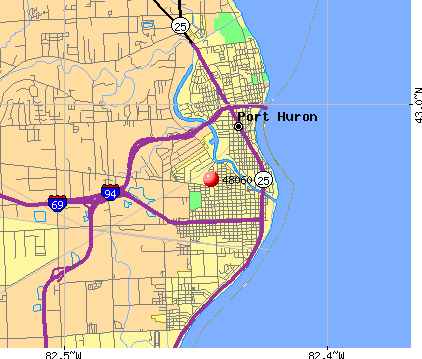
Notable locations in zip code 48060: Black River Country Club (A), Bluewater Bridge Marina (B), Eds Shell Dock (C), Fort Street Dock (D), Lakeside Park (E), Port Huron Station (F), Port Huron Yacht Club (G), Riverside Marina (H), Fort Gratiot Range Lights (I), Maxi Marine Service (J), Fuller Boat and Motors (K), Buck River Marina (L), Municipal Marina (M), Cameron Marina Incorporated (N), Henry McMorran Memorial Auditorium (O), Port Huron Marina (P), Port Huron Municipal Dock (Q), Saint Clair County Jail (R), Black River Boat Club (S), River Tower Marina (T). Display/hide their locations on the map
Shopping Centers: Pine Grove Plaza Shopping Center (1), Stadium Center Shopping Center (2), Pine Grove Plaza Shopping Center (3), Court of Flags Mall Shopping Center (4), Court of Flags Mall Shopping Center (5), Stadium Center Shopping Center (6). Display/hide their locations on the map
Churches in zip code 48060 include: United Christian Fellowship Church (A), Shiloh Church (B), Ross Bible Church (C), Saint Pauls Church (D), First United Methodist Church (E), Our Saviour's Lutheran Church (F), Saint John's United Church of Christ (G), First Congregational Church (H), Grace Episcopal Church (I). Display/hide their locations on the map
Parks in zip code 48060 include: Township Park (1), Sixteenth Street Park (2), Kiefer Park (3), White Park (4), Lincoln Park (5), Knox Field (6), Gratiot Park (7), Haynes Park (8), Mansfield Park (9). Display/hide their locations on the map
3,622 married couples with children.
3,912 single-parent households (833 men, 3,079 women).
96.3% of residents of 48060 zip code speak English at home.
1.8% of residents speak Spanish at home (79% very well, 14% well, 2% not well, 4% not at all).
0.9% of residents speak other Indo-European language at home (86% very well, 14% well).
0.5% of residents speak Asian or Pacific Island language at home (73% very well, 10% well, 13% not well, 4% not at all).
0.1% of residents speak other language at home (53% very well, 19% not well, 28% not at all).
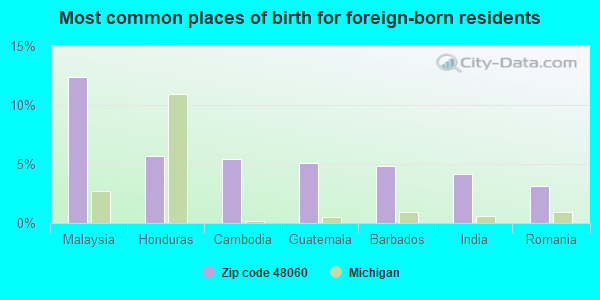
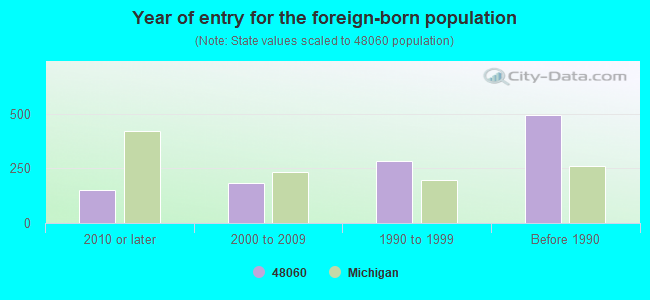
Foreign born population: 789 (2.0%) (49.9% of them are naturalized citizens)
Major facilities with environmental interests located in this zip code:
ACHESON COLLOIDS COMPANY (1600 WASHINGTON AVE. in PORT HURON, MI)
AIR SYNTHETIC MINOR (AIRS/AFS) COMPLIANCE ACTIVITY (Tracking inspections of insecticide, fungicide, and rodenticide, and toxic substances) CRITERIA AND HAZARDOUS AIR POLLUTANT INVENTORY (Inventory of air pollution sources) HAZARDOUS WASTE BIENNIAL REPORTER (Resource Conservation and Recovery Act (tracking hazardous waste)) Large Quantity Generators, more that 1000 kg of hazardous waste/month (Resource Conservation and Recovery Act (tracking hazardous waste)) TRI REPORTER (Tracking of toxic chemicals releasing facilities) Business SIC classification: CHEMICALS AND CHEMICAL PREPARATIONS; LUBRICATING OILS AND GREASES; MINERALS AND EARTHS, GROUND OR OTHERWISE TREATED Business NAICS classification: PETROLEUM LUBRICATING OIL AND GREASE MANUFACTURING.; ALL OTHER MISCELLANEOUS CHEMICAL PRODUCT AND PREPARATION MANUFACTURING. Organizations: NATINAL STARCH ICI AMERICAS HOLDING CO (CONTACT/OPERATOR)
E B EDDY PAPER INCORPORATED (1700 WASHINGTON AVE. in PORT HURON, MI)
AIR MAJOR (AIRS/AFS) COMPLIANCE ACTIVITY (Tracking inspections of insecticide, fungicide, and rodenticide, and toxic substances) CRITERIA AND HAZARDOUS AIR POLLUTANT INVENTORY (Inventory of air pollution sources) National Pollutant Discharge Elimination System MAJOR (Tracking pollutant discharge elimination systems) - permit Small Quantity Generators, between 100 kg and 1000 kg of hazardous waste/month (Resource Conservation and Recovery Act (tracking hazardous waste)) - notification TRI REPORTER (Tracking of toxic chemicals releasing facilities) Business SIC classification: PAPER MILLS Business NAICS classification: PAPER (EXCEPT NEWSPRINT) MILLS. Organizations: DOMTAR INDUSTRIES (CONTACT/OPERATOR)
, PORT HURON PAPER COMPANY (CONTACT/OWNER)
Alternative names: E. B. EDDY PAPER INC., EDDY E B PAPER INC
AUTO ANODICS INCORPORATED (2407 16TH ST. in PORT HURON, MI)
AIR MINOR (AIRS/AFS) HAZARDOUS WASTE BIENNIAL REPORTER (Resource Conservation and Recovery Act (tracking hazardous waste)) Large Quantity Generators, more that 1000 kg of hazardous waste/month (Resource Conservation and Recovery Act (tracking hazardous waste)) TRI REPORTER (Tracking of toxic chemicals releasing facilities) Business SIC classification: ELECTROPLATING, PLATING, POLISHING, ANODIZING, AND COLORING; COATING, ENGRAVING, AND ALLIED SERVICES Business NAICS classification: ELECTROPLATING, PLATING, POLISHING, ANODIZING, AND COLORING. Organizations: MAX WIENER (CONTACT/OPERATOR)
DUALEX INCORPORATED (2401 20TH ST in PORT HURON, MI)
AIR MINOR (AIRS/AFS) Conditionally Exempt Small Quantity Generators, less than 100 kg/month of hazardous waste (Resource Conservation and Recovery Act (tracking hazardous waste)) HAZARDOUS WASTE BIENNIAL REPORTER (Resource Conservation and Recovery Act (tracking hazardous waste)) TRI REPORTER (Tracking of toxic chemicals releasing facilities) Business SIC classification: METAL DOORS, SASH, FRAMES, MOLDING, AND TRIM; AUTOMOTIVE STAMPINGS; ELECTROPLATING, PLATING, POLISHING, ANODIZING, AND COLORING; FABRICATED METAL PRODUCTS Business NAICS classification: METAL STAMPING. Organizations: DEPCO INTERNATIONAL (CONTACT/OWNER)
, DUALEX INC. (CONTACT/OWNER)
Alternative names: RIVERSIDE INTL. INC. PLANT 2
CENTRAL MIDDLE SCHOOL (200 32ND STREET in PORT HURON, MI)
(National Center for Education Statistics) - STATE ID-03091 Organizations: PORT HURON AREA SCHOOL DISTRICT (SCHOOL DISTRICT)
CHIPPEWA MIDDLE SCHOOL (2800 CHIPPEWA TRAIL in PORT HURON, MI)
(National Center for Education Statistics) - STATE ID-00676 Organizations: PORT HURON AREA SCHOOL DISTRICT (SCHOOL DISTRICT)
GARFIELD ELEMENTARY SCHOOL (1221 GARFIELD STREET in PORT HURON, MI)
(National Center for Education Statistics) - STATE ID-01366 Organizations: PORT HURON AREA SCHOOL DISTRICT (SCHOOL DISTRICT)
AMOCO OIL CO (2539 PINE GROVE in PORT HURON, MI)
(Resource Conservation and Recovery Act (tracking hazardous waste)) Organizations: AMOCO OIL COMPANY (CONTACT/OWNER)
, BP PRODUCTS NORTH AMERICA (CONTACT/OWNER)
Alternative names: AMOCO OIL CO 5396
ANGELOS CRUSHED CONCRETE INC (1750 RANGE RD in PORT HURON, MI)
AIR SYNTHETIC MINOR (AIRS/AFS) CRITERIA AND HAZARDOUS AIR POLLUTANT INVENTORY (Inventory of air pollution sources) (Resource Conservation and Recovery Act (tracking hazardous waste)) Business SIC classification: ASPHALT PAVING MIXTURES AND BLOCKS Business NAICS classification: ASPHALT PAVING MIXTURE AND BLOCK MANUFACTURING. Alternative names: ANGELO IAFRATE CONST CO, ANGELO IAFRATE CONSTUCTION CO, EDW. C. LEVY CO. - ACE ASPHALT
ARMSTRONG TRUCKING INC (3320 LAPEER in PORT HURON, MI)
(Resource Conservation and Recovery Act (tracking hazardous waste)) Business NAICS classification: GENERAL AUTOMOTIVE REPAIR.; AUTOMOTIVE OIL CHANGE AND LUBRICATION SHOPS. Organizations: ARMSTRONG DONALD (CONTACT/OWNER)
AHCESON VENTURES LLC (300 COURT ST in PORT HURON, MI)
MI DEPT/TRANSPORTATION BRIDGE (BRIDGE FOR RAMP CONNECTING E in PORT HURON, MI)
(Resource Conservation and Recovery Act (tracking hazardous waste)) Organizations: MICH DEPT OF TRANSPORTATION (CONTACT/OPERATOR)
Alternative names: MIDOT BRIDGE TO CONNECTING RAMP
Housing units lacking complete plumbing facilities: 0.9% Housing units lacking complete kitchen facilities: 3.0%
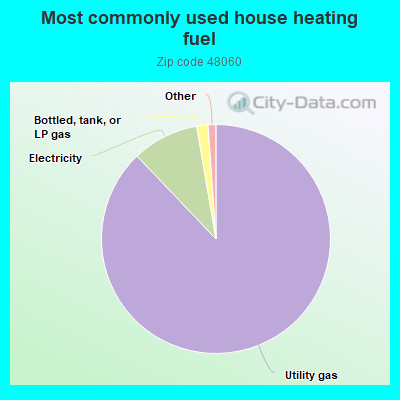
87.9%Utility gas
9.4%Electricity
1.6%Bottled, tank, or LP gas
Population in 1990: 58,197.
Place of birth for U.S.-born residents:
This state: 34,459
Northeast: 425
Midwest: 1,376
South: 1,137
West: 934
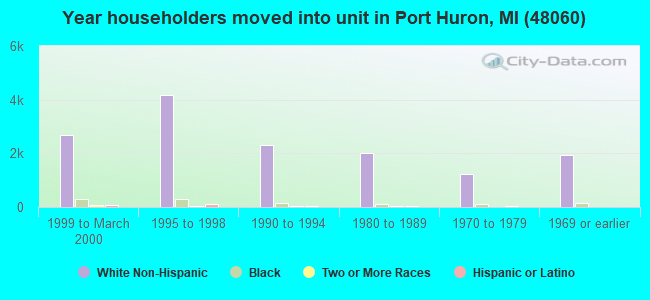
52% of the 48060 zip code residents lived in the same house 5 years ago. Out of people who lived in different houses, 79% lived in this county. Out of people who lived in different counties, 50% lived in Michigan.
86% of the 48060 zip code residents lived in the same house 1 year ago. Out of people who lived in different houses, 70% moved from this county. Out of people who lived in different houses, 20% moved from different county within same state. Out of people who lived in different houses, 6% moved from different state. Out of people who lived in different houses, 1% moved from abroad.
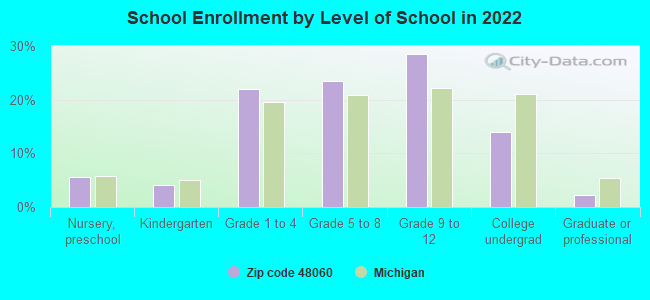
Private vs. public school enrollment:
Students in private schools in grades 1 to 8 (elementary and middle school): 277
Here:
7.6%
Michigan:
12.4%
Students in private schools in grades 9 to 12 (high school): 119
Here:
5.2%
Michigan:
9.8%
Students in private undergraduate colleges: 143
Here:
12.8%
Michigan:
14.9%
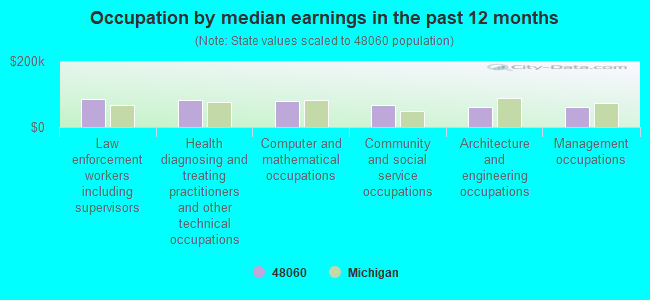
Occupation by median earnings in the past 12 months ($)
85,921Law enforcement workers including supervisors
83,044Health diagnosing and treating practitioners and other technical occupations
78,810Computer and mathematical occupations
65,673Community and social service occupations
61,994Architecture and engineering occupations
61,354Management occupations
Companies with federal contracts located in this zip code (PORT HURON, MI):
GMA COVER CORP (1314 CEDAR ST; small business) : $115,656,515 in 399 contractsfrom 1999 to 2006
Contracts for Camouflage and Deception Equipment, Vehicular Furniture and Accessories, Vehicular Cab, Body, and Frame Structural Components, Tents and Tarpaulins, and moreby Army, Defense Logistics Agency, Navy Signed by year:2000: $16,566,604; 2001: $10,518,566; 2002: $6,565,418; 2003: $21,518,913; 2004: $16,390,590; 2005: $16,765,152; 2006: $25,502,556.
Biggest contracts:
$20,199,765 with Army for Camouflage and Deception Equipment. Signed on 2006-06-07. Completion date: 2016-06-30.
$3,232,539 with Army for Vehicular Furniture and Accessories. Signed on 2000-07-26. Completion date: 2005-07-26.
$2,516,154, same as above.Signed on 2004-12-28. Completion date: 2009-06-30.
$2,295,076, same as above.Signed on 2005-12-13. Completion date: 2009-06-30.
GIBRALTAR SPROCKET COMPANY (3500 24TH ST; small business) : $9,803,661 in 35 contractsfrom 2000 to 2006
Contracts for Gears, Pulleys, Sprockets, and Transmission Chain by Army, Defense Logistics Agency Signed by year:2000: $1,080,993; 2001: $2,311,398; 2002: $206,764; 2003: $4,344,819; 2004: $749,078; 2005: $793,554; 2006: $317,055.
Biggest contracts:
$1,913,620 with Army for Gears, Pulleys, Sprockets, and Transmission Chain. Signed on 2003-08-20. Completion date: 2004-07-26.
$1,390,810, same as above.Signed on 2001-11-09. Completion date: 2002-11-18.
$1,045,799, same as above.Signed on 2003-07-10. Completion date: 2004-04-12.
$607,460 with Defense Logistics Agency for Gears, Pulleys, Sprockets, and Transmission Chain. Signed on 2003-11-14. Completion date: 2004-11-14.
MARYSVILLE PROPELLER INC (3760 GRISWOLD RD; small business) : $2,257,563 in 28 contractsfrom 2000 to 2004
Contracts for Vehicular Cab, Body, and Frame Structural Components, Vehicular Furniture and Accessories, Vehicular Power Transmission Components, Ship and Boat Propulsion Components by Defense Logistics Agency, Army Signed by year:2000: $110,670; 2001: $203,620; 2002: $990,048; 2003: $923,659; 2004: $29,566; 2005: $0; 2006: $0.
Biggest contracts:
$259,291 with Defense Logistics Agency for Vehicular Cab, Body, and Frame Structural Components. Signed on 2002-01-14. Completion date: 2002-05-25.
$229,638, same as above.Signed on 2002-09-09. Completion date: 2003-01-07.
$215,419 with Army for Vehicular Cab, Body, and Frame Structural Components. Signed on 2003-10-04. Completion date: 2007-04-26.
$173,502, same as above.Signed on 2002-04-18. Completion date: 2007-04-26.
DAVIS-MCNALLY LODGING INC (1635 YEAGER ST; small business) : $217,150 in 6 contractsin 2002
Contracts for Lodging - Hotel/Motel by Army Signed by year:2000: $0; 2001: $0; 2002: $217,150; 2003: $0; 2004: $0; 2005: $0; 2006: $0.
Biggest contracts:
$39,990 with Army for Lodging - Hotel/Motel. Taking place in WI. Signed on 2002-03-29. Completion date: 2002-04-30.
$37,324 with Army for Lodging - Hotel/Motel. Signed on 2002-06-28. Completion date: 2002-07-31.
$37,324, same as above.Signed on 2002-07-29. Completion date: 2002-08-31.
$36,120 with Army for Lodging - Hotel/Motel. Taking place in WI. Signed on 2002-06-01. Completion date: 2002-06-30.
HURON INDUSTRIES INC (2301 16TH ST; small business) : $31,218 in 10 contractsfrom 2004 to 2006
Contracts for Oils and Greases: Cutting, Lubricating, and Hydraulic by Navy Signed by year:2000: $0; 2001: $0; 2002: $0; 2003: $0; 2004: $1,415; 2005: $21,575; 2006: $8,228.
Biggest contracts:
$12,563 with Navy for Oils and Greases: Cutting, Lubricating, and Hydraulic. Taking place in MD. Signed on 2005-05-10. Completion date: 2005-11-06.
$8,228, same as above.Signed on 2006-03-24. Completion date: 2006-10-24.
$6,520, same as above.Signed on 2005-05-24. Completion date: 2005-11-20.
$999 with Navy for Oils and Greases: Cutting, Lubricating, and Hydraulic. Signed on 2004-11-23. Completion date: 2004-12-01.
YALE HEATING & AIR INC (2544 CONNER ST; small business)
$7,943 with Army for Installation of Equipment -- Pumps and Compressors. Signed on 2003-09-24. Completion date: 2003-12-31.
COLLINS PIANO STUDIO (3172 WHITTIER DR; small business) : $6,120 in 4 contractsfrom 2003 to 2004
$4,480 with Army for Other Professional Services. Signed on 2004-02-13. Completion date: 2004-09-30.
$4,400, same as above.Signed on 2003-11-24. Completion date: 2004-09-30.
$0, same as above.Signed on 2004-02-13. Completion date: 2004-09-30.
-$2,760, same as above.Signed on 2004-08-04. Completion date: 2004-09-30.
FLOORS TO YOUR DOOR INC (1322 12TH AVE; small business)
$4,693 with Army for Carpet Laying and Cleaning. Signed on 2000-08-16. Completion date: 2000-08-15.
PORT HURON, CITY OF (100 MCMORRAN BLVD; small business)
$1,809 with Department of Defense for Fuel Oils. Signed on 2005-05-26. Completion date: 2005-06-14.
Top industries in this zip code by the number of employees in 2005:
Health Care and Social Assistance: General Medical and Surgical Hospitals (over 1000 employees: 1 establishment, 500-999 employees: 1 establishment)
2002 - 2018 National Fire Incident Reporting System (NFIRS) incidents
Based on the data from the years 2002 - 2018 the average number of fire incidents per year is 166. The highest number of fires - 205 took place in 2012, and the least - 134 in 2005. The data has a declining trend.
When looking into fire subcategories, the most reports belonged to: Structure Fires (57.3%), and Outside Fires (23.5%).
Fire incident types reported to NFIRS in Zip Code 48060


 Nearest zip codes: 48040, 48074, 48059, 48049, 48079, 48032.


 Based on the data from the years 2002 - 2018 the average number of fire incidents per year is 166. The highest number of fires - 205 took place in 2012, and the least - 134 in 2005. The data has a declining trend.
 When looking into fire subcategories, the most reports belonged to: Structure Fires (57.3%), and Outside Fires (23.5%).