Estimated zip code population in 2022: 4,350 Zip code population in 2010: 4,796 Zip code population in 2000: 4,511
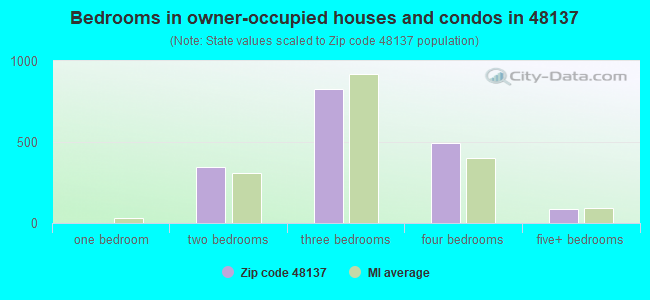
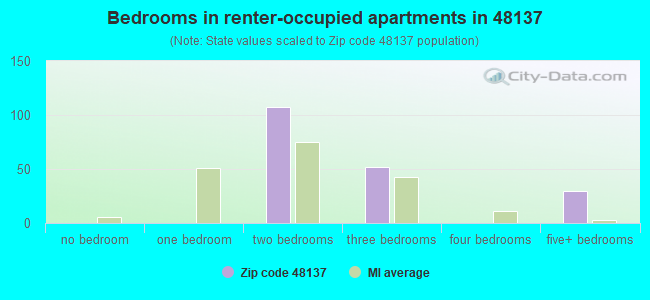
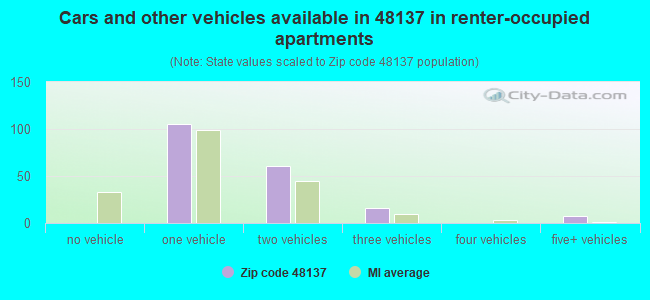
Houses and condos: 2,378 Renter-occupied apartments: 188
% of renters here:
10%
State:
27%
March 2022 cost of living index in zip code 48137: 91.6 (less than average, U.S. average is 100)
Land area: 42.4 sq. mi. Water area: 2.4 sq. mi.
Population density: 103 people per square mile
(very low).
OSM Map
General Map
Google Map
MSN Map
OSM Map
General Map
Google Map
MSN Map
OSM Map
General Map
Google Map
MSN Map
OSM Map
General Map
Google Map
MSN Map
Please wait while loading the map...
Real estate property taxes paid for housing units in 2022:
This zip code:
0.9% ($2,849)
Michigan:
1.2% ($2,746)
Median real estate property taxes paid for housing units with mortgages in 2022: $2,899 (0.9%) Median real estate property taxes paid for housing units with no mortgage in 2022: $2,795 (0.9%)
Business Search- 14 Million verified businesses
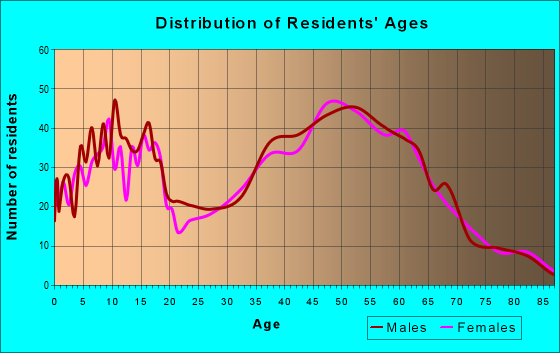
Males: 2,292
(52.7%)
Females: 2,058
(47.3%)
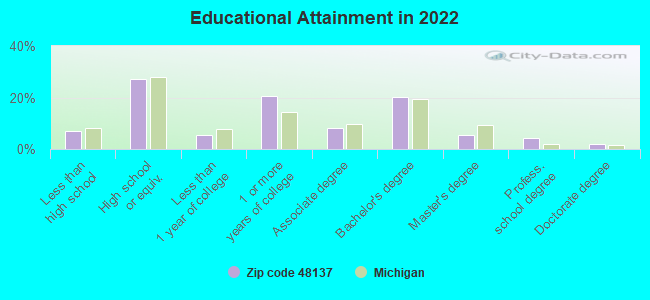
For population 25 years and over in 48137:
High school or higher: 92.7%
Bachelor's degree or higher: 31.5%
Graduate or professional degree: 11.4%
Unemployed: 2.2%
Mean travel time to work (commute): 36.6 minutes
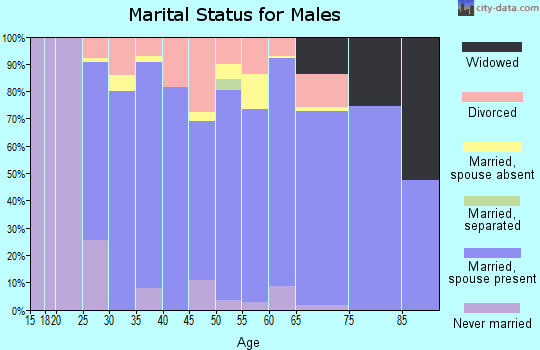
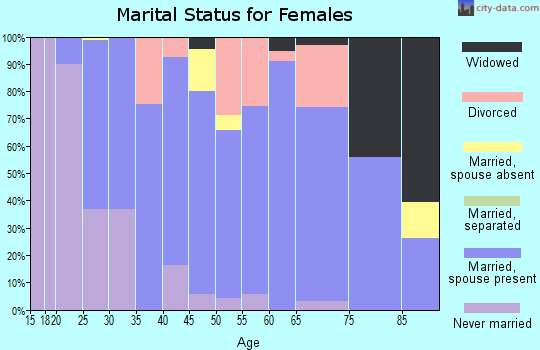
For population 15 years and over in 48137:
Never married: 18.2%
Now married: 67.5%
Separated: 0.5%
Widowed: 4.2%
Divorced: 9.6%
Zip code 48137 compared to state average:
Unemployed percentage below state average.
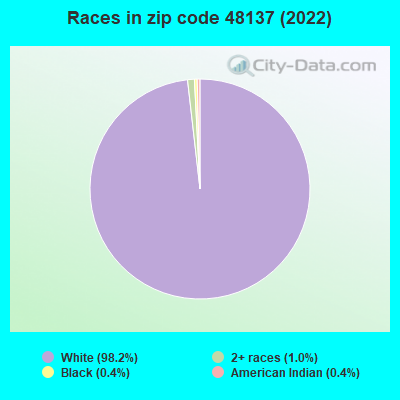
Black race population percentage significantly below state average.
Hispanic race population percentage significantly below state average.
Median age significantly above state average.
Foreign-born population percentage below state average.
Renting percentage significantly below state average.
Length of stay since moving in significantly above state average.
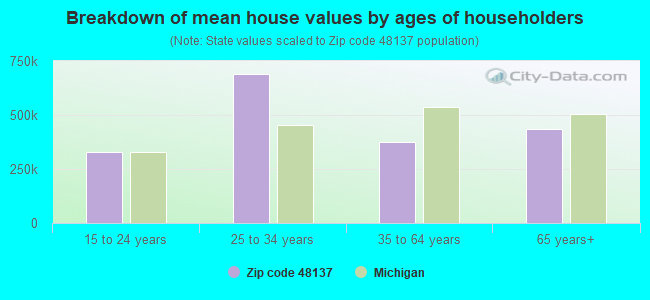
Estimated median house/condo value in 2022: $307,420
48137:
$307,420
Michigan:
$224,400
According to our research of Michigan and other state lists, there were 7 registered sex offenders living in 48137 zip code as of April 27, 2024. The ratio of all residents to sex offenders in zip code 48137 is 761 to 1. The ratio of registered sex offenders to all residents in this zip code is much lower than the state average.
Median resident age:
This zip code:
53.0 years
Michigan median age:
40.3 years
Average household size:
This zip code:
2.3 people
Michigan:
2.4 people
Averages for the 2020 tax year for zip code 48137, filed in 2021:
Average Adjusted Gross Income (AGI) in 2020: $74,212 (Individual Income Tax Returns)
Here:
$74,212
State:
$68,945
Salary/wage: $63,705 (reported on 78.9% of returns)
Here:
$63,705
State:
$57,142
(% of AGI for various income ranges: 996.2% for AGIs below $25k, 3004.5% for AGIs $25k-50k, 5497.9% for AGIs $50k-75k, 8546.8% for AGIs $75k-100k, 16598.4% for AGIs $100k-200k, 80166.7% for AGIs over 200k)
Taxable interest for individuals: $887 (reported on 40.7% of returns)
This zip code:
$887
Michigan:
$1,630
(% of AGI for various income ranges: 13.3% for AGIs below $25k, 32.4% for AGIs $25k-50k, 60.3% for AGIs $50k-75k, 28.4% for AGIs $75k-100k, 79.7% for AGIs $100k-200k, 760.0% for AGIs over 200k)
Ordinary dividends: $4,727 (reported on 24.4% of returns)
Here:
$4,727
State:
$6,972
(% of AGI for various income ranges: 28.9% for AGIs below $25k, 47.6% for AGIs $25k-50k, 130.0% for AGIs $50k-75k, 102.6% for AGIs $75k-100k, 250.3% for AGIs $100k-200k, 3923.3% for AGIs over 200k)
Net capital gain/loss in AGI: +$7,500 (reported on 21.5% of returns)
Here:
+$7,500
State:
+$20,064
(% of AGI for various income ranges: 15.8% for AGIs below $25k, 61.1% for AGIs $25k-50k, 87.6% for AGIs $50k-75k, 67.4% for AGIs $75k-100k, 469.0% for AGIs $100k-200k, 6120.0% for AGIs over 200k)
Profit/loss from business: +$10,386 (reported on 15.0% of returns)
Here:
+$10,386
State:
+$11,172
(% of AGI for various income ranges: 80.2% for AGIs below $25k, 117.4% for AGIs $25k-50k, 115.2% for AGIs $50k-75k, 380.0% for AGIs $75k-100k, 442.9% for AGIs $100k-200k, 2023.3% for AGIs over 200k)
Taxable individual retirement arrangement distribution: $23,791 (reported on 13.0% of returns)
48137:
$23,791
Michigan:
$19,803
(% of AGI for various income ranges: 81.8% for AGIs below $25k, 177.4% for AGIs $25k-50k, 344.8% for AGIs $50k-75k, 406.3% for AGIs $75k-100k, 1548.1% for AGIs $100k-200k)
Total itemized deductions: $28,384 (reported on 7.7% of returns)
Here:
$28,384
State:
$34,117
(% of AGI for various income ranges: 181.1% for AGIs below $25k, 254.5% for AGIs $50k-75k, 290.5% for AGIs $75k-100k, 693.5% for AGIs $100k-200k, 3793.3% for AGIs over 200k)
Charity contributions: $6,486 (reported on 5.7% of returns)
Here:
$6,486
State:
$13,548
(% of AGI for various income ranges: 56.6% for AGIs $50k-75k, 133.9% for AGIs $100k-200k, 1096.7% for AGIs over 200k)
Taxes paid: $7,111 (reported on 7.7% of returns)
48137:
$7,111
State:
$7,972
(% of AGI for various income ranges: 33.6% for AGIs below $25k, 64.1% for AGIs $50k-75k, 95.8% for AGIs $75k-100k, 184.8% for AGIs $100k-200k, 863.3% for AGIs over 200k)
Earned income credit: $1,700 (reported on 7.7% of returns)
Here:
$1,700
State:
$2,251
(% of AGI for various income ranges: 36.9% for AGIs below $25k, 41.3% for AGIs $25k-50k)
Percentage of individuals using paid preparers for their 2020 taxes: 93.1%
Here:
93%
State:
93%
(% for various income ranges: 92.8% for AGIs below $25k, 93.9% for AGIs $25k-50k, 92.5% for AGIs $50k-75k, 96.2% for AGIs $75k-100k, 92.2% for AGIs $100k-200k, 90.9% for AGIs over 200k)
Averages for the 2012 tax year for zip code 48137, filed in 2013:
Average Adjusted Gross Income (AGI) in 2012: $58,045 (Individual Income Tax Returns)
Here:
$58,045
State:
$55,609
Salary/wage: $51,034 (reported on 83.0% of returns)
Here:
$51,034
State:
$46,782
(% of AGI for various income ranges: 64.4% for AGIs below $25k, 71.4% for AGIs $25k-50k, 70.5% for AGIs $50k-75k, 74.4% for AGIs $75k-100k, 81.0% for AGIs $100k-200k, 59.3% for AGIs over 200k)
Taxable interest for individuals: $1,115 (reported on 37.6% of returns)
This zip code:
$1,115
Michigan:
$1,491
(% of AGI for various income ranges: 1.3% for AGIs below $25k, 1.1% for AGIs $25k-50k, 0.8% for AGIs $50k-75k, 0.7% for AGIs $75k-100k, 0.6% for AGIs $100k-200k, 0.4% for AGIs over 200k)
Ordinary dividends: $2,369 (reported on 22.3% of returns)
Here:
$2,369
State:
$6,225
(% of AGI for various income ranges: 2.3% for AGIs below $25k, 1.2% for AGIs $25k-50k, 0.8% for AGIs $50k-75k, 0.8% for AGIs $75k-100k, 0.9% for AGIs $100k-200k, 0.2% for AGIs over 200k)
Net capital gain/loss in AGI: +$1,919 (reported on 15.7% of returns)
Here:
+$1,919
State:
+$9,326
(% of AGI for various income ranges: 0.5% for AGIs $50k-75k, 0.4% for AGIs $100k-200k, 3.2% for AGIs over 200k)
Profit/loss from business: +$7,100 (reported on 17.0% of returns)
Here:
+$7,100
State:
+$11,523
(% of AGI for various income ranges: 7.9% for AGIs below $25k, 3.3% for AGIs $25k-50k, 2.3% for AGIs $50k-75k, 1.7% for AGIs $75k-100k, 1.3% for AGIs $100k-200k)
Taxable individual retirement arrangement distribution: $15,141 (reported on 12.7% of returns)
48137:
$15,141
Michigan:
$15,298
(% of AGI for various income ranges: 3.6% for AGIs below $25k, 3.3% for AGIs $25k-50k, 3.7% for AGIs $50k-75k, 3.8% for AGIs $75k-100k, 4.0% for AGIs $100k-200k)
Total itemized deductions: $18,812 (20% of AGI, reported on 41.0% of returns)
Here:
$18,812
State:
$21,628
Here:
20.2% of AGI
State:
18.4% of AGI
(% of AGI for various income ranges: 12.3% for AGIs below $25k, 10.8% for AGIs $25k-50k, 13.6% for AGIs $50k-75k, 13.6% for AGIs $75k-100k, 14.7% for AGIs $100k-200k, 12.0% for AGIs over 200k)
Charity contributions: $2,346 (reported on 31.0% of returns)
Here:
$2,346
State:
$4,225
(% of AGI for various income ranges: 0.8% for AGIs below $25k, 0.7% for AGIs $25k-50k, 0.9% for AGIs $50k-75k, 1.3% for AGIs $75k-100k, 1.5% for AGIs $100k-200k, 1.7% for AGIs over 200k)
Taxes paid: $6,972 (reported on 41.0% of returns)
48137:
$6,972
State:
$8,327
(% of AGI for various income ranges: 2.9% for AGIs below $25k, 3.2% for AGIs $25k-50k, 4.4% for AGIs $50k-75k, 4.8% for AGIs $75k-100k, 5.9% for AGIs $100k-200k, 6.2% for AGIs over 200k)
Earned income credit: $1,782 (reported on 12.2% of returns)
Here:
$1,782
State:
$2,306
(% of AGI for various income ranges: 3.9% for AGIs below $25k, 0.9% for AGIs $25k-50k)
Percentage of individuals using paid preparers for their 2012 taxes: 53.7%
Here:
54%
State:
57%
(% for various income ranges: 46.8% for AGIs below $25k, 54.2% for AGIs $25k-50k, 61.5% for AGIs $50k-75k, 57.7% for AGIs $75k-100k, 52.9% for AGIs $100k-200k, 80.0% for AGIs over 200k)
Averages for the 2004 tax year for zip code 48137, filed in 2005:
Average Adjusted Gross Income (AGI) in 2004: $53,073 (Individual Income Tax Returns)
Here:
$53,073
State:
$48,204
Salary/wage: $49,518 (reported on 86.4% of returns)
Here:
$49,518
State:
$42,791
(% of AGI for various income ranges: 91.0% for AGIs below $10k, 65.9% for AGIs $10k-25k, 76.0% for AGIs $25k-50k, 82.2% for AGIs $50k-75k, 86.8% for AGIs $75k-100k, 79.8% for AGIs over 100k)
Taxable interest for individuals: $1,046 (reported on 55.3% of returns)
This zip code:
$1,046
Michigan:
$1,725
(% of AGI for various income ranges: 5.5% for AGIs below $10k, 4.3% for AGIs $10k-25k, 1.8% for AGIs $25k-50k, 0.8% for AGIs $50k-75k, 0.6% for AGIs $75k-100k, 0.7% for AGIs over 100k)
Taxable dividends: $1,257 (reported on 28.1% of returns)
Here:
$1,257
State:
$3,420
(% of AGI for various income ranges: 2.8% for AGIs below $10k, 2.3% for AGIs $10k-25k, 1.2% for AGIs $25k-50k, 0.5% for AGIs $50k-75k, 0.4% for AGIs $75k-100k, 0.4% for AGIs over 100k)
Net capital gain/loss: +$3,846 (reported on 18.2% of returns)
Here:
+$3,846
State:
+$8,532
(% of AGI for various income ranges: -1.8% for AGIs below $10k, -0.2% for AGIs $10k-25k, 0.5% for AGIs $25k-50k, 0.7% for AGIs $50k-75k, 1.3% for AGIs $75k-100k, 2.5% for AGIs over 100k)
Profit/loss from business: +$10,184 (reported on 16.4% of returns)
Here:
+$10,184
State:
+$9,547
(% of AGI for various income ranges: -2.2% for AGIs below $10k, 6.6% for AGIs $10k-25k, 2.3% for AGIs $25k-50k, 2.3% for AGIs $50k-75k, 2.7% for AGIs $75k-100k, 4.0% for AGIs over 100k)
IRA payment deduction: $2,651 (reported on 2.0% of returns)
48137:
$2,651
Michigan:
$2,875
Self-employed pension: $12,000 (reported on 0.5% of returns)
Here:
$12,000
Michigan:
$13,826
Total itemized deductions: $17,784 (23% of AGI, reported on 50.6% of returns)
Here:
$17,784
State:
$18,509
Here:
22.5% of AGI
State:
20.7% of AGI
(% of AGI for various income ranges: 14.5% for AGIs below $10k, 13.9% for AGIs $10k-25k, 17.4% for AGIs $25k-50k, 18.6% for AGIs $50k-75k, 17.6% for AGIs $75k-100k, 15.9% for AGIs over 100k)
Charity contributions deductions: $1,841 (2% of AGI, reported on 42.5% of returns)
Here:
$1,841
State:
$3,365
Here:
2.2% of AGI
State:
3.6% of AGI
(% of AGI for various income ranges: 0.8% for AGIs $10k-25k, 1.1% for AGIs $25k-50k, 1.5% for AGIs $50k-75k, 1.7% for AGIs $75k-100k, 1.6% for AGIs over 100k)
Total tax: $7,100 (reported on 80.9% of returns)
48137:
$7,100
State:
$7,691
(% of AGI for various income ranges: 2.7% for AGIs below $10k, 4.8% for AGIs $10k-25k, 7.0% for AGIs $25k-50k, 8.3% for AGIs $50k-75k, 10.1% for AGIs $75k-100k, 15.7% for AGIs over 100k)
Earned income credit: $1,550 (reported on 6.9% of returns)
Here:
$1,550
State:
$1,737
Percentage of individuals using paid preparers for their 2004 taxes: 58.0%
Here:
58%
State:
60%
(% for various income ranges: 48.7% for AGIs below $10k, 56.0% for AGIs $10k-25k, 59.0% for AGIs $25k-50k, 64.8% for AGIs $50k-75k, 57.8% for AGIs $75k-100k, 62.2% for AGIs over 100k)
Household received Food Stamps/SNAP in the past 12 months: 111 Household did not receive Food Stamps/SNAP in the past 12 months: 1,809
Women who had a birth in the past 12 months: 29 (30 now married, 0 unmarried) Women who did not have a birth in the past 12 months: 629 (371 now married, 255 unmarried)
Housing units in zip code 48137 with a mortgage: 1,176 (95 second mortgage, 95 both second mortgage and home equity loan) Median monthly owner costs for units with a mortgage: $1,706 Median monthly owner costs for units without a mortgage: $538
Residents with income below the poverty level in 2022:
This zip code:
9.0%
Whole state:
13.4%
Residents with income below 50% of the poverty level in 2022:
This zip code:
7.8%
Whole state:
6.9%
Median number of rooms in houses and condos:
Here:
6.8
State:
6.5
Median number of rooms in apartments:
Here:
4.5
State:
4.3
Notable locations in this zip code not listed on our city pages
Notable locations in zip code 48137: Camp Munhacke (A), Camp Grindley (B), Camp Crile (C), Unadilla Township Fire Department (D). Display/hide their locations on the map
Cemeteries: Harford Cemetery (1), Collins Plains Cemetery (2), Unadilla Cemetery (3), Wright Cemetery (4), Williamsville Cemetery (5), Plainfield Village Cemetery (6). Display/hide their locations on the map
Lakes: Twamley Lake (A), Pickerel Lake (B), Wasson Lake (C), North Lake (D), Wild Goose Lake (E), Kuhn Lake (F), Williamsville Lake (G), Joslin Lake (H). Display/hide their locations on the map
Parks in zip code 48137 include: Unadilla State Wildlife Area (1), First Presbyterian Church Historical Marker (2), Plainfield Methodist Protestant Church Historical Marker (3). Display/hide their locations on the map
In group quarters: 10 (-1 institutionalized population)
Size of family households: 953 2-persons, 214 3-persons, 208 4-persons, 52 5-persons, 14 6-persons, 9 7-or-more-persons
Size of nonfamily households: 417 1-person, 65 2-persons
551 married couples with children.
117 single-parent households (75 men, 42 women).
96.5% of residents of 48137 zip code speak English at home.
0.6% of residents speak Spanish at home (77% very well, 23% well).
2.9% of residents speak other Indo-European language at home (100% very well).
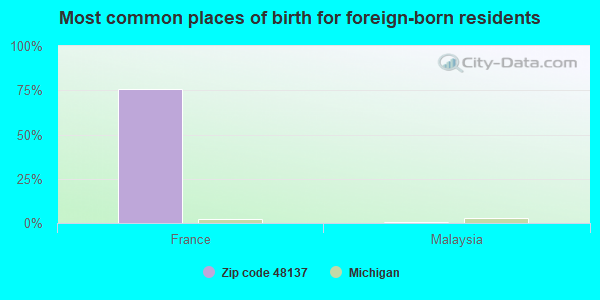
Foreign born population: 136 (3.1%) (79.4% of them are naturalized citizens)
This zip code:
3.1%
Whole state:
6.9%
76%France
1%Malaysia
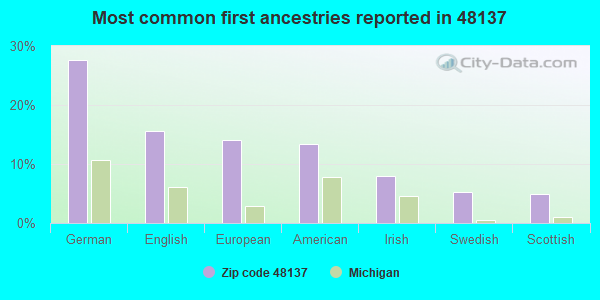
28%German
16%English
14%European
13%American
8%Irish
5%Swedish
5%Scottish
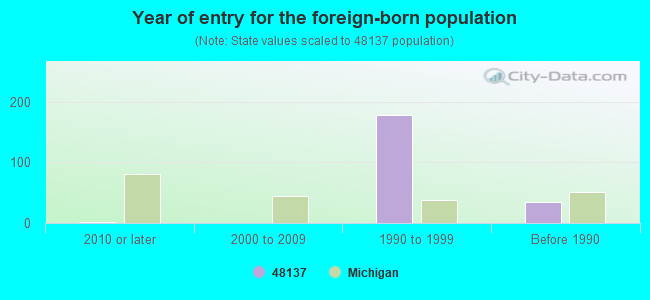
Year of entry for the foreign-born population
12010 or later
02000 to 2009
1781990 to 1999
35Before 1990
Facilities with environmental interests located in this zip code:
MDEQ-GREGORY-MAIN ST GWCU (119 CHURCH ST in GREGORY, MI)
National Pollutant Discharge Elimination System NON-MAJOR (Tracking pollutant discharge elimination systems) - permit Business SIC classification: NONCLASSIFIABLE ESTABLISHMENTS Organizations: MICH. DEPT. OF ENVIRN. QUALITY (CONTACT/OWNER)
MI DEPT/TRANSPORTATION BRIDGE C01-47041 (M-36 OVER LIVERMORE CREEK in GREGORY, MI)
(Resource Conservation and Recovery Act (tracking hazardous waste)) Organizations: MICH DEPT OF TRANSPORTATION (CONTACT/OPERATOR)
Alternative names: MIDOT BRIDGE M-36 OVER LIVERMORE CRK
MDNR-BRUIN LAKE CG WWSL (21237 KAISER RD in GREGORY, MI)
National Pollutant Discharge Elimination System NON-MAJOR (Tracking pollutant discharge elimination systems) - permit Business SIC classification: SPORTING AND RECREATIONAL CAMPS
MI DEPT/ENVIRONMENTAL QUALITY (153 MAIN STREET in GREGORY, MI)
Small Quantity Generators, between 100 kg and 1000 kg of hazardous waste/month (Resource Conservation and Recovery Act (tracking hazardous waste)) Organizations: COMPLIANCE INC (CONTACT/OPERATOR)
, MI DEPT/ENVIRONMENTALQUALITY - RRD (CONTACT/OWNER)
Alternative names: MI DEPT/ENVIRONMENTAL QUALITY (RRD)
FLUIDTHERM CORP (5901 WELLER RD in GREGORY, MI)
Conditionally Exempt Small Quantity Generators, less than 100 kg/month of hazardous waste (Resource Conservation and Recovery Act (tracking hazardous waste)) Business NAICS classification: INDUSTRIAL PROCESS FURNACE AND OVEN MANUFACTURING. Organizations: GLEN PANTKE (CONTACT/OWNER)
CERTIFIED TRACTOR AND AUTO REPAIR INC (14132 WORDEN RD in GREGORY, MI)
Small Quantity Generators, between 100 kg and 1000 kg of hazardous waste/month (Resource Conservation and Recovery Act (tracking hazardous waste)) - notification Business NAICS classification: GENERAL AUTOMOTIVE REPAIR.
Housing units lacking complete plumbing facilities: 1.2% Housing units lacking complete kitchen facilities: 0.8%
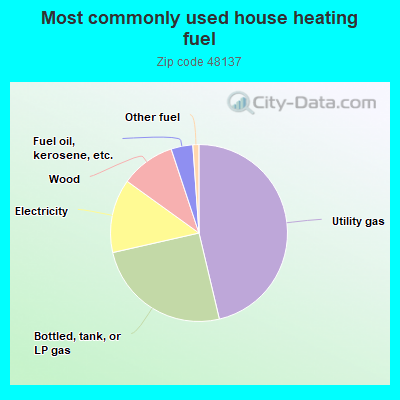
46.4%Utility gas
25.2%Bottled, tank, or LP gas
13.5%Electricity
10.0%Wood
4.0%Fuel oil, kerosene, etc.
1.1%Other fuel
Population in 1990: 3,323. Population change in the 1990s: +1,188 (+35.8%).
Place of birth for U.S.-born residents:
This state: 3,533
Northeast: 96
Midwest: 239
South: 213
West: 26
63% of the 48137 zip code residents lived in the same house 5 years ago. Out of people who lived in different houses, 41% lived in this county. Out of people who lived in different counties, 50% lived in Michigan.
97% of the 48137 zip code residents lived in the same house 1 year ago. Out of people who lived in different houses, 94% moved from this county. Out of people who lived in different houses, 10% moved from different county within same state.
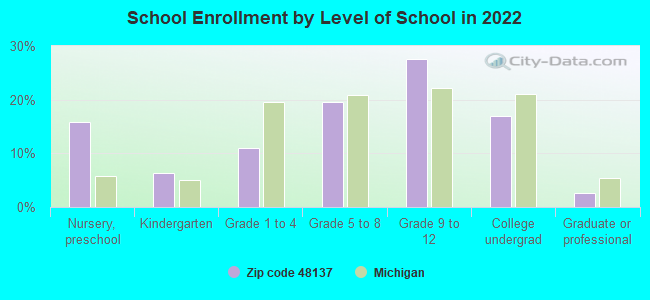
Private vs. public school enrollment:
Students in private schools in grades 1 to 8 (elementary and middle school): 11
Here:
5.1%
Michigan:
12.4%
Students in private schools in grades 9 to 12 (high school):
Here:
0.0%
Michigan:
9.8%
Students in private undergraduate colleges: 35
Here:
28.7%
Michigan:
14.9%
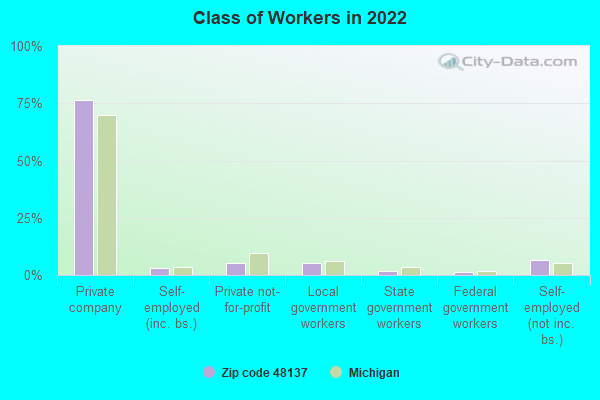
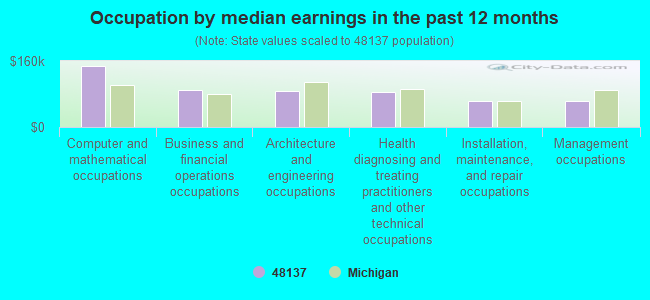
Occupation by median earnings in the past 12 months ($)
147,868Computer and mathematical occupations
90,497Business and financial operations occupations
86,768Architecture and engineering occupations
86,045Health diagnosing and treating practitioners and other technical occupations
63,528Installation, maintenance, and repair occupations
62,081Management occupations
Top industries in this zip code by the number of employees in 2005:
Construction: All Other Specialty Trade Contractors (20-49 employees: 1 establishment)
Finance and Insurance: Commercial Banking (10-19: 1, 5-9: 1)
Real Estate and Rental and Leasing: Lessors of Residential Buildings and Dwellings (10-19: 1, 1-4: 2)
Construction: Plumbing, Heating, and Air-Conditioning Contractors (5-9: 1, 1-4: 6)
Health Care and Social Assistance: Homes for the Elderly (10-19: 1)
Wholesale Trade: Sporting and Recreational Goods and Supplies Merchant Wholesalers (5-9: 1, 1-4: 1)
Information: Cable and Other Program Distribution (5-9: 1, 1-4: 1)
People in group quarters in 2010:
15 people in workers' group living quarters and job corps centers
7 people in group homes intended for adults
People in group quarters in 2000:
88 people in agriculture workers' dormitories on farms
21 people in other noninstitutional group quarters
4 people in other group homes
Fatal accident statistics in 2012:
Fatal accident count: 1
Vehicles involved in fatal accidents: 2
Fatal accidents caused by drunken drivers: 0
Fatalities: 1
Persons involved in fatal accidents: 2
Pedestrians involved in fatal accidents: 0
Fatal accident statistics in 2011:
Fatal accident count: 1
Vehicles involved in fatal accidents: 1
Fatal accidents caused by drunken drivers: 1
Fatalities: 1
Persons involved in fatal accidents: 3
Pedestrians involved in fatal accidents: 0
Home Mortgage Disclosure Act Aggregated Statistics For Year 2009 (Based on 6 partial tracts)
A) FHA, FSA/RHS & VA Home Purchase Loans
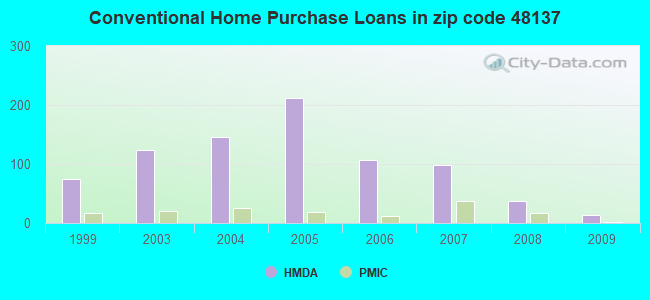
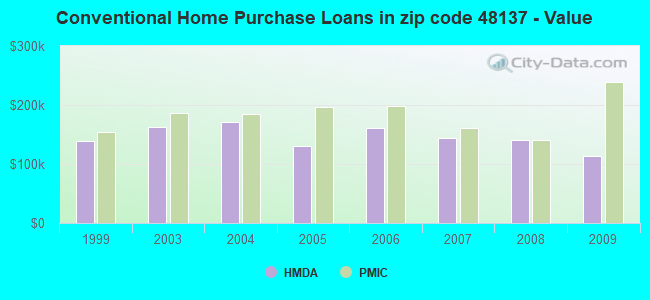
B) Conventional Home Purchase Loans
C) Refinancings
D) Home Improvement Loans
F) Non-occupant Loans on < 5 Family Dwellings (A B C & D)
G) Loans On Manufactured Home Dwelling (A B C & D)
Number
Average Value
Number
Average Value
Number
Average Value
Number
Average Value
Number
Average Value
Number
Average Value
LOANS ORIGINATED
35
$120,429
13
$113,634
149
$162,520
4
$49,108
10
$153,096
4
$111,312
APPLICATIONS APPROVED, NOT ACCEPTED
1
$76,530
4
$76,080
22
$152,091
0
$0
4
$74,610
1
$37,570
APPLICATIONS DENIED
8
$104,384
5
$104,586
83
$172,019
7
$9,999
1
$180,130
5
$62,398
APPLICATIONS WITHDRAWN
8
$105,668
2
$158,440
35
$170,742
0
$0
2
$232,880
1
$76,650
FILES CLOSED FOR INCOMPLETENESS
0
$0
1
$37,760
4
$194,055
0
$0
0
$0
0
$0
Aggregated Statistics For Year 2008 (Based on 6 partial tracts)
A) FHA, FSA/RHS & VA Home Purchase Loans
B) Conventional Home Purchase Loans
C) Refinancings
D) Home Improvement Loans
F) Non-occupant Loans on < 5 Family Dwellings (A B C & D)
G) Loans On Manufactured Home Dwelling (A B C & D)
Number
Average Value
Number
Average Value
Number
Average Value
Number
Average Value
Number
Average Value
Number
Average Value
LOANS ORIGINATED
26
$132,543
37
$140,258
93
$152,262
11
$29,443
11
$105,019
12
$81,438
APPLICATIONS APPROVED, NOT ACCEPTED
1
$147,100
11
$124,745
23
$163,006
1
$16,910
3
$109,457
3
$50,553
APPLICATIONS DENIED
8
$140,859
11
$81,658
96
$179,514
13
$45,001
8
$111,384
8
$65,380
APPLICATIONS WITHDRAWN
9
$91,269
2
$135,410
27
$172,746
2
$53,905
2
$169,565
0
$0
FILES CLOSED FOR INCOMPLETENESS
0
$0
7
$129,546
10
$137,954
1
$207,260
0
$0
0
$0
Aggregated Statistics For Year 2007 (Based on 6 partial tracts)
A) FHA, FSA/RHS & VA Home Purchase Loans
B) Conventional Home Purchase Loans
C) Refinancings
D) Home Improvement Loans
F) Non-occupant Loans on < 5 Family Dwellings (A B C & D)
G) Loans On Manufactured Home Dwelling (A B C & D)
Number
Average Value
Number
Average Value
Number
Average Value
Number
Average Value
Number
Average Value
Number
Average Value
LOANS ORIGINATED
7
$146,110
99
$143,752
198
$160,210
24
$52,141
25
$143,567
8
$113,314
APPLICATIONS APPROVED, NOT ACCEPTED
1
$52,410
6
$145,468
63
$146,123
15
$28,740
7
$127,494
1
$183,730
APPLICATIONS DENIED
3
$154,120
27
$135,241
190
$156,606
21
$61,773
12
$151,232
17
$83,061
APPLICATIONS WITHDRAWN
1
$138,650
7
$150,543
40
$178,210
1
$230,040
3
$122,427
0
$0
FILES CLOSED FOR INCOMPLETENESS
0
$0
8
$239,572
17
$155,518
0
$0
3
$86,267
1
$87,660
Aggregated Statistics For Year 2006 (Based on 6 partial tracts)
A) FHA, FSA/RHS & VA Home Purchase Loans
B) Conventional Home Purchase Loans
C) Refinancings
D) Home Improvement Loans
F) Non-occupant Loans on < 5 Family Dwellings (A B C & D)
G) Loans On Manufactured Home Dwelling (A B C & D)
Number
Average Value
Number
Average Value
Number
Average Value
Number
Average Value
Number
Average Value
Number
Average Value
LOANS ORIGINATED
9
$147,993
107
$160,170
270
$137,578
28
$51,525
12
$166,834
15
$89,427
APPLICATIONS APPROVED, NOT ACCEPTED
0
$0
24
$111,088
41
$153,984
10
$50,604
3
$148,700
5
$74,106
APPLICATIONS DENIED
0
$0
23
$155,970
155
$143,138
30
$71,370
3
$160,627
19
$101,826
APPLICATIONS WITHDRAWN
4
$118,565
12
$116,335
85
$166,596
5
$92,174
10
$147,562
4
$108,098
FILES CLOSED FOR INCOMPLETENESS
1
$180,880
8
$132,648
30
$158,265
2
$80,965
0
$0
1
$59,180
Aggregated Statistics For Year 2005 (Based on 6 partial tracts)
A) FHA, FSA/RHS & VA Home Purchase Loans
B) Conventional Home Purchase Loans
C) Refinancings
D) Home Improvement Loans
F) Non-occupant Loans on < 5 Family Dwellings (A B C & D)
G) Loans On Manufactured Home Dwelling (A B C & D)
Number
Average Value
Number
Average Value
Number
Average Value
Number
Average Value
Number
Average Value
Number
Average Value
LOANS ORIGINATED
4
$181,492
212
$130,094
342
$154,359
24
$91,526
29
$126,831
8
$119,249
APPLICATIONS APPROVED, NOT ACCEPTED
0
$0
18
$135,271
51
$159,444
7
$55,400
4
$141,390
3
$96,007
APPLICATIONS DENIED
3
$70,773
22
$129,307
155
$175,470
27
$68,773
10
$75,979
20
$106,592
APPLICATIONS WITHDRAWN
2
$118,700
24
$118,058
113
$169,509
7
$178,234
3
$210,100
5
$107,134
FILES CLOSED FOR INCOMPLETENESS
0
$0
5
$121,372
46
$176,533
0
$0
0
$0
1
$172,530
Aggregated Statistics For Year 2004 (Based on 6 partial tracts)
A) FHA, FSA/RHS & VA Home Purchase Loans
B) Conventional Home Purchase Loans
C) Refinancings
D) Home Improvement Loans
E) Loans on Dwellings For 5+ Families
F) Non-occupant Loans on < 5 Family Dwellings (A B C & D)
G) Loans On Manufactured Home Dwelling (A B C & D)
Number
Average Value
Number
Average Value
Number
Average Value
Number
Average Value
Number
Average Value
Number
Average Value
Number
Average Value
LOANS ORIGINATED
7
$140,236
146
$170,397
370
$159,874
29
$67,026
0
$0
17
$149,009
14
$110,053
APPLICATIONS APPROVED, NOT ACCEPTED
0
$0
24
$139,955
45
$155,798
5
$24,612
1
$194,800
0
$0
2
$18,715
APPLICATIONS DENIED
0
$0
23
$131,533
139
$141,042
11
$21,494
0
$0
1
$66,910
18
$89,938
APPLICATIONS WITHDRAWN
3
$95,543
15
$149,987
105
$162,840
2
$39,735
0
$0
2
$89,895
3
$124,307
FILES CLOSED FOR INCOMPLETENESS
0
$0
7
$120,450
51
$165,711
0
$0
0
$0
0
$0
9
$102,126
Aggregated Statistics For Year 2003 (Based on 6 partial tracts)
A) FHA, FSA/RHS & VA Home Purchase Loans
B) Conventional Home Purchase Loans
C) Refinancings
D) Home Improvement Loans
F) Non-occupant Loans on < 5 Family Dwellings (A B C & D)
Number
Average Value
Number
Average Value
Number
Average Value
Number
Average Value
Number
Average Value
LOANS ORIGINATED
8
$160,866
124
$163,403
875
$148,222
19
$76,047
33
$142,184
APPLICATIONS APPROVED, NOT ACCEPTED
0
$0
19
$163,048
98
$165,983
1
$1,130
6
$155,713
APPLICATIONS DENIED
2
$121,630
27
$112,736
187
$150,569
21
$33,201
3
$161,397
APPLICATIONS WITHDRAWN
1
$154,450
16
$128,094
88
$155,818
2
$115,660
3
$118,730
FILES CLOSED FOR INCOMPLETENESS
2
$133,880
4
$133,978
35
$162,739
3
$39,957
1
$116,100
Aggregated Statistics For Year 1999 (Based on 2 partial tracts)
A) FHA, FSA/RHS & VA Home Purchase Loans
B) Conventional Home Purchase Loans
C) Refinancings
D) Home Improvement Loans
F) Non-occupant Loans on < 5 Family Dwellings (A B C & D)
2002 - 2018 National Fire Incident Reporting System (NFIRS) incidents
Based on the data from the years 2002 - 2018 the average number of fires per year is 19. The highest number of reported fire incidents - 34 took place in 2015, and the least - 9 in 2007. The data has a rising trend.
When looking into fire subcategories, the most incidents belonged to: Structure Fires (52.3%), and Outside Fires (38.3%).
Fire incident types reported to NFIRS in Zip Code 48137


 Nearest zip codes: 48169, 49285, 48118, 48843, 48130, 48892.


 Based on the data from the years 2002 - 2018 the average number of fires per year is 19. The highest number of reported fire incidents - 34 took place in 2015, and the least - 9 in 2007. The data has a rising trend.
 When looking into fire subcategories, the most incidents belonged to: Structure Fires (52.3%), and Outside Fires (38.3%).