Estimated zip code population in 2022: 22,362 Zip code population in 2010: 20,669 Zip code population in 2000: 19,225
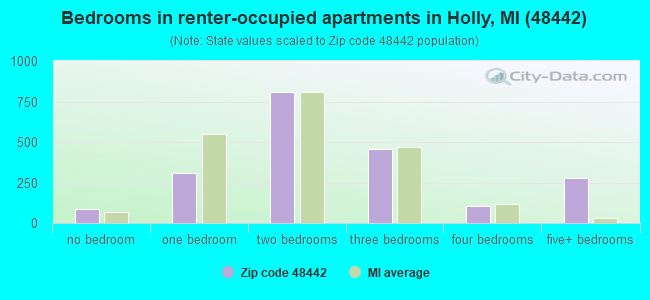
Houses and condos: 9,627 Renter-occupied apartments: 2,030
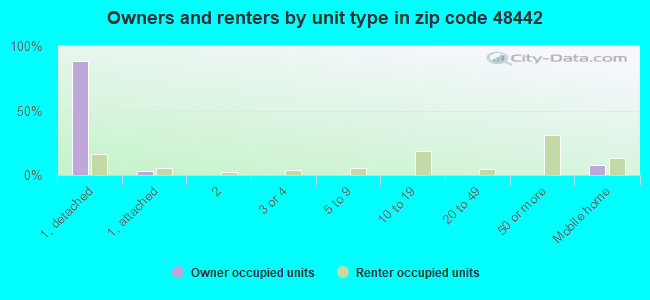
% of renters here:
22%
State:
27%
March 2022 cost of living index in zip code 48442: 96.6 (near average, U.S. average is 100)
Land area: 85.4 sq. mi. Water area: 3.7 sq. mi.
Population density: 262 people per square mile
(very low).
OSM Map
General Map
Google Map
MSN Map
OSM Map
General Map
Google Map
MSN Map
OSM Map
General Map
Google Map
MSN Map
OSM Map
General Map
Google Map
MSN Map
Please wait while loading the map...
Real estate property taxes paid for housing units in 2022:
This zip code:
1.0% ($2,703)
Michigan:
1.2% ($2,746)
Median real estate property taxes paid for housing units with mortgages in 2022: $2,854 (1.0%) Median real estate property taxes paid for housing units with no mortgage in 2022: $2,388 (1.0%)
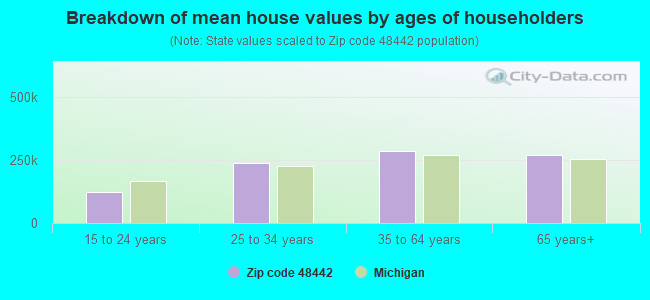
Estimated median house/condo value in 2022: $263,678
48442:
$263,678
Michigan:
$224,400
According to our research of Michigan and other state lists, there were 50 registered sex offenders living in 48442 zip code as of April 26, 2024. The ratio of all residents to sex offenders in zip code 48442 is 422 to 1. The ratio of registered sex offenders to all residents in this zip code is lower than the state average.
Median resident age:
This zip code:
44.2 years
Michigan median age:
40.3 years
Average household size:
This zip code:
2.4 people
Michigan:
2.4 people
Averages for the 2020 tax year for zip code 48442, filed in 2021:
Average Adjusted Gross Income (AGI) in 2020: $65,928 (Individual Income Tax Returns)
Here:
$65,928
State:
$68,945
Salary/wage: $57,406 (reported on 80.2% of returns)
Here:
$57,406
State:
$57,142
(% of AGI for various income ranges: 928.2% for AGIs below $25k, 3056.6% for AGIs $25k-50k, 5816.6% for AGIs $50k-75k, 8955.6% for AGIs $75k-100k, 16517.6% for AGIs $100k-200k, 63615.8% for AGIs over 200k)
Taxable interest for individuals: $1,113 (reported on 28.0% of returns)
This zip code:
$1,113
Michigan:
$1,630
(% of AGI for various income ranges: 11.2% for AGIs below $25k, 13.4% for AGIs $25k-50k, 31.9% for AGIs $50k-75k, 45.2% for AGIs $75k-100k, 68.8% for AGIs $100k-200k, 1054.2% for AGIs over 200k)
Ordinary dividends: $4,232 (reported on 15.9% of returns)
Here:
$4,232
State:
$6,972
(% of AGI for various income ranges: 19.6% for AGIs below $25k, 24.2% for AGIs $25k-50k, 66.6% for AGIs $50k-75k, 61.7% for AGIs $75k-100k, 155.3% for AGIs $100k-200k, 2658.3% for AGIs over 200k)
Net capital gain/loss in AGI: +$8,486 (reported on 15.4% of returns)
Here:
+$8,486
State:
+$20,064
(% of AGI for various income ranges: 6.7% for AGIs below $25k, 16.8% for AGIs $25k-50k, 52.4% for AGIs $50k-75k, 114.4% for AGIs $75k-100k, 370.8% for AGIs $100k-200k, 6474.2% for AGIs over 200k)
Profit/loss from business: +$10,224 (reported on 15.0% of returns)
Here:
+$10,224
State:
+$11,172
(% of AGI for various income ranges: 81.0% for AGIs below $25k, 137.4% for AGIs $25k-50k, 200.5% for AGIs $50k-75k, 193.1% for AGIs $75k-100k, 360.4% for AGIs $100k-200k, 3085.8% for AGIs over 200k)
Taxable individual retirement arrangement distribution: $18,298 (reported on 9.5% of returns)
48442:
$18,298
Michigan:
$19,803
(% of AGI for various income ranges: 51.8% for AGIs below $25k, 92.0% for AGIs $25k-50k, 183.7% for AGIs $50k-75k, 293.2% for AGIs $75k-100k, 705.1% for AGIs $100k-200k, 2364.2% for AGIs over 200k)
Self-employed (Keogh) retirement plans: $14,567 (reported on 0.3% of returns)
48442:
$14,567
Michigan:
$25,132
(% of AGI for various income ranges: 39.0% for AGIs $100k-200k)
Total itemized deductions: $27,047 (reported on 5.8% of returns)
Here:
$27,047
State:
$34,117
(% of AGI for various income ranges: 21.3% for AGIs below $25k, 71.4% for AGIs $25k-50k, 203.0% for AGIs $50k-75k, 263.9% for AGIs $75k-100k, 547.5% for AGIs $100k-200k, 3210.0% for AGIs over 200k)
Charity contributions: $7,080 (reported on 4.7% of returns)
Here:
$7,080
State:
$13,548
(% of AGI for various income ranges: 3.2% for AGIs below $25k, 6.4% for AGIs $25k-50k, 28.0% for AGIs $50k-75k, 43.4% for AGIs $75k-100k, 115.2% for AGIs $100k-200k, 1155.8% for AGIs over 200k)
Taxes paid: $7,658 (reported on 5.8% of returns)
48442:
$7,658
State:
$7,972
(% of AGI for various income ranges: 3.4% for AGIs below $25k, 12.7% for AGIs $25k-50k, 60.9% for AGIs $50k-75k, 82.6% for AGIs $75k-100k, 169.4% for AGIs $100k-200k, 858.3% for AGIs over 200k)
Earned income credit: $1,939 (reported on 11.3% of returns)
Here:
$1,939
State:
$2,251
(% of AGI for various income ranges: 56.9% for AGIs below $25k, 51.2% for AGIs $25k-50k, 1.7% for AGIs $50k-75k)
Percentage of individuals using paid preparers for their 2020 taxes: 93.9%
Here:
94%
State:
93%
(% for various income ranges: 92.9% for AGIs below $25k, 94.0% for AGIs $25k-50k, 94.4% for AGIs $50k-75k, 93.5% for AGIs $75k-100k, 95.0% for AGIs $100k-200k, 94.4% for AGIs over 200k)
Averages for the 2012 tax year for zip code 48442, filed in 2013:
Average Adjusted Gross Income (AGI) in 2012: $57,153 (Individual Income Tax Returns)
Here:
$57,153
State:
$55,609
Salary/wage: $48,091 (reported on 85.0% of returns)
Here:
$48,091
State:
$46,782
(% of AGI for various income ranges: 66.7% for AGIs below $25k, 69.6% for AGIs $25k-50k, 74.0% for AGIs $50k-75k, 76.4% for AGIs $75k-100k, 79.2% for AGIs $100k-200k, 53.6% for AGIs over 200k)
Taxable interest for individuals: $920 (reported on 31.5% of returns)
This zip code:
$920
Michigan:
$1,491
(% of AGI for various income ranges: 1.0% for AGIs below $25k, 0.6% for AGIs $25k-50k, 0.5% for AGIs $50k-75k, 0.3% for AGIs $75k-100k, 0.5% for AGIs $100k-200k, 0.5% for AGIs over 200k)
Ordinary dividends: $3,234 (reported on 16.8% of returns)
Here:
$3,234
State:
$6,225
(% of AGI for various income ranges: 1.3% for AGIs below $25k, 0.7% for AGIs $25k-50k, 0.7% for AGIs $50k-75k, 0.4% for AGIs $75k-100k, 0.5% for AGIs $100k-200k, 2.7% for AGIs over 200k)
Net capital gain/loss in AGI: +$5,388 (reported on 14.1% of returns)
Here:
+$5,388
State:
+$9,326
(% of AGI for various income ranges: 0.3% for AGIs $75k-100k, 0.6% for AGIs $100k-200k, 7.4% for AGIs over 200k)
Profit/loss from business: +$10,874 (reported on 14.4% of returns)
Here:
+$10,874
State:
+$11,523
(% of AGI for various income ranges: 7.5% for AGIs below $25k, 3.8% for AGIs $25k-50k, 2.1% for AGIs $50k-75k, 1.8% for AGIs $75k-100k, 1.9% for AGIs $100k-200k, 2.7% for AGIs over 200k)
Taxable individual retirement arrangement distribution: $16,121 (reported on 10.4% of returns)
48442:
$16,121
Michigan:
$15,298
(% of AGI for various income ranges: 2.7% for AGIs below $25k, 2.7% for AGIs $25k-50k, 2.7% for AGIs $50k-75k, 2.7% for AGIs $75k-100k, 3.3% for AGIs $100k-200k, 3.1% for AGIs over 200k)
Self-employment retirement plans: $12,500 (reported on 0.2% of returns)
48442:
$12,500
Michigan:
$20,834
Total itemized deductions: $19,596 (19% of AGI, reported on 33.6% of returns)
Here:
$19,596
State:
$21,628
Here:
18.8% of AGI
State:
18.4% of AGI
(% of AGI for various income ranges: 8.0% for AGIs below $25k, 9.2% for AGIs $25k-50k, 11.4% for AGIs $50k-75k, 12.4% for AGIs $75k-100k, 13.7% for AGIs $100k-200k, 10.6% for AGIs over 200k)
Charity contributions: $2,992 (reported on 28.0% of returns)
Here:
$2,992
State:
$4,225
(% of AGI for various income ranges: 0.7% for AGIs below $25k, 0.9% for AGIs $25k-50k, 1.3% for AGIs $50k-75k, 1.5% for AGIs $75k-100k, 2.0% for AGIs $100k-200k, 1.6% for AGIs over 200k)
Taxes paid: $6,932 (reported on 33.5% of returns)
48442:
$6,932
State:
$8,327
(% of AGI for various income ranges: 1.6% for AGIs below $25k, 2.3% for AGIs $25k-50k, 3.4% for AGIs $50k-75k, 4.1% for AGIs $75k-100k, 5.4% for AGIs $100k-200k, 5.1% for AGIs over 200k)
Earned income credit: $2,096 (reported on 14.9% of returns)
Here:
$2,096
State:
$2,306
(% of AGI for various income ranges: 5.2% for AGIs below $25k, 1.1% for AGIs $25k-50k)
Percentage of individuals using paid preparers for their 2012 taxes: 54.4%
Here:
54%
State:
57%
(% for various income ranges: 49.1% for AGIs below $25k, 55.1% for AGIs $25k-50k, 59.4% for AGIs $50k-75k, 56.6% for AGIs $75k-100k, 56.8% for AGIs $100k-200k, 78.9% for AGIs over 200k)
Averages for the 2004 tax year for zip code 48442, filed in 2005:
Average Adjusted Gross Income (AGI) in 2004: $50,459 (Individual Income Tax Returns)
Here:
$50,459
State:
$48,204
Salary/wage: $46,607 (reported on 88.7% of returns)
Here:
$46,607
State:
$42,791
(% of AGI for various income ranges: 103.8% for AGIs below $10k, 69.5% for AGIs $10k-25k, 76.2% for AGIs $25k-50k, 84.9% for AGIs $50k-75k, 88.5% for AGIs $75k-100k, 80.3% for AGIs over 100k)
Taxable interest for individuals: $1,150 (reported on 47.4% of returns)
This zip code:
$1,150
Michigan:
$1,725
(% of AGI for various income ranges: 3.8% for AGIs below $10k, 2.0% for AGIs $10k-25k, 1.3% for AGIs $25k-50k, 0.9% for AGIs $50k-75k, 0.6% for AGIs $75k-100k, 1.1% for AGIs over 100k)
Taxable dividends: $1,896 (reported on 22.2% of returns)
Here:
$1,896
State:
$3,420
(% of AGI for various income ranges: 2.9% for AGIs below $10k, 1.1% for AGIs $10k-25k, 0.8% for AGIs $25k-50k, 0.6% for AGIs $50k-75k, 0.3% for AGIs $75k-100k, 1.2% for AGIs over 100k)
Net capital gain/loss: +$3,630 (reported on 17.4% of returns)
Here:
+$3,630
State:
+$8,532
(% of AGI for various income ranges: -1.7% for AGIs below $10k, 0.2% for AGIs $10k-25k, 0.3% for AGIs $25k-50k, 0.2% for AGIs $50k-75k, 0.6% for AGIs $75k-100k, 3.0% for AGIs over 100k)
Profit/loss from business: +$8,342 (reported on 14.9% of returns)
Here:
+$8,342
State:
+$9,547
(% of AGI for various income ranges: 2.2% for AGIs below $10k, 6.3% for AGIs $10k-25k, 2.7% for AGIs $25k-50k, 1.7% for AGIs $50k-75k, 1.7% for AGIs $75k-100k, 2.6% for AGIs over 100k)
IRA payment deduction: $2,779 (reported on 2.1% of returns)
48442:
$2,779
Michigan:
$2,875
(% of AGI for various income ranges: 0.1% for AGIs $10k-25k, 0.2% for AGIs $25k-50k, 0.1% for AGIs $50k-75k, 0.1% for AGIs $75k-100k, 0.1% for AGIs over 100k)
Self-employed pension: $9,067 (reported on 0.3% of returns)
Here:
$9,067
Michigan:
$13,826
Total itemized deductions: $18,223 (23% of AGI, reported on 45.0% of returns)
Here:
$18,223
State:
$18,509
Here:
22.5% of AGI
State:
20.7% of AGI
(% of AGI for various income ranges: 13.3% for AGIs below $10k, 15.4% for AGIs $10k-25k, 14.6% for AGIs $25k-50k, 19.3% for AGIs $50k-75k, 17.3% for AGIs $75k-100k, 14.8% for AGIs over 100k)
Charity contributions deductions: $2,257 (3% of AGI, reported on 39.5% of returns)
Here:
$2,257
State:
$3,365
Here:
2.7% of AGI
State:
3.6% of AGI
(% of AGI for various income ranges: 0.6% for AGIs below $10k, 1.0% for AGIs $10k-25k, 1.6% for AGIs $25k-50k, 1.8% for AGIs $50k-75k, 1.9% for AGIs $75k-100k, 2.0% for AGIs over 100k)
Total tax: $6,937 (reported on 79.8% of returns)
48442:
$6,937
State:
$7,691
(% of AGI for various income ranges: 3.5% for AGIs below $10k, 4.5% for AGIs $10k-25k, 6.9% for AGIs $25k-50k, 8.4% for AGIs $50k-75k, 10.1% for AGIs $75k-100k, 16.4% for AGIs over 100k)
Earned income credit: $1,618 (reported on 10.8% of returns)
Here:
$1,618
State:
$1,737
Percentage of individuals using paid preparers for their 2004 taxes: 59.1%
Here:
59%
State:
60%
(% for various income ranges: 48.9% for AGIs below $10k, 60.2% for AGIs $10k-25k, 62.4% for AGIs $25k-50k, 59.8% for AGIs $50k-75k, 61.5% for AGIs $75k-100k, 63.5% for AGIs over 100k)
Likely homosexual households (counted as self-reported same-sex unmarried-partner households)
Lesbian couples: 0.2% of all households
Gay men: 0.1% of all households
Household received Food Stamps/SNAP in the past 12 months: 1,193 Household did not receive Food Stamps/SNAP in the past 12 months: 8,151
Women who had a birth in the past 12 months: 203 (113 now married, 88 unmarried) Women who did not have a birth in the past 12 months: 4,560 (2,181 now married, 2,370 unmarried)
Housing units in zip code 48442 with a mortgage: 4,765 (562 second mortgage, 11 home equity loan, 387 both second mortgage and home equity loan) Houses without a mortgage: 126
Median monthly owner costs for units with a mortgage: $1,560 Median monthly owner costs for units without a mortgage: $581
Residents with income below the poverty level in 2022:
This zip code:
9.2%
Whole state:
13.4%
Residents with income below 50% of the poverty level in 2022:
This zip code:
3.8%
Whole state:
6.9%
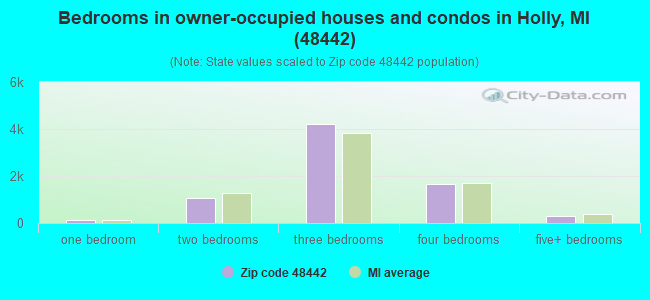
Median number of rooms in houses and condos:
Here:
6.6
State:
6.5
Median number of rooms in apartments:
Here:
4.5
State:
4.3
Notable locations in this zip code not listed on our city pages
Notable locations in zip code 48442: Camp Holly (A), Bramblewood Country Club (B), Groveland Mills (C), Guardian Angel Camp (D), Camp Wathana (E), Mount Holly Ski Area (F), Dundee Welcome Center (G), Village of Holly Fire Department (H), Groveland Township Fire Department Station 1 (I), Highland Township Fire Department Station 3 (J), North Oakland County Fire Authority Station 2 Headquarters (K), North Oakland County Fire Authority Station 3 (L), North Oakland County Fire Authority Ambulance (M). Display/hide their locations on the map
Cemeteries: Hadley Cemetery (1), Lakeside Cemetery (2), Rose Center Cemetery (3), Olive Branch Cemetery (4), Beebe Cemetery (5), Mount Bethel Cemetery (6), Seaver Cemetery (7). Display/hide their locations on the map
Lakes, reservoirs, and swamps: Martin Lake (A), Marl Lake (B), Richardson Lake (C), Rice Lake (D), Rattalee Lake (E), Valley Lake (F), Pine Lake (G), Pier Lake (H). Display/hide their locations on the map
Parks in zip code 48442 include: Groveland Oaks County Park (1), Battle Alley Historical Marker (2), Crapo Park Historical Marker (3), Holly's Town Hall Historical Marker (4), Rose Township Hall Historical Marker (5), Rose Oaks County Park (6), Cyclone Park (7), Lakeside Memorial Park (8), Holly State Recreation Area (9). Display/hide their locations on the map
2,659 married couples with children.
1,183 single-parent households (281 men, 902 women).
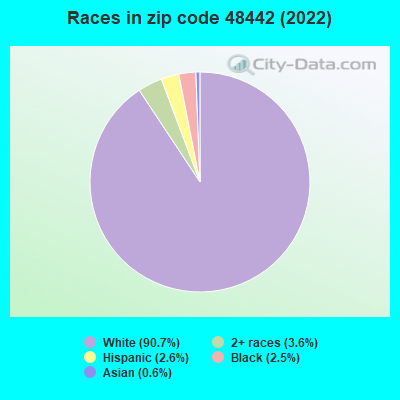
95.9% of residents of 48442 zip code speak English at home.
1.0% of residents speak Spanish at home (72% very well, 20% well, 8% not well).
1.6% of residents speak other Indo-European language at home (91% very well, 6% well, 3% not well).
0.5% of residents speak Asian or Pacific Island language at home (32% very well, 68% well).
0.6% of residents speak other language at home (53% very well, 47% well).
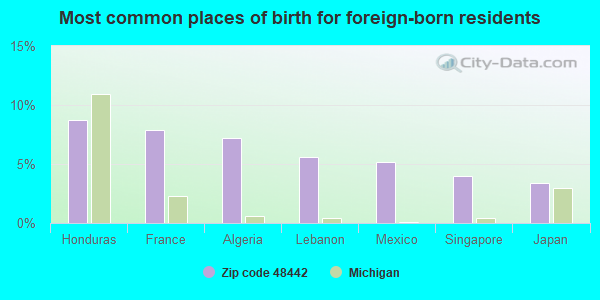
Foreign born population: 843 (3.8%) (51.2% of them are naturalized citizens)
This zip code:
3.8%
Whole state:
6.9%
9%Honduras
8%France
7%Algeria
6%Lebanon
5%Mexico
4%Singapore
3%Japan
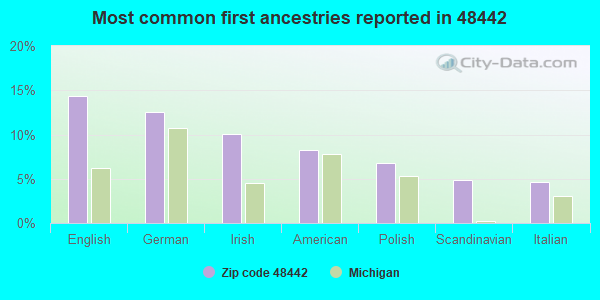
14%English
13%German
10%Irish
8%American
7%Polish
5%Scandinavian
5%Italian
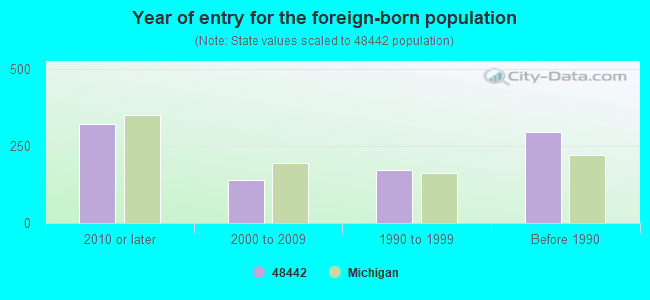
Year of entry for the foreign-born population
3222010 or later
1402000 to 2009
1731990 to 1999
296Before 1990
Major facilities with environmental interests located in this zip code:
ADELPHIAN ACADEMY (820 ACADEMY RD in HOLLY, MI)
(Integrated Compliance Information System) - ICIS-05-1986-0480, FORMAL ENFORCEMENT ACTION (Integrated Compliance Information System) - ICIS-05-2004-0004, FORMAL ENFORCEMENT ACTION COMPLIANCE ACTIVITY (Tracking inspections of insecticide, fungicide, and rodenticide, and toxic substances) (National Center for Education Statistics) - STATE ID-08734 Business SIC classification: ELEMENTARY AND SECONDARY SCHOOLS Organizations: HOLLY ACADEMY (SCHOOL DISTRICT)
Alternative names: HOLLY ACADEMY
GRAND BLANC PROCESSING (10151 GAINEY DRIVE in HOLLY, MI)
HAZARDOUS WASTE BIENNIAL REPORTER (Resource Conservation and Recovery Act (tracking hazardous waste)) Large Quantity Generators, more that 1000 kg of hazardous waste/month (Resource Conservation and Recovery Act (tracking hazardous waste)) - notification TRI REPORTER (Tracking of toxic chemicals releasing facilities) Business SIC classification: COATING, ENGRAVING, AND ALLIED SERVICES Organizations: GRAND BLANC PROCESSING LLC (CONTACT/OPERATOR)
Alternative names: GRAND BLANC PROCESSING L.L.C.
ADELPHIAN ACADEMY (124 ACADEMY RD in HOLLY, MI)
(Resource Conservation and Recovery Act (tracking hazardous waste)) Organizations: MICHIGAN CONF OF SDA (CONTACT/OWNER)
GEORGE FISCHER FOUNDRY (407 HADLEY ST in HOLLY, MI)
(Resource Conservation and Recovery Act (tracking hazardous waste)) Business NAICS classification: STEEL FOUNDRIES (EXCEPT INVESTMENT). Organizations: FISCHER GEORGE FOUNDRY SYSTEMS (CONTACT/OWNER)
Alternative names: FISCHER GEORGE FOUNDRY
GRANGE HALL MART INC (15030 DIXIE HWY in HOLLY, MI)
GROVELAND OAKS COUNTY PARK (14555 DIXIE HWY in HOLLY, MI)
(Resource Conservation and Recovery Act (tracking hazardous waste)) Organizations: COUNTY OF OAKLAND PARKS (CONTACT/OPERATOR)
ALPHA FOAM (NB I-75 NEAR MM 103 in HOLLY, MI)
(Resource Conservation and Recovery Act (tracking hazardous waste)) Alternative names: ALPHA FOAM (E)
ARCO PRODUCTS CO (220 ELM ST in HOLLY, MI)
(Resource Conservation and Recovery Act (tracking hazardous waste)) Business NAICS classification: HAND AND EDGE TOOL MANUFACTURING.
MI DEPT/ENVIRONMENTAL QUALITY (5420 MCGINNIS RD in HOLLY, MI)
(Resource Conservation and Recovery Act (tracking hazardous waste)) Alternative names: HOLLY RECREATION AREA
GIBRALTAR NATIONAL CORP (7030 SHIELDS RD in HOLLY, MI)
AIR SYNTHETIC MINOR (AIRS/AFS) CRITERIA AND HAZARDOUS AIR POLLUTANT INVENTORY (Inventory of air pollution sources) Business SIC classification: CEMENT, HYDRAULIC; CONCRETE PRODUCTS, EXCEPT BLOCK AND BRICK
GROVELAND WASTE MGMT & LAND RECLAM CTR (GRANGE HALL RD in HOLLY, MI)
(Resource Conservation and Recovery Act (tracking hazardous waste)) Business NAICS classification: SOLID WASTE LANDFILL.
E & M INDUSTRIES OF HOLLY INC (212 ELM ST in HOLLY, MI)
AIR MINOR (AIRS/AFS) Business SIC classification: NONCLASSIFIABLE ESTABLISHMENTS
ARMSTEAD AUTOMOTIVE (15310 FISH LAKE RD in HOLLY, MI)
Conditionally Exempt Small Quantity Generators, less than 100 kg/month of hazardous waste (Resource Conservation and Recovery Act (tracking hazardous waste)) Business NAICS classification: GENERAL AUTOMOTIVE REPAIR. Organizations: JOHN ARMSTEAD (CONTACT/OWNER)
Housing units lacking complete plumbing facilities: 0.1% Housing units lacking complete kitchen facilities: 2.1%
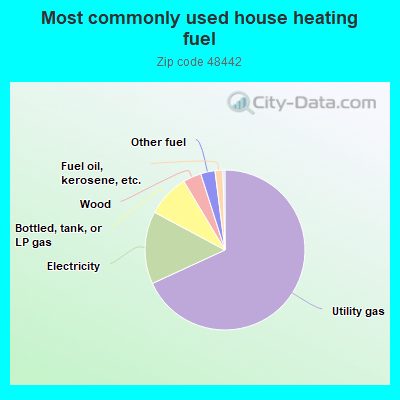
68.2%Utility gas
14.7%Electricity
8.6%Bottled, tank, or LP gas
3.7%Wood
2.9%Other fuel
1.6%Fuel oil, kerosene, etc.
Population in 1990: 15,119. Population change in the 1990s: +4,106 (+27.2%).
Place of birth for U.S.-born residents:
This state: 18,631
Northeast: 472
Midwest: 1,068
South: 738
West: 500
59% of the 48442 zip code residents lived in the same house 5 years ago. Out of people who lived in different houses, 58% lived in this county. Out of people who lived in different counties, 50% lived in Michigan.
92% of the 48442 zip code residents lived in the same house 1 year ago. Out of people who lived in different houses, 49% moved from this county. Out of people who lived in different houses, 44% moved from different county within same state. Out of people who lived in different houses, 3% moved from different state. Out of people who lived in different houses, 3% moved from abroad.
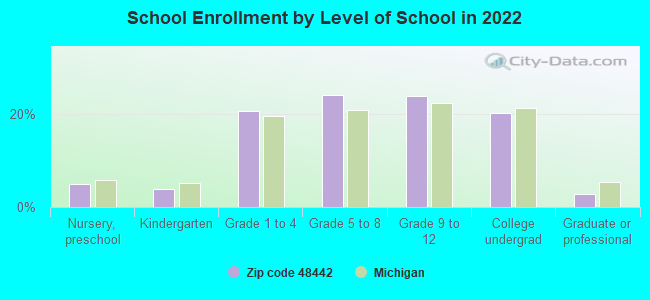
Private vs. public school enrollment:
Students in private schools in grades 1 to 8 (elementary and middle school): 147
Here:
7.2%
Michigan:
12.4%
Students in private schools in grades 9 to 12 (high school): 88
Here:
8.1%
Michigan:
9.8%
Students in private undergraduate colleges: 113
Here:
12.2%
Michigan:
14.9%
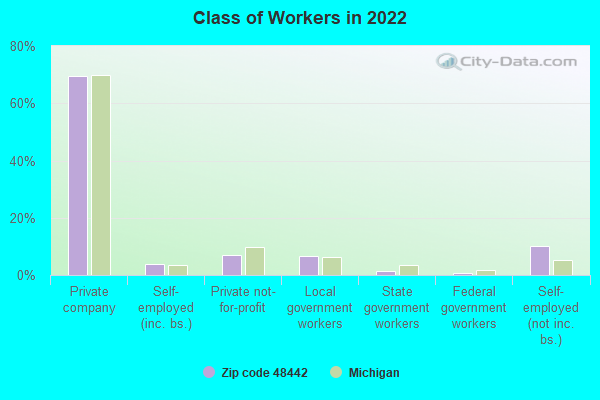
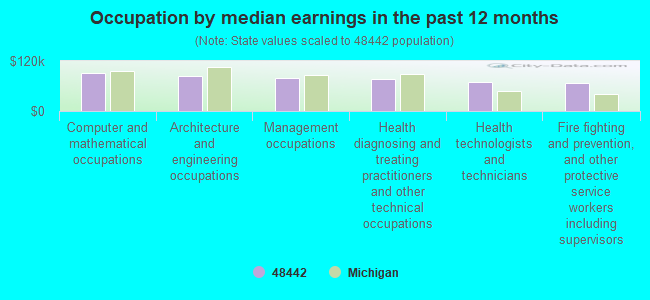
Occupation by median earnings in the past 12 months ($)
92,142Computer and mathematical occupations
83,611Architecture and engineering occupations
78,265Management occupations
75,619Health diagnosing and treating practitioners and other technical occupations
69,024Health technologists and technicians
66,001Fire fighting and prevention, and other protective service workers including supervisors
Companies with federal contracts located in this zip code:
LIQUID DRIVE CORPORATION (418 HADLEY STREET in HOLLY, MI; small business)
$35,910 with Navy for Maintenance, Repair and Rebuilding of Equipment -- Furnace, Steam Plant, and Drying Equipment; and Nuclear Reactors. Signed on 2001-07-26. Completion date: 2001-09-30.
CASSNER AUTOMOTIVE GROUP (3272 HERRINGTON DR in HOLLY, MI; small business)
$12,722 with Army for Vehicular Power Transmission Components. Signed on 2005-10-06. Completion date: 2006-09-06.
Top industries in this zip code by the number of employees in 2005:
2002 - 2018 National Fire Incident Reporting System (NFIRS) incidents
According to the data from the years 2002 - 2018 the average number of fire incidents per year is 69. The highest number of reported fire incidents - 89 took place in 2011, and the least - 53 in 2002. The data has a rising trend.
When looking into fire subcategories, the most incidents belonged to: Structure Fires (46.0%), and Outside Fires (31.9%).
Fire incident types reported to NFIRS in Zip Code 48442

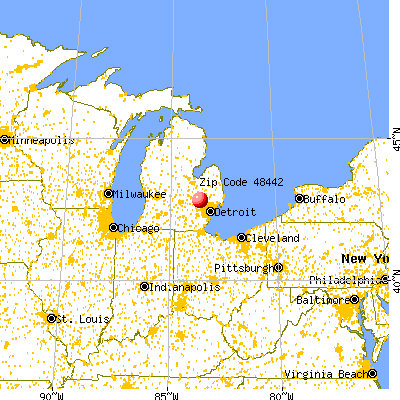


 Nearest zip codes: 48350, 48439, 48356, 48357, 48430, 48383.


 According to the data from the years 2002 - 2018 the average number of fire incidents per year is 69. The highest number of reported fire incidents - 89 took place in 2011, and the least - 53 in 2002. The data has a rising trend.
 When looking into fire subcategories, the most incidents belonged to: Structure Fires (46.0%), and Outside Fires (31.9%).