Estimated zip code population in 2022: 19,063 Zip code population in 2010: 20,538 Zip code population in 2000: 24,309
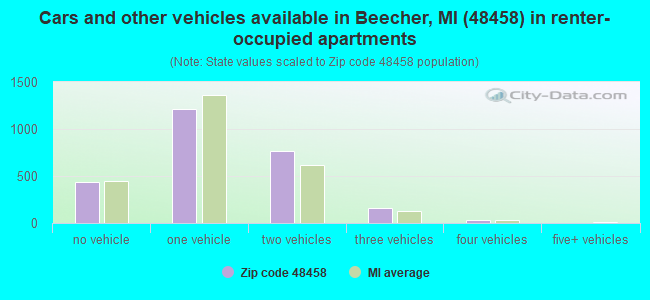
Houses and condos: 9,108 Renter-occupied apartments: 2,619
% of renters here:
32%
State:
27%
March 2022 cost of living index in zip code 48458: 79.9 (low, U.S. average is 100)
Land area: 35.1 sq. mi. Water area: 0.1 sq. mi.
Population density: 543 people per square mile
(low).
OSM Map
General Map
Google Map
MSN Map
OSM Map
General Map
Google Map
MSN Map
OSM Map
General Map
Google Map
MSN Map
OSM Map
General Map
Google Map
MSN Map
Please wait while loading the map...
Real estate property taxes paid for housing units in 2022:
This zip code:
1.6% ($1,503)
Michigan:
1.2% ($2,746)
Median real estate property taxes paid for housing units with mortgages in 2022: $1,746 (1.6%) Median real estate property taxes paid for housing units with no mortgage in 2022: $1,254 (1.9%)
Business Search- 14 Million verified businesses
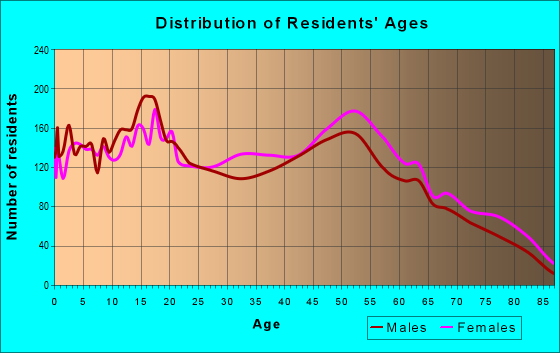
Males: 9,544
(50.1%)
Females: 9,518
(49.9%)
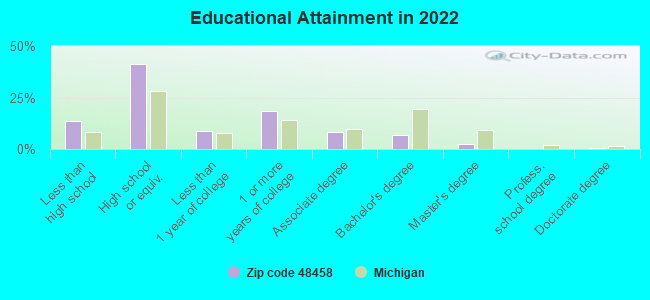
For population 25 years and over in 48458:
High school or higher: 85.2%
Bachelor's degree or higher: 9.5%
Graduate or professional degree: 2.8%
Unemployed: 10.2%
Mean travel time to work (commute): 27.2 minutes
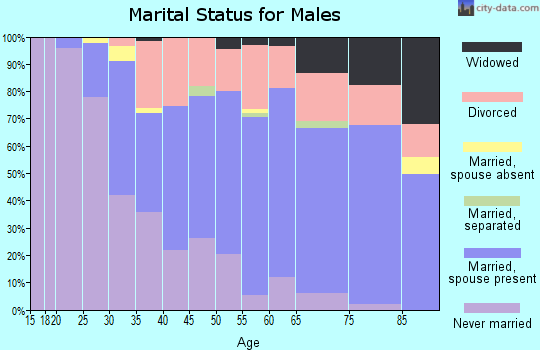
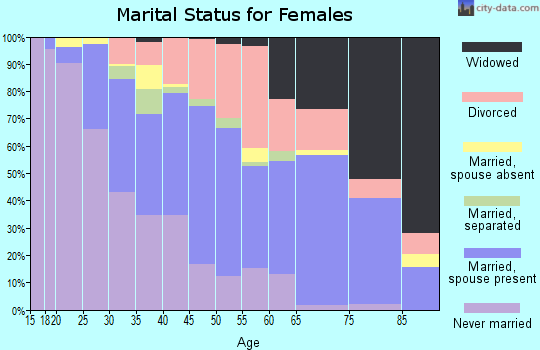
For population 15 years and over in 48458:
Never married: 36.3%
Now married: 40.4%
Separated: 2.4%
Widowed: 5.2%
Divorced: 15.6%
Zip code 48458 compared to state average:
Median household income below state average.
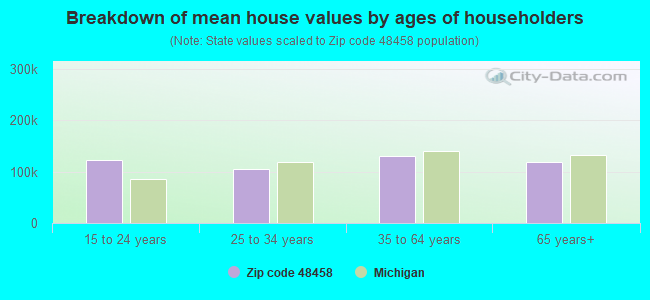
Median house value significantly below state average.
Unemployed percentage above state average.
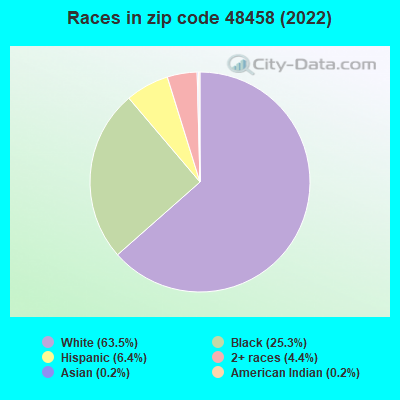
Black race population percentage above state average.
Foreign-born population percentage significantly below state average.
Length of stay since moving in significantly above state average.
Percentage of population with a bachelor's degree or higher significantly below state average.
Estimated median house/condo value in 2022: $92,282
48458:
$92,282
Michigan:
$224,400
According to our research of Michigan and other state lists, there were 74 registered sex offenders living in 48458 zip code as of April 27, 2024. The ratio of all residents to sex offenders in zip code 48458 is 269 to 1. The ratio of registered sex offenders to all residents in this zip code is near the state average.
Median resident age:
This zip code:
39.6 years
Michigan median age:
40.3 years
Average household size:
This zip code:
2.3 people
Michigan:
2.4 people
Averages for the 2020 tax year for zip code 48458, filed in 2021:
Average Adjusted Gross Income (AGI) in 2020: $34,930 (Individual Income Tax Returns)
Here:
$34,930
State:
$68,945
Salary/wage: $31,272 (reported on 75.0% of returns)
Here:
$31,272
State:
$57,142
(% of AGI for various income ranges: 888.8% for AGIs below $25k, 2939.0% for AGIs $25k-50k, 6014.5% for AGIs $50k-75k, 8623.6% for AGIs $75k-100k, 13360.0% for AGIs $100k-200k)
Taxable interest for individuals: $501 (reported on 18.1% of returns)
This zip code:
$501
Michigan:
$1,630
(% of AGI for various income ranges: 5.9% for AGIs below $25k, 9.4% for AGIs $25k-50k, 19.0% for AGIs $50k-75k, 22.1% for AGIs $75k-100k, 71.1% for AGIs $100k-200k)
Ordinary dividends: $1,594 (reported on 6.0% of returns)
Here:
$1,594
State:
$6,972
(% of AGI for various income ranges: 4.9% for AGIs below $25k, 10.8% for AGIs $25k-50k, 13.9% for AGIs $50k-75k, 38.2% for AGIs $75k-100k, 81.9% for AGIs $100k-200k)
Net capital gain/loss in AGI: +$2,586 (reported on 5.5% of returns)
Here:
+$2,586
State:
+$20,064
(% of AGI for various income ranges: 6.5% for AGIs $25k-50k, 16.8% for AGIs $50k-75k, 98.2% for AGIs $75k-100k, 275.6% for AGIs $100k-200k)
Profit/loss from business: +$3,920 (reported on 13.6% of returns)
Here:
+$3,920
State:
+$11,172
(% of AGI for various income ranges: 72.8% for AGIs below $25k, 54.0% for AGIs $25k-50k, 36.9% for AGIs $50k-75k, 73.3% for AGIs $75k-100k, 256.3% for AGIs $100k-200k)
Taxable individual retirement arrangement distribution: $10,677 (reported on 4.8% of returns)
48458:
$10,677
Michigan:
$19,803
(% of AGI for various income ranges: 21.6% for AGIs below $25k, 47.1% for AGIs $25k-50k, 118.6% for AGIs $50k-75k, 249.1% for AGIs $75k-100k, 394.4% for AGIs $100k-200k)
Total itemized deductions: $26,875 (reported on 1.8% of returns)
Here:
$26,875
State:
$34,117
(% of AGI for various income ranges: 16.4% for AGIs below $25k, 37.9% for AGIs $25k-50k, 106.0% for AGIs $50k-75k, 252.1% for AGIs $75k-100k, 460.0% for AGIs $100k-200k)
Charity contributions: $8,617 (reported on 1.3% of returns)
Here:
$8,617
State:
$13,548
(% of AGI for various income ranges: 9.5% for AGIs $25k-50k, 27.8% for AGIs $50k-75k, 50.0% for AGIs $75k-100k, 161.1% for AGIs $100k-200k)
Taxes paid: $6,044 (reported on 1.8% of returns)
48458:
$6,044
State:
$7,972
(% of AGI for various income ranges: 2.1% for AGIs below $25k, 4.6% for AGIs $25k-50k, 25.6% for AGIs $50k-75k, 82.1% for AGIs $75k-100k, 120.0% for AGIs $100k-200k)
Earned income credit: $2,477 (reported on 27.2% of returns)
Here:
$2,477
State:
$2,251
(% of AGI for various income ranges: 118.6% for AGIs below $25k, 96.7% for AGIs $25k-50k, 2.3% for AGIs $50k-75k)
Percentage of individuals using paid preparers for their 2020 taxes: 94.9%
Here:
95%
State:
93%
(% for various income ranges: 94.9% for AGIs below $25k, 95.4% for AGIs $25k-50k, 94.2% for AGIs $50k-75k, 95.7% for AGIs $75k-100k, 92.3% for AGIs $100k-200k, 100.0% for AGIs over 200k)
Averages for the 2012 tax year for zip code 48458, filed in 2013:
Average Adjusted Gross Income (AGI) in 2012: $29,564 (Individual Income Tax Returns)
Here:
$29,564
State:
$55,609
Salary/wage: $24,368 (reported on 81.7% of returns)
Here:
$24,368
State:
$46,782
(% of AGI for various income ranges: 60.5% for AGIs below $25k, 66.0% for AGIs $25k-50k, 68.2% for AGIs $50k-75k, 75.7% for AGIs $75k-100k, 72.4% for AGIs $100k-200k)
Taxable interest for individuals: $643 (reported on 19.5% of returns)
This zip code:
$643
Michigan:
$1,491
(% of AGI for various income ranges: 0.5% for AGIs below $25k, 0.4% for AGIs $25k-50k, 0.3% for AGIs $50k-75k, 0.4% for AGIs $75k-100k, 0.5% for AGIs $100k-200k)
Ordinary dividends: $1,423 (reported on 7.8% of returns)
Here:
$1,423
State:
$6,225
(% of AGI for various income ranges: 0.4% for AGIs below $25k, 0.4% for AGIs $25k-50k, 0.3% for AGIs $50k-75k, 0.2% for AGIs $75k-100k, 0.4% for AGIs $100k-200k)
Profit/loss from business: +$6,709 (reported on 14.4% of returns)
Here:
+$6,709
State:
+$11,523
(% of AGI for various income ranges: 9.9% for AGIs below $25k, 1.1% for AGIs $25k-50k, 1.4% for AGIs $50k-75k, 0.7% for AGIs $75k-100k, 1.6% for AGIs $100k-200k)
Taxable individual retirement arrangement distribution: $9,092 (reported on 5.8% of returns)
48458:
$9,092
Michigan:
$15,298
(% of AGI for various income ranges: 1.3% for AGIs below $25k, 1.8% for AGIs $25k-50k, 2.1% for AGIs $50k-75k, 1.5% for AGIs $75k-100k, 2.2% for AGIs $100k-200k)
Total itemized deductions: $16,376 (26% of AGI, reported on 13.9% of returns)
Here:
$16,376
State:
$21,628
Here:
25.9% of AGI
State:
18.4% of AGI
(% of AGI for various income ranges: 3.8% for AGIs below $25k, 7.6% for AGIs $25k-50k, 8.2% for AGIs $50k-75k, 10.0% for AGIs $75k-100k, 11.7% for AGIs $100k-200k)
Charity contributions: $3,493 (reported on 10.7% of returns)
Here:
$3,493
State:
$4,225
(% of AGI for various income ranges: 0.5% for AGIs below $25k, 1.1% for AGIs $25k-50k, 1.2% for AGIs $50k-75k, 1.9% for AGIs $75k-100k, 2.3% for AGIs $100k-200k)
Taxes paid: $4,511 (reported on 13.8% of returns)
48458:
$4,511
State:
$8,327
(% of AGI for various income ranges: 0.6% for AGIs below $25k, 1.6% for AGIs $25k-50k, 2.1% for AGIs $50k-75k, 3.2% for AGIs $75k-100k, 4.6% for AGIs $100k-200k)
Earned income credit: $2,555 (reported on 31.5% of returns)
Here:
$2,555
State:
$2,306
(% of AGI for various income ranges: 9.8% for AGIs below $25k, 1.4% for AGIs $25k-50k)
Percentage of individuals using paid preparers for their 2012 taxes: 61.0%
Here:
61%
State:
57%
(% for various income ranges: 58.7% for AGIs below $25k, 61.9% for AGIs $25k-50k, 68.2% for AGIs $50k-75k, 67.5% for AGIs $75k-100k, 65.5% for AGIs $100k-200k)
Averages for the 2004 tax year for zip code 48458, filed in 2005:
Average Adjusted Gross Income (AGI) in 2004: $30,743 (Individual Income Tax Returns)
Here:
$30,743
State:
$48,204
Salary/wage: $27,609 (reported on 87.1% of returns)
Here:
$27,609
State:
$42,791
(% of AGI for various income ranges: 76.9% for AGIs below $10k, 65.9% for AGIs $10k-25k, 75.0% for AGIs $25k-50k, 84.1% for AGIs $50k-75k, 86.3% for AGIs $75k-100k, 81.8% for AGIs over 100k)
Taxable interest for individuals: $1,029 (reported on 31.9% of returns)
This zip code:
$1,029
Michigan:
$1,725
(% of AGI for various income ranges: 2.2% for AGIs below $10k, 1.5% for AGIs $10k-25k, 0.8% for AGIs $25k-50k, 0.8% for AGIs $50k-75k, 0.8% for AGIs $75k-100k, 1.7% for AGIs over 100k)
Taxable dividends: $942 (reported on 13.1% of returns)
Here:
$942
State:
$3,420
(% of AGI for various income ranges: 1.0% for AGIs below $10k, 0.6% for AGIs $10k-25k, 0.3% for AGIs $25k-50k, 0.3% for AGIs $50k-75k, 0.2% for AGIs $75k-100k, 0.6% for AGIs over 100k)
Net capital gain/loss: +$742 (reported on 8.0% of returns)
Here:
+$742
State:
+$8,532
(% of AGI for various income ranges: -0.9% for AGIs below $10k, -0.1% for AGIs $10k-25k, -0.0% for AGIs $25k-50k, 0.1% for AGIs $50k-75k, 0.3% for AGIs $75k-100k, 1.2% for AGIs over 100k)
Profit/loss from business: +$3,961 (reported on 12.8% of returns)
Here:
+$3,961
State:
+$9,547
(% of AGI for various income ranges: 9.6% for AGIs below $10k, 4.2% for AGIs $10k-25k, 1.3% for AGIs $25k-50k, 0.5% for AGIs $50k-75k, 0.5% for AGIs $75k-100k, 0.3% for AGIs over 100k)
IRA payment deduction: $1,919 (reported on 0.8% of returns)
48458:
$1,919
Michigan:
$2,875
(% of AGI for various income ranges: 0.1% for AGIs $10k-25k, 0.1% for AGIs $25k-50k, 0.0% for AGIs $50k-75k, 0.1% for AGIs $75k-100k)
Total itemized deductions: $13,865 (23% of AGI, reported on 22.4% of returns)
Here:
$13,865
State:
$18,509
Here:
23.0% of AGI
State:
20.7% of AGI
(% of AGI for various income ranges: 4.5% for AGIs below $10k, 5.5% for AGIs $10k-25k, 9.2% for AGIs $25k-50k, 11.8% for AGIs $50k-75k, 12.2% for AGIs $75k-100k, 14.2% for AGIs over 100k)
Charity contributions deductions: $2,777 (4% of AGI, reported on 19.7% of returns)
Here:
$2,777
State:
$3,365
Here:
4.5% of AGI
State:
3.6% of AGI
(% of AGI for various income ranges: 0.5% for AGIs below $10k, 0.8% for AGIs $10k-25k, 1.4% for AGIs $25k-50k, 1.9% for AGIs $50k-75k, 2.2% for AGIs $75k-100k, 3.6% for AGIs over 100k)
Total tax: $3,660 (reported on 68.3% of returns)
48458:
$3,660
State:
$7,691
(% of AGI for various income ranges: 2.6% for AGIs below $10k, 3.3% for AGIs $10k-25k, 6.2% for AGIs $25k-50k, 8.9% for AGIs $50k-75k, 11.4% for AGIs $75k-100k, 14.8% for AGIs over 100k)
Earned income credit: $1,866 (reported on 26.3% of returns)
Here:
$1,866
State:
$1,737
Percentage of individuals using paid preparers for their 2004 taxes: 67.1%
Here:
67%
State:
60%
(% for various income ranges: 61.9% for AGIs below $10k, 68.1% for AGIs $10k-25k, 67.3% for AGIs $25k-50k, 70.4% for AGIs $50k-75k, 70.4% for AGIs $75k-100k, 76.8% for AGIs over 100k)
Likely homosexual households (counted as self-reported same-sex unmarried-partner households)
Lesbian couples: 0.5% of all households
Gay men: 0.0% of all households
Household received Food Stamps/SNAP in the past 12 months: 2,241 Household did not receive Food Stamps/SNAP in the past 12 months: 5,981
Women who had a birth in the past 12 months: 341 (122 now married, 210 unmarried) Women who did not have a birth in the past 12 months: 4,345 (1,411 now married, 2,941 unmarried)
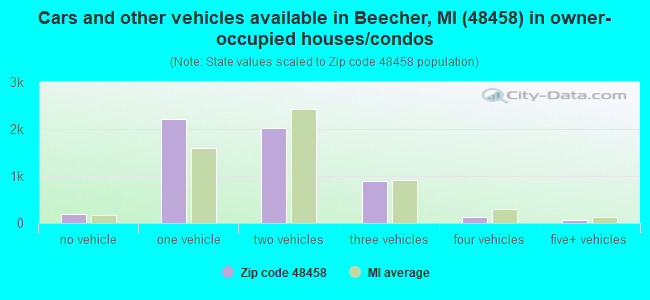
Housing units in zip code 48458 with a mortgage: 2,721 (141 second mortgage, 103 both second mortgage and home equity loan) Houses without a mortgage: 377
Median monthly owner costs for units with a mortgage: $1,044 Median monthly owner costs for units without a mortgage: $494
Residents with income below the poverty level in 2022:
This zip code:
20.6%
Whole state:
13.4%
Residents with income below 50% of the poverty level in 2022:
This zip code:
11.1%
Whole state:
6.9%
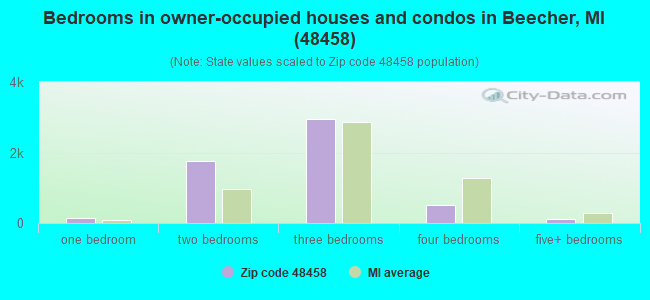
Median number of rooms in houses and condos:
Here:
5.6
State:
6.5
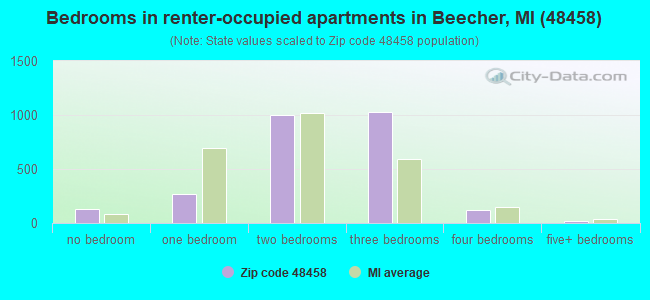
Median number of rooms in apartments:
Here:
4.5
State:
4.3
Notable locations in this zip code not listed on our city pages
Notable locations in zip code 48458: Beechwood Greens Golf Club (A), Genesee County Fairgrounds (B), Mount Morris Station (C), Mount Morris Library (D), Mount Morris Police Department (E), Mount Morris Township Fire Station 1 Central (F), Mount Morris City Fire Department (G). Display/hide their locations on the map
Churches in zip code 48458 include: Mount Morris Free Methodist Church (A), Korean Presbyterian Church (B), North End Baptist Church (C), Cross Missionary Baptist Church (D), Mount Morris United Brethren Church (E), Eagles Nest Church (F), Mount Morris Community Church (G), Colonial Hills Baptist Church (H), Calvary Temple Full Gospel Church (I). Display/hide their locations on the map
Cemeteries: Calvary Cemetery (1), Flint Memorial Park (2), Mount Morris Cemetery (3), Bethel Cemetery (4), Genesee Township Cemetery (5), Oakwood Cemetery (6). Display/hide their locations on the map
In group quarters: 56 (-1 institutionalized population)
Size of family households: 2,278 2-persons, 1,260 3-persons, 868 4-persons, 304 5-persons, 111 6-persons, 30 7-or-more-persons
Size of nonfamily households: 2,456 1-person, 747 2-persons, 82 3-persons
1,609 married couples with children.
1,754 single-parent households (440 men, 1,314 women).
95.5% of residents of 48458 zip code speak English at home.
2.3% of residents speak Spanish at home (50% very well, 20% well, 18% not well, 12% not at all).
0.6% of residents speak other Indo-European language at home (61% very well, 5% well, 34% not well).
0.2% of residents speak Asian or Pacific Island language at home (100% well).
1.2% of residents speak other language at home (8% very well, 44% well, 47% not at all).
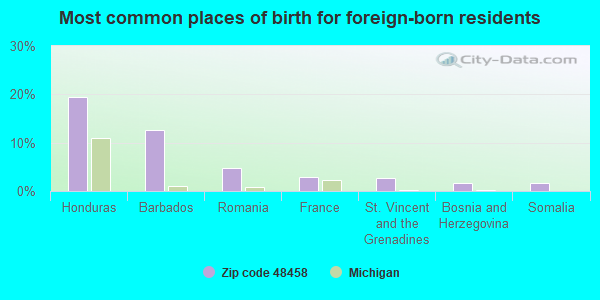
Foreign born population: 577 (3.0%) (59.1% of them are naturalized citizens)
This zip code:
3.0%
Whole state:
6.9%
19%Honduras
13%Barbados
5%Romania
3%France
3%St. Vincent and the Grenadines
2%Bosnia and Herzegovina
2%Somalia
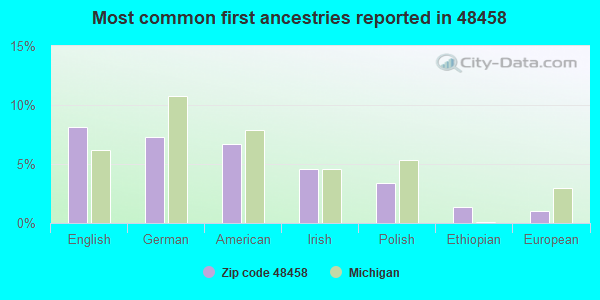
8%English
7%German
7%American
5%Irish
3%Polish
1%Ethiopian
1%European
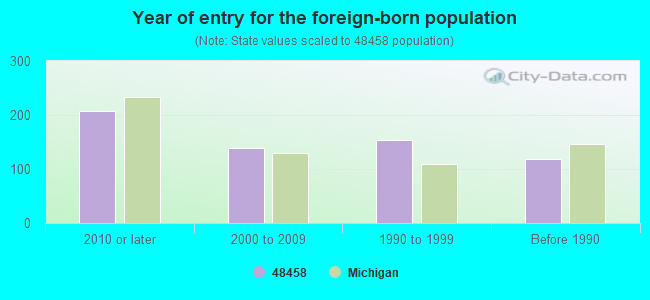
Year of entry for the foreign-born population
2082010 or later
1392000 to 2009
1541990 to 1999
118Before 1990
Major facilities with environmental interests located in this zip code:
DOLAN MIDDLE SCHOOL (6255 NEFF ROAD in MT. MORRIS, MI)
(National Center for Education Statistics) - STATE ID-05687 Organizations: BEECHER COMMUNITY SCHOOL DISTRICT (SCHOOL DISTRICT)
E.A. JOHNSON MEMORIAL H.S. (8041 NEFF ROAD in MT. MORRIS, MI)
(National Center for Education Statistics) - STATE ID-05763 Organizations: MT. MORRIS CONSOLIDATED SCHOOLS (SCHOOL DISTRICT)
AMOCO OIL CO (G6519 N SAGINAW in MOUNT MORRIS, MI)
(Resource Conservation and Recovery Act (tracking hazardous waste)) Organizations: CREST PETROLEUM (CONTACT/OPERATOR)
, PHIL FLINT OIL CO (CONTACT/OPERATOR)
Alternative names: AMOCO OIL CO STANLEY RD STATION
BALDWIN MANAGEMENT CORP (11615 N SAGINAW in MOUNT MORRIS, MI)
(Resource Conservation and Recovery Act (tracking hazardous waste)) Business NAICS classification: CAR WASHES. Organizations: DON BALDWIN (CONTACT/OPERATOR)
Alternative names: BALDWINS CAR WASH INC
MI DEPT/TRANSPORTATION BRIDGE (I 75 MT MORRIS RD BRIDGE in MOUNT MORRIS, MI)
(Resource Conservation and Recovery Act (tracking hazardous waste)) Organizations: MICH DEPT OF TRANSPORTATION (CONTACT/OPERATOR)
Alternative names: MIDOT BRIDGE I-75 AND MT MORRIS RD
Housing units lacking complete plumbing facilities: 4.7% Housing units lacking complete kitchen facilities: 4.7%
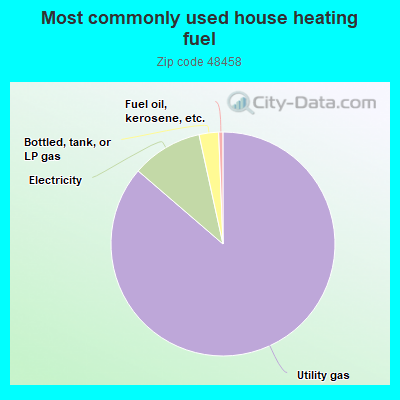
85.8%Utility gas
10.2%Electricity
2.8%Bottled, tank, or LP gas
0.6%Fuel oil, kerosene, etc.
Population in 1990: 27,347.
Place of birth for U.S.-born residents:
This state: 15,683
Northeast: 232
Midwest: 540
South: 1,401
West: 559
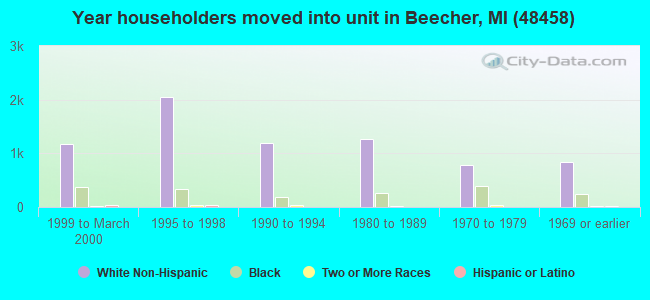
58% of the 48458 zip code residents lived in the same house 5 years ago. Out of people who lived in different houses, 81% lived in this county. Out of people who lived in different counties, 50% lived in Michigan.
92% of the 48458 zip code residents lived in the same house 1 year ago. Out of people who lived in different houses, 78% moved from this county. Out of people who lived in different houses, 16% moved from different county within same state. Out of people who lived in different houses, 4% moved from different state.
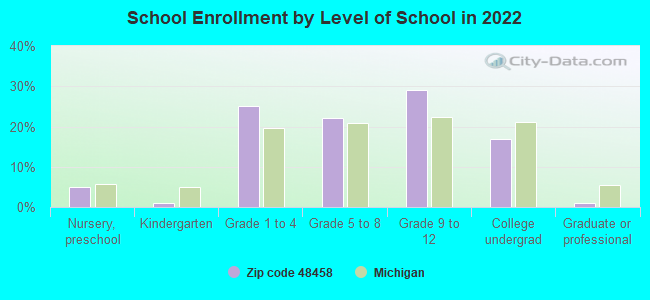
Private vs. public school enrollment:
Students in private schools in grades 1 to 8 (elementary and middle school): 82
Here:
4.7%
Michigan:
12.4%
Students in private schools in grades 9 to 12 (high school): 61
Here:
5.6%
Michigan:
9.8%
Students in private undergraduate colleges: 45
Here:
7.1%
Michigan:
14.9%
Occupation by median earnings in the past 12 months ($)
105,820Community and social service occupations
79,329Health diagnosing and treating practitioners and other technical occupations
45,811Construction and extraction occupations
44,472Installation, maintenance, and repair occupations
44,157Management occupations
42,854Transportation occupations
Companies with federal contracts located in this zip code:
WOLVERINE FIRE PROTECTION CO (8067 DORT HWY in MOUNT MORRIS, MI) : $22,108,351 in 86 contractsfrom 1999 to 2006
Contracts for Maintenance, Repair or Alteration of Real Property -- Other Non-Building Facilities, Construction of Structures and Facilities -- Miscellaneous Buildings, Maintenance, Repair or Alteration of Real Property -- Office Buildings, Well Drilling/Exploratory Services, and moreby Navy, Public Buildings Service, Air Force, Army, and others Signed by year:2000: $854,493; 2001: $4,861,848; 2002: $2,459,514; 2003: $2,863,300; 2004: $8,216,901; 2005: $2,519,443; 2006: $314,852.
Biggest contracts:
$2,991,977 with Navy for Maintenance, Repair or Alteration of Real Property -- Other Non-Building Facilities. Taking place in TX. Signed on 2001-12-19. Completion date: 2002-12-18.
$2,475,638 with Navy for Construction of Structures and Facilities -- Miscellaneous Buildings. Taking place in TX. Signed on 2004-09-30. Completion date: 2005-11-25.
$2,099,776 with Navy for Maintenance, Repair or Alteration of Real Property -- Other Non-Building Facilities. Taking place in MS. Signed on 2004-09-20. Completion date: 2005-10-26.
$1,363,892 with Public Buildings Service for Maintenance, Repair or Alteration of Real Property -- Office Buildings. Taking place in IN. Signed on 2003-04-15. Completion date: 2003-11-15.
Top industries in this zip code by the number of employees in 2005:
2002 - 2018 National Fire Incident Reporting System (NFIRS) incidents
Based on the data from the years 2002 - 2018 the average number of fire incidents per year is 84. The highest number of fires - 171 took place in 2003, and the least - 34 in 2013. The data has a dropping trend.
When looking into fire subcategories, the most reports belonged to: Structure Fires (61.7%), and Outside Fires (17.3%).
Fire incident types reported to NFIRS in Zip Code 48458
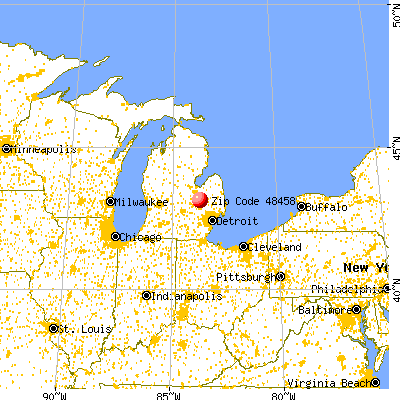


 Nearest zip codes: 48505, 48420, 48437, 48506, 48504, 48502.


 Based on the data from the years 2002 - 2018 the average number of fire incidents per year is 84. The highest number of fires - 171 took place in 2003, and the least - 34 in 2013. The data has a dropping trend.
 When looking into fire subcategories, the most reports belonged to: Structure Fires (61.7%), and Outside Fires (17.3%).