Estimated zip code population in 2022: 22,532 Zip code population in 2010: 22,507 Zip code population in 2000: 19,655
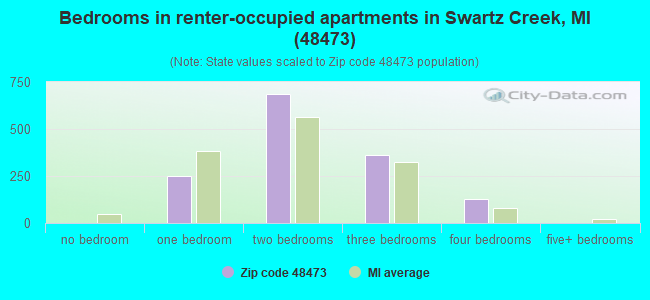
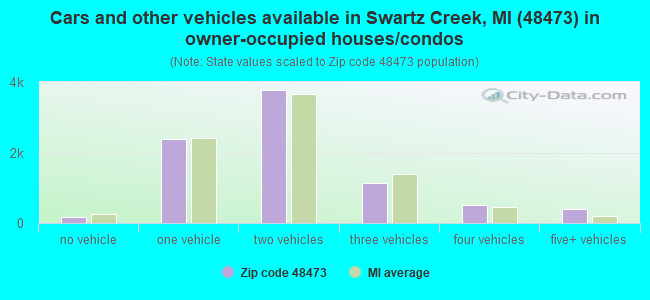
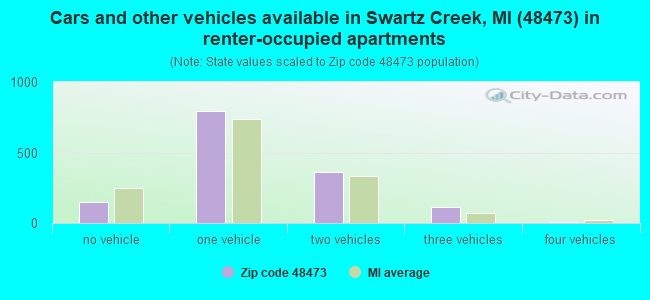
Houses and condos: 10,039 Renter-occupied apartments: 1,419
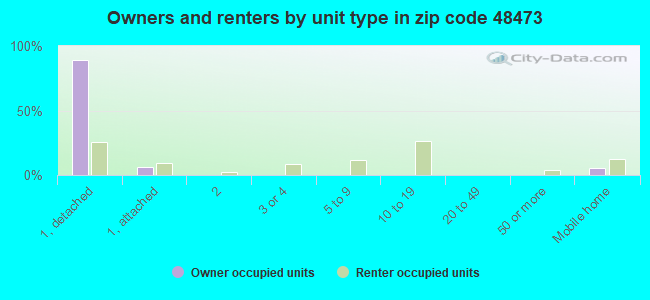
% of renters here:
15%
State:
27%
March 2022 cost of living index in zip code 48473: 81.2 (low, U.S. average is 100)
Land area: 59.0 sq. mi. Water area: 0.1 sq. mi.
Population density: 382 people per square mile
(very low).
OSM Map
General Map
Google Map
MSN Map
OSM Map
General Map
Google Map
MSN Map
OSM Map
General Map
Google Map
MSN Map
OSM Map
General Map
Google Map
MSN Map
Please wait while loading the map...
Real estate property taxes paid for housing units in 2022:
This zip code:
1.3% ($2,557)
Michigan:
1.2% ($2,746)
Median real estate property taxes paid for housing units with mortgages in 2022: $2,737 (1.3%) Median real estate property taxes paid for housing units with no mortgage in 2022: $2,313 (1.2%)
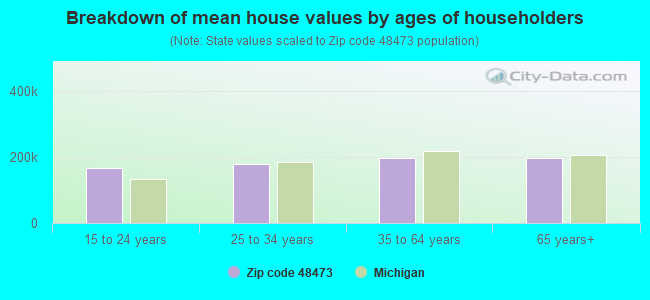
Estimated median house/condo value in 2022: $200,074
48473:
$200,074
Michigan:
$224,400
According to our research of Michigan and other state lists, there were 37 registered sex offenders living in 48473 zip code as of April 27, 2024. The ratio of all residents to sex offenders in zip code 48473 is 593 to 1. The ratio of registered sex offenders to all residents in this zip code is lower than the state average.
Median resident age:
This zip code:
46.5 years
Michigan median age:
40.3 years
Average household size:
This zip code:
2.3 people
Michigan:
2.4 people
Averages for the 2020 tax year for zip code 48473, filed in 2021:
Average Adjusted Gross Income (AGI) in 2020: $58,218 (Individual Income Tax Returns)
Here:
$58,218
State:
$68,945
Salary/wage: $53,170 (reported on 72.9% of returns)
Here:
$53,170
State:
$57,142
(% of AGI for various income ranges: 834.9% for AGIs below $25k, 2713.5% for AGIs $25k-50k, 5599.9% for AGIs $50k-75k, 8571.5% for AGIs $75k-100k, 15246.4% for AGIs $100k-200k, 53007.8% for AGIs over 200k)
Taxable interest for individuals: $888 (reported on 33.7% of returns)
This zip code:
$888
Michigan:
$1,630
(% of AGI for various income ranges: 16.1% for AGIs below $25k, 29.6% for AGIs $25k-50k, 45.8% for AGIs $50k-75k, 51.0% for AGIs $75k-100k, 80.4% for AGIs $100k-200k, 473.3% for AGIs over 200k)
Ordinary dividends: $3,381 (reported on 18.0% of returns)
Here:
$3,381
State:
$6,972
(% of AGI for various income ranges: 24.1% for AGIs below $25k, 39.3% for AGIs $25k-50k, 84.8% for AGIs $50k-75k, 120.3% for AGIs $75k-100k, 211.1% for AGIs $100k-200k, 1145.6% for AGIs over 200k)
Net capital gain/loss in AGI: +$7,005 (reported on 16.4% of returns)
Here:
+$7,005
State:
+$20,064
(% of AGI for various income ranges: 5.9% for AGIs below $25k, 21.1% for AGIs $25k-50k, 50.1% for AGIs $50k-75k, 120.7% for AGIs $75k-100k, 397.0% for AGIs $100k-200k, 7496.7% for AGIs over 200k)
Profit/loss from business: +$8,690 (reported on 13.2% of returns)
Here:
+$8,690
State:
+$11,172
(% of AGI for various income ranges: 56.7% for AGIs below $25k, 103.7% for AGIs $25k-50k, 114.5% for AGIs $50k-75k, 255.7% for AGIs $75k-100k, 257.4% for AGIs $100k-200k, 3174.4% for AGIs over 200k)
Taxable individual retirement arrangement distribution: $14,474 (reported on 11.8% of returns)
48473:
$14,474
Michigan:
$19,803
(% of AGI for various income ranges: 54.3% for AGIs below $25k, 124.4% for AGIs $25k-50k, 249.4% for AGIs $50k-75k, 388.6% for AGIs $75k-100k, 673.0% for AGIs $100k-200k, 1600.0% for AGIs over 200k)
Total itemized deductions: $27,157 (reported on 4.2% of returns)
Here:
$27,157
State:
$34,117
(% of AGI for various income ranges: 30.0% for AGIs below $25k, 54.9% for AGIs $25k-50k, 161.1% for AGIs $50k-75k, 219.9% for AGIs $75k-100k, 380.0% for AGIs $100k-200k, 3141.1% for AGIs over 200k)
Charity contributions: $9,141 (reported on 3.3% of returns)
Here:
$9,141
State:
$13,548
(% of AGI for various income ranges: 1.6% for AGIs below $25k, 11.4% for AGIs $25k-50k, 36.1% for AGIs $50k-75k, 55.4% for AGIs $75k-100k, 109.4% for AGIs $100k-200k, 1170.0% for AGIs over 200k)
Taxes paid: $6,994 (reported on 4.2% of returns)
48473:
$6,994
State:
$7,972
(% of AGI for various income ranges: 3.7% for AGIs below $25k, 8.0% for AGIs $25k-50k, 42.4% for AGIs $50k-75k, 69.0% for AGIs $75k-100k, 115.7% for AGIs $100k-200k, 724.4% for AGIs over 200k)
Earned income credit: $2,003 (reported on 10.9% of returns)
Here:
$2,003
State:
$2,251
(% of AGI for various income ranges: 52.5% for AGIs below $25k, 50.9% for AGIs $25k-50k, 1.2% for AGIs $50k-75k)
Percentage of individuals using paid preparers for their 2020 taxes: 94.0%
Here:
94%
State:
93%
(% for various income ranges: 92.8% for AGIs below $25k, 94.6% for AGIs $25k-50k, 94.4% for AGIs $50k-75k, 94.5% for AGIs $75k-100k, 94.2% for AGIs $100k-200k, 95.7% for AGIs over 200k)
Averages for the 2012 tax year for zip code 48473, filed in 2013:
Average Adjusted Gross Income (AGI) in 2012: $51,167 (Individual Income Tax Returns)
Here:
$51,167
State:
$55,609
Salary/wage: $42,234 (reported on 82.6% of returns)
Here:
$42,234
State:
$46,782
(% of AGI for various income ranges: 58.2% for AGIs below $25k, 58.7% for AGIs $25k-50k, 66.1% for AGIs $50k-75k, 73.5% for AGIs $75k-100k, 78.2% for AGIs $100k-200k, 55.6% for AGIs over 200k)
Taxable interest for individuals: $1,030 (reported on 35.7% of returns)
This zip code:
$1,030
Michigan:
$1,491
(% of AGI for various income ranges: 1.2% for AGIs below $25k, 0.9% for AGIs $25k-50k, 0.8% for AGIs $50k-75k, 0.4% for AGIs $75k-100k, 0.4% for AGIs $100k-200k, 1.5% for AGIs over 200k)
Ordinary dividends: $2,629 (reported on 20.1% of returns)
Here:
$2,629
State:
$6,225
(% of AGI for various income ranges: 1.3% for AGIs below $25k, 1.0% for AGIs $25k-50k, 0.9% for AGIs $50k-75k, 1.1% for AGIs $75k-100k, 0.7% for AGIs $100k-200k, 1.9% for AGIs over 200k)
Net capital gain/loss in AGI: +$1,622 (reported on 16.1% of returns)
Here:
+$1,622
State:
+$9,326
(% of AGI for various income ranges: 0.2% for AGIs $75k-100k, 0.6% for AGIs $100k-200k, 4.3% for AGIs over 200k)
Profit/loss from business: +$8,711 (reported on 13.4% of returns)
Here:
+$8,711
State:
+$11,523
(% of AGI for various income ranges: 6.0% for AGIs below $25k, 2.7% for AGIs $25k-50k, 1.3% for AGIs $50k-75k, 1.0% for AGIs $75k-100k, 2.0% for AGIs $100k-200k, 3.8% for AGIs over 200k)
Taxable individual retirement arrangement distribution: $12,338 (reported on 12.9% of returns)
48473:
$12,338
Michigan:
$15,298
(% of AGI for various income ranges: 3.0% for AGIs below $25k, 3.0% for AGIs $25k-50k, 3.2% for AGIs $50k-75k, 3.2% for AGIs $75k-100k, 4.0% for AGIs $100k-200k)
Self-employment retirement plans: $16,600 (reported on 0.2% of returns)
48473:
$16,600
Michigan:
$20,834
Total itemized deductions: $17,851 (20% of AGI, reported on 30.4% of returns)
Here:
$17,851
State:
$21,628
Here:
20.0% of AGI
State:
18.4% of AGI
(% of AGI for various income ranges: 7.7% for AGIs below $25k, 8.9% for AGIs $25k-50k, 10.2% for AGIs $50k-75k, 11.3% for AGIs $75k-100k, 12.5% for AGIs $100k-200k, 9.7% for AGIs over 200k)
Charity contributions: $3,118 (reported on 25.3% of returns)
Here:
$3,118
State:
$4,225
(% of AGI for various income ranges: 0.9% for AGIs below $25k, 1.2% for AGIs $25k-50k, 1.3% for AGIs $50k-75k, 1.6% for AGIs $75k-100k, 1.8% for AGIs $100k-200k, 2.4% for AGIs over 200k)
Taxes paid: $6,080 (reported on 30.4% of returns)
48473:
$6,080
State:
$8,327
(% of AGI for various income ranges: 1.6% for AGIs below $25k, 2.2% for AGIs $25k-50k, 3.0% for AGIs $50k-75k, 3.8% for AGIs $75k-100k, 4.9% for AGIs $100k-200k, 5.1% for AGIs over 200k)
Earned income credit: $2,063 (reported on 13.7% of returns)
Here:
$2,063
State:
$2,306
(% of AGI for various income ranges: 4.8% for AGIs below $25k, 0.8% for AGIs $25k-50k)
Percentage of individuals using paid preparers for their 2012 taxes: 60.5%
Here:
60%
State:
57%
(% for various income ranges: 55.1% for AGIs below $25k, 59.7% for AGIs $25k-50k, 65.6% for AGIs $50k-75k, 65.0% for AGIs $75k-100k, 66.1% for AGIs $100k-200k, 81.8% for AGIs over 200k)
Averages for the 2004 tax year for zip code 48473, filed in 2005:
Average Adjusted Gross Income (AGI) in 2004: $48,298 (Individual Income Tax Returns)
Here:
$48,298
State:
$48,204
Salary/wage: $42,410 (reported on 86.7% of returns)
Here:
$42,410
State:
$42,791
(% of AGI for various income ranges: 93.6% for AGIs below $10k, 56.9% for AGIs $10k-25k, 64.2% for AGIs $25k-50k, 78.8% for AGIs $50k-75k, 85.7% for AGIs $75k-100k, 78.1% for AGIs over 100k)
Taxable interest for individuals: $1,339 (reported on 54.1% of returns)
This zip code:
$1,339
Michigan:
$1,725
(% of AGI for various income ranges: 5.6% for AGIs below $10k, 3.3% for AGIs $10k-25k, 2.3% for AGIs $25k-50k, 1.2% for AGIs $50k-75k, 0.7% for AGIs $75k-100k, 1.2% for AGIs over 100k)
Taxable dividends: $1,600 (reported on 28.5% of returns)
Here:
$1,600
State:
$3,420
(% of AGI for various income ranges: 3.4% for AGIs below $10k, 1.4% for AGIs $10k-25k, 1.4% for AGIs $25k-50k, 0.8% for AGIs $50k-75k, 0.6% for AGIs $75k-100k, 0.9% for AGIs over 100k)
Net capital gain/loss: +$3,594 (reported on 20.1% of returns)
Here:
+$3,594
State:
+$8,532
(% of AGI for various income ranges: -1.5% for AGIs below $10k, -0.2% for AGIs $10k-25k, 0.4% for AGIs $25k-50k, 0.6% for AGIs $50k-75k, 0.6% for AGIs $75k-100k, 3.9% for AGIs over 100k)
Profit/loss from business: +$7,556 (reported on 13.9% of returns)
Here:
+$7,556
State:
+$9,547
(% of AGI for various income ranges: 1.8% for AGIs below $10k, 3.7% for AGIs $10k-25k, 2.5% for AGIs $25k-50k, 1.4% for AGIs $50k-75k, 1.4% for AGIs $75k-100k, 2.7% for AGIs over 100k)
IRA payment deduction: $2,782 (reported on 2.0% of returns)
48473:
$2,782
Michigan:
$2,875
(% of AGI for various income ranges: 0.2% for AGIs $10k-25k, 0.2% for AGIs $25k-50k, 0.1% for AGIs $50k-75k, 0.1% for AGIs $75k-100k, 0.1% for AGIs over 100k)
Self-employed pension: $10,862 (reported on 0.3% of returns)
Here:
$10,862
Michigan:
$13,826
Total itemized deductions: $16,129 (21% of AGI, reported on 40.3% of returns)
Here:
$16,129
State:
$18,509
Here:
20.7% of AGI
State:
20.7% of AGI
(% of AGI for various income ranges: 6.5% for AGIs below $10k, 10.3% for AGIs $10k-25k, 11.9% for AGIs $25k-50k, 15.0% for AGIs $50k-75k, 14.6% for AGIs $75k-100k, 13.4% for AGIs over 100k)
Charity contributions deductions: $2,600 (3% of AGI, reported on 36.7% of returns)
Here:
$2,600
State:
$3,365
Here:
3.2% of AGI
State:
3.6% of AGI
(% of AGI for various income ranges: 0.7% for AGIs below $10k, 1.3% for AGIs $10k-25k, 1.7% for AGIs $25k-50k, 2.0% for AGIs $50k-75k, 2.0% for AGIs $75k-100k, 2.3% for AGIs over 100k)
Total tax: $6,161 (reported on 82.0% of returns)
48473:
$6,161
State:
$7,691
(% of AGI for various income ranges: 2.3% for AGIs below $10k, 3.9% for AGIs $10k-25k, 7.0% for AGIs $25k-50k, 8.6% for AGIs $50k-75k, 10.3% for AGIs $75k-100k, 15.7% for AGIs over 100k)
Earned income credit: $1,498 (reported on 9.2% of returns)
Here:
$1,498
State:
$1,737
Percentage of individuals using paid preparers for their 2004 taxes: 64.5%
Here:
65%
State:
60%
(% for various income ranges: 53.2% for AGIs below $10k, 63.6% for AGIs $10k-25k, 66.3% for AGIs $25k-50k, 70.3% for AGIs $50k-75k, 64.6% for AGIs $75k-100k, 70.9% for AGIs over 100k)
Likely homosexual households (counted as self-reported same-sex unmarried-partner households)
Lesbian couples: 0.0% of all households
Gay men: 0.0% of all households
Household received Food Stamps/SNAP in the past 12 months: 972 Household did not receive Food Stamps/SNAP in the past 12 months: 8,734
Women who had a birth in the past 12 months: 261 (192 now married, 70 unmarried) Women who did not have a birth in the past 12 months: 4,245 (1,910 now married, 2,329 unmarried)
Housing units in zip code 48473 with a mortgage: 5,051 (373 second mortgage, 4 home equity loan, 322 both second mortgage and home equity loan) Houses without a mortgage: 468
Median monthly owner costs for units with a mortgage: $1,329 Median monthly owner costs for units without a mortgage: $553
Residents with income below the poverty level in 2022:
This zip code:
5.7%
Whole state:
13.4%
Residents with income below 50% of the poverty level in 2022:
This zip code:
2.9%
Whole state:
6.9%
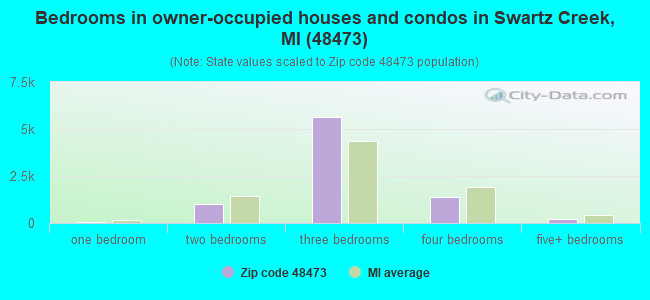
Median number of rooms in houses and condos:
Here:
6.2
State:
6.5
Median number of rooms in apartments:
Here:
4.8
State:
4.3
Notable locations in this zip code not listed on our city pages
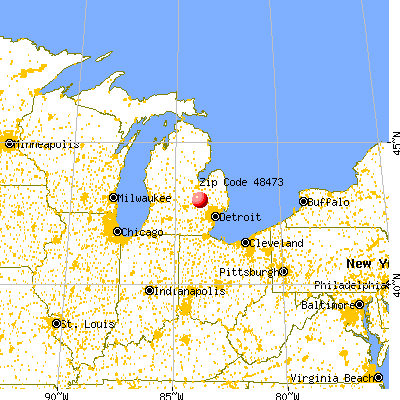
Notable locations in zip code 48473: Duffield Station (A), Otterburn Station (B), Swartz Creek Rest Area (C), Sports Creek Raceway (D), Swartz Creek Station (E), Genesee Valley Meadows Golf Club (F), Swartz Creek Perkins Library (G), Swartz Creek Police Department (H), Swartz Creek Area Fire Department Station 2 (I), Swartz Creek Area Fire Department (J), Mundy Township Fire Department Station 2 (K), Mundy Township Fire Department Station 1 (L). Display/hide their locations on the map
Churches in zip code 48473 include: Saint Bartholomews Church (A), South Mundy Church (B), New Life Wesleyan Church (C), Unity Christian Church (D), Church of the Nazarene (E), Central Assembly of God Church (F), Swartz Creek Church of the Nazarene (G), More Life Tabernacle Church (H), German Church of God (I). Display/hide their locations on the map
Cemeteries: Saint Marys Cemetery (1), Swartz Creek Cemetery (2), Pierce Cemetery (3), Dart Family Cemetery (4), Hill Road Cemetery (5), Chippewa Nation Indian Cemetery (6), Mount Hope Cemetery (7). Display/hide their locations on the map
In group quarters: 70 (-1 institutionalized population)
Size of family households: 3,351 2-persons, 1,233 3-persons, 1,208 4-persons, 283 5-persons, 279 6-persons, 5 7-or-more-persons
Size of nonfamily households: 2,705 1-person, 578 2-persons, 87 3-persons
3,116 married couples with children.
776 single-parent households (320 men, 456 women).
97.6% of residents of 48473 zip code speak English at home.
1.3% of residents speak Spanish at home (83% very well, 17% well).
0.4% of residents speak other Indo-European language at home (72% very well, 28% not well).
0.2% of residents speak Asian or Pacific Island language at home (74% well, 26% not well).
0.4% of residents speak other language at home (60% very well, 18% well, 22% not well).
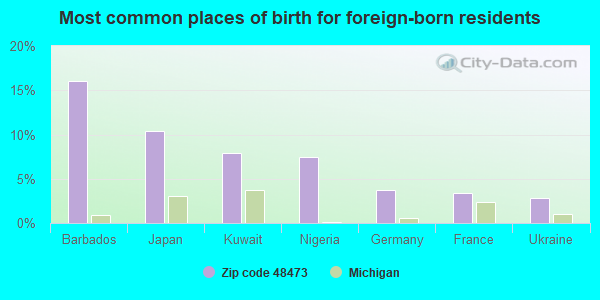
Foreign born population: 576 (2.6%) (91.9% of them are naturalized citizens)
This zip code:
2.6%
Whole state:
6.9%
16%Barbados
10%Japan
8%Kuwait
7%Nigeria
4%Germany
3%France
3%Ukraine
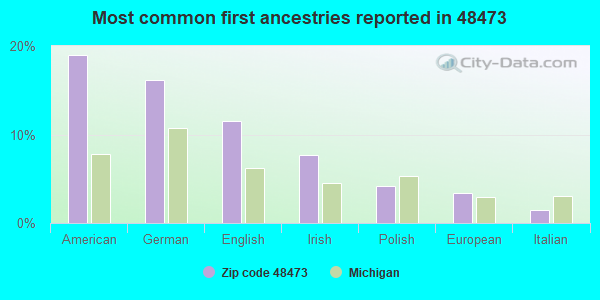
19%American
16%German
11%English
8%Irish
4%Polish
3%European
1%Italian
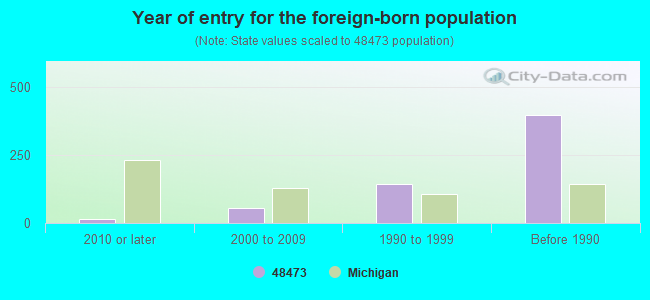
Year of entry for the foreign-born population
132010 or later
562000 to 2009
1431990 to 1999
398Before 1990
Major facilities with environmental interests located in this zip code:
BERLIN AND FARRO LIQUID INCORPORATED (8322 SOUTH MOORISH ROAD in SWARTZ CREEK, MI)
SUPERFUND NPL (Superfund database) (Integrated Compliance Information System) - ICIS-05-1992-0245, FORMAL ENFORCEMENT ACTION, ICIS-05-1982-0043, ICIS-05-1989-0166, ICIS-05-1994-0110, (Resource Conservation and Recovery Act (tracking hazardous waste)) Business NAICS classification: CONSUMER LENDING. Alternative names: BERLIN & FARRO, BERLIN & FARRO LIQUID INC/SUPERFUND, BERLIN & FARRO LIQUID INCINERATOR, MICH TOX SUB CONT COMM BERLIN AND FARRO
ALTERNATIVE HIGH SCHOOL ACADEMY (8197 MILLER ROAD in SWARTZ CREEK, MI)
(National Center for Education Statistics) - STATE ID-07465 Organizations: SWARTZ CREEK COMMUNITY SCHOOLS (SCHOOL DISTRICT)
DIECK ELEMENTARY SCHOOL (2239 VAN VLEET ROAD in SWARTZ CREEK, MI)
(National Center for Education Statistics) - STATE ID-05769 Organizations: SWARTZ CREEK COMMUNITY SCHOOLS (SCHOOL DISTRICT)
ELMS ROAD ELEMENTARY SCHOOL (3259 ELMS ROAD in SWARTZ CREEK, MI)
(National Center for Education Statistics) - STATE ID-05768 Organizations: SWARTZ CREEK COMMUNITY SCHOOLS (SCHOOL DISTRICT)
MI DEPT/TRANSPORTATION BRIDGE (I69 OVER MILLER RD in SWARTZ CREEK, MI)
(Resource Conservation and Recovery Act (tracking hazardous waste)) Organizations: MICH DEPT OF TRANSPORTATION (CONTACT/OPERATOR)
Alternative names: MIDOT BRIDGE I-69 OVER MILLER RD
MI DEPT/ENVIRONMENTAL QUALITY (WEST OF 10363 BRISTOL RD in SWARTZ CREEK, MI)
(Resource Conservation and Recovery Act (tracking hazardous waste)) Alternative names: MI DEPT/ERD (E)
Housing units lacking complete plumbing facilities: 0.4%
83.4%Utility gas
9.7%Electricity
4.5%Bottled, tank, or LP gas
1.0%Wood
0.7%Fuel oil, kerosene, etc.
Population in 1990: 18,263. Population change in the 1990s: +1,392 (+7.6%).
Place of birth for U.S.-born residents:
This state: 19,254
Northeast: 297
Midwest: 1,067
South: 915
West: 305
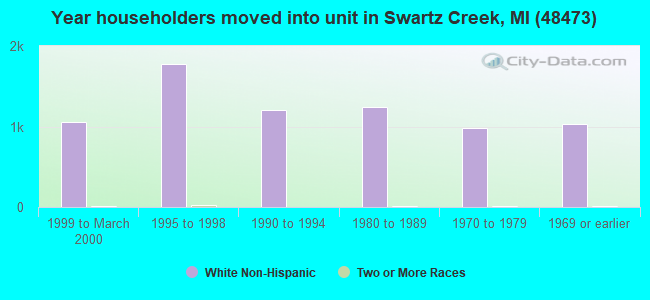
62% of the 48473 zip code residents lived in the same house 5 years ago. Out of people who lived in different houses, 74% lived in this county. Out of people who lived in different counties, 50% lived in Michigan.
95% of the 48473 zip code residents lived in the same house 1 year ago. Out of people who lived in different houses, 30% moved from this county. Out of people who lived in different houses, 31% moved from different county within same state. Out of people who lived in different houses, 41% moved from different state. Out of people who lived in different houses, 7% moved from abroad.
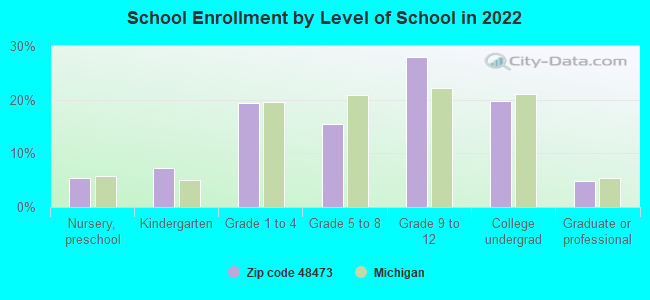
Private vs. public school enrollment:
Students in private schools in grades 1 to 8 (elementary and middle school): 291
Here:
19.4%
Michigan:
12.4%
Students in private schools in grades 9 to 12 (high school): 111
Here:
9.2%
Michigan:
9.8%
Students in private undergraduate colleges: 33
Here:
3.9%
Michigan:
14.9%
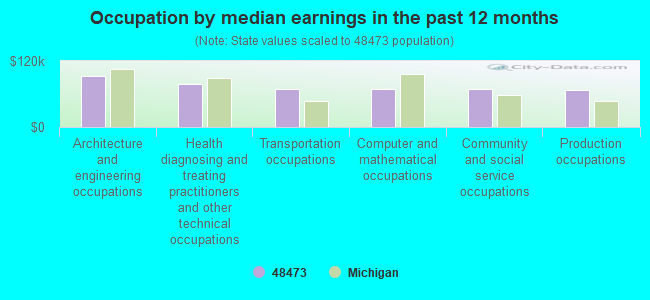
Occupation by median earnings in the past 12 months ($)
92,157Architecture and engineering occupations
78,974Health diagnosing and treating practitioners and other technical occupations
69,350Transportation occupations
69,300Computer and mathematical occupations
69,056Community and social service occupations
66,466Production occupations
Companies with federal contracts located in this zip code:
MICHIGAN COMMUNITY SERVICES IN (5239 MORRISH RD in SWARTZ CREEK, MI) : $86,859 in 6 contractsfrom 2003 to 2005
Contracts for Custodial Janitorial Services by Army Signed by year:2000: $0; 2001: $0; 2002: $0; 2003: $30,566; 2004: $25,830; 2005: $30,463; 2006: $0.
Biggest contracts:
$30,463 with Army for Custodial Janitorial Services. Signed on 2005-03-01. Completion date: 2005-02-28.
$25,830, same as above.Signed on 2004-03-01. Completion date: 2005-02-28.
$12,793, same as above.Signed on 2003-07-21. Completion date: 2004-02-29.
$11,376, same as above.Signed on 2003-02-19. Completion date: 2003-05-31.
QUALITY FIRST METROLOGY SOLUTI (2029 S ELMS RD BLDG C, STE in SWARTZ CREEK, MI; small business)
$42,000 with Army for Maintenance, Repair and Rebuilding of Equipment -- Automatic Data Processing Equipment (Including Firmware), Software, Supplies and Support Equipment. Taking place in IL. Signed on 2005-05-18. Completion date: 2005-07-19.
HOUGEN MANUFACTURING INC (3001 HOUGEN DR in SWARTZ CREEK, MI) : $3,891 in 2 contractsin 2005
$3,550 with Defense Logistics Agency for Cutting Tools for Machine Tools. Signed on 2005-11-17. Completion date: 2005-12-23.
$341 with Federal Supply Service for Hand Tools, Nonedged, Nonpowered. Signed on 2005-07-15. Completion date: 2005-08-17.
Top industries in this zip code by the number of employees in 2005:
Professional, Scientific, and Technical Services: Title Abstract and Settlement Offices (250-499 employees: 1 establishment)
2002 - 2018 National Fire Incident Reporting System (NFIRS) incidents
Based on the data from the years 2002 - 2018 the average number of fire incidents per year is 71. The highest number of fires - 115 took place in 2003, and the least - 40 in 2007. The data has a growing trend.
When looking into fire subcategories, the most reports belonged to: Structure Fires (57.0%), and Outside Fires (27.8%).
Fire incident types reported to NFIRS in Zip Code 48473


 Nearest zip codes: 48554, 48532, 48436, 48553, 48507, 48551.


 Based on the data from the years 2002 - 2018 the average number of fire incidents per year is 71. The highest number of fires - 115 took place in 2003, and the least - 40 in 2007. The data has a growing trend.
 When looking into fire subcategories, the most reports belonged to: Structure Fires (57.0%), and Outside Fires (27.8%).