Estimated zip code population in 2022: 22,836
Zip code population in 2010: 25,168
Zip code population in 2000: 29,011
Houses and condos: 11,654
Renter-occupied apartments: 4,924
% of renters here:
50%State:
27%
March 2022 cost of living index in zip code 48503: 79.6
(low, U.S. average is 100)
Land area: 8.2
sq. mi.
Water area: 0.1
sq. mi.
Population density: 2,784 people per square mile (average).
OSM Map
General Map
Google Map
MSN Map
OSM Map
General Map
Google Map
MSN Map
OSM Map
General Map
Google Map
MSN Map
OSM Map
General Map
Google Map
MSN Map
Please wait while loading the map...
Real estate property taxes paid for housing units in 2022:
This zip code:
1.7% ($1,287)Michigan:
1.2% ($2,746)
Median real estate property taxes paid for housing units with mortgages in 2022: $1,400 (1.5%)
Median real estate property taxes paid for housing units with no mortgage in 2022: $1,190 (2.0%)
Profiles of local businesses
Business Search - 14 Million verified businesses
Males: 11,589 Females: 11,247
For population 25 years and over in 48503:
High school or higher: 84.3%Bachelor's degree or higher: 18.0%Graduate or professional degree: 8.6%Unemployed: 12.3%Mean travel time to work (commute): 20.8 minutes
For population 15 years and over in 48503:
Never married: 47.4%Now married: 28.0%Separated: 3.5%Widowed: 5.5%Divorced: 15.7%
Zip code 48503 compared to state average:
Median household income below state average. Median house value significantly below state average. Unemployed percentage above state average. Black race population percentage significantly above state average. Hispanic race population percentage below state average. Foreign-born population percentage significantly below state average. Renting percentage above state average. Length of stay since moving in above state average. House age above state average. Percentage of population with a bachelor's degree or higher below state average. 12,656 55.4% Black 8,140 35.7% White 1,113 4.9% Two or more races 573 2.5% Hispanic or Latino 168 0.7% Asian 136 0.6% American Indian 46 0.2% Some other race
Data:
Median household income ($)
Median household income (% change since 2000)
Household income diversity
Ratio of average income to average house value (%)
Ratio of average income to average rent
Median household income ($) - White
Median household income ($) - Black or African American
Median household income ($) - Asian
Median household income ($) - Hispanic or Latino
Median household income ($) - American Indian and Alaska Native
Median household income ($) - Multirace
Median household income ($) - Other Race
Median household income for houses/condos with a mortgage ($)
Median household income for apartments without a mortgage ($)
Races - White alone (%)
Races - White alone (% change since 2000)
Races - Black alone (%)
Races - Black alone (% change since 2000)
Races - American Indian alone (%)
Races - American Indian alone (% change since 2000)
Races - Asian alone (%)
Races - Asian alone (% change since 2000)
Races - Hispanic (%)
Races - Hispanic (% change since 2000)
Races - Native Hawaiian and Other Pacific Islander alone (%)
Races - Native Hawaiian and Other Pacific Islander alone (% change since 2000)
Races - Two or more races (%)
Races - Two or more races (% change since 2000)
Races - Other race alone (%)
Races - Other race alone (% change since 2000)
Racial diversity
Unemployment (%)
Unemployment (% change since 2000)
Unemployment (%) - White
Unemployment (%) - Black or African American
Unemployment (%) - Asian
Unemployment (%) - Hispanic or Latino
Unemployment (%) - American Indian and Alaska Native
Unemployment (%) - Multirace
Unemployment (%) - Other Race
Population density (people per square mile)
Population - Males (%)
Population - Females (%)
Population - Males (%) - White
Population - Males (%) - Black or African American
Population - Males (%) - Asian
Population - Males (%) - Hispanic or Latino
Population - Males (%) - American Indian and Alaska Native
Population - Males (%) - Multirace
Population - Males (%) - Other Race
Population - Females (%) - White
Population - Females (%) - Black or African American
Population - Females (%) - Asian
Population - Females (%) - Hispanic or Latino
Population - Females (%) - American Indian and Alaska Native
Population - Females (%) - Multirace
Population - Females (%) - Other Race
Coronavirus confirmed cases (Apr 27, 2024)
Deaths caused by coronavirus (Apr 27, 2024)
Coronavirus confirmed cases (per 100k population) (Apr 27, 2024)
Deaths caused by coronavirus (per 100k population) (Apr 27, 2024)
Daily increase in number of cases (Apr 27, 2024)
Weekly increase in number of cases (Apr 27, 2024)
Cases doubled (in days) (Apr 27, 2024)
Hospitalized patients (Apr 18, 2022)
Negative test results (Apr 18, 2022)
Total test results (Apr 18, 2022)
COVID Vaccine doses distributed (per 100k population) (Sep 19, 2023)
COVID Vaccine doses administered (per 100k population) (Sep 19, 2023)
COVID Vaccine doses distributed (Sep 19, 2023)
COVID Vaccine doses administered (Sep 19, 2023)
Likely homosexual households (%)
Likely homosexual households (% change since 2000)
Likely homosexual households - Lesbian couples (%)
Likely homosexual households - Lesbian couples (% change since 2000)
Likely homosexual households - Gay men (%)
Likely homosexual households - Gay men (% change since 2000)
Cost of living index
Median gross rent ($)
Median contract rent ($)
Median monthly housing costs ($)
Median house or condo value ($)
Median house or condo value ($ change since 2000)
Mean house or condo value by units in structure - 1, detached ($)
Mean house or condo value by units in structure - 1, attached ($)
Mean house or condo value by units in structure - 2 ($)
Mean house or condo value by units in structure by units in structure - 3 or 4 ($)
Mean house or condo value by units in structure - 5 or more ($)
Mean house or condo value by units in structure - Boat, RV, van, etc. ($)
Mean house or condo value by units in structure - Mobile home ($)
Median house or condo value ($) - White
Median house or condo value ($) - Black or African American
Median house or condo value ($) - Asian
Median house or condo value ($) - Hispanic or Latino
Median house or condo value ($) - American Indian and Alaska Native
Median house or condo value ($) - Multirace
Median house or condo value ($) - Other Race
Median resident age
Resident age diversity
Median resident age - Males
Median resident age - Females
Median resident age - White
Median resident age - Black or African American
Median resident age - Asian
Median resident age - Hispanic or Latino
Median resident age - American Indian and Alaska Native
Median resident age - Multirace
Median resident age - Other Race
Median resident age - Males - White
Median resident age - Males - Black or African American
Median resident age - Males - Asian
Median resident age - Males - Hispanic or Latino
Median resident age - Males - American Indian and Alaska Native
Median resident age - Males - Multirace
Median resident age - Males - Other Race
Median resident age - Females - White
Median resident age - Females - Black or African American
Median resident age - Females - Asian
Median resident age - Females - Hispanic or Latino
Median resident age - Females - American Indian and Alaska Native
Median resident age - Females - Multirace
Median resident age - Females - Other Race
Commute - mean travel time to work (minutes)
Travel time to work - Less than 5 minutes (%)
Travel time to work - Less than 5 minutes (% change since 2000)
Travel time to work - 5 to 9 minutes (%)
Travel time to work - 5 to 9 minutes (% change since 2000)
Travel time to work - 10 to 19 minutes (%)
Travel time to work - 10 to 19 minutes (% change since 2000)
Travel time to work - 20 to 29 minutes (%)
Travel time to work - 20 to 29 minutes (% change since 2000)
Travel time to work - 30 to 39 minutes (%)
Travel time to work - 30 to 39 minutes (% change since 2000)
Travel time to work - 40 to 59 minutes (%)
Travel time to work - 40 to 59 minutes (% change since 2000)
Travel time to work - 60 to 89 minutes (%)
Travel time to work - 60 to 89 minutes (% change since 2000)
Travel time to work - 90 or more minutes (%)
Travel time to work - 90 or more minutes (% change since 2000)
Marital status - Never married (%)
Marital status - Now married (%)
Marital status - Separated (%)
Marital status - Widowed (%)
Marital status - Divorced (%)
Median family income ($)
Median family income (% change since 2000)
Median non-family income ($)
Median non-family income (% change since 2000)
Median per capita income ($)
Median per capita income (% change since 2000)
Median family income ($) - White
Median family income ($) - Black or African American
Median family income ($) - Asian
Median family income ($) - Hispanic or Latino
Median family income ($) - American Indian and Alaska Native
Median family income ($) - Multirace
Median family income ($) - Other Race
Median year house/condo built
Median year apartment built
Year house built - Built 2005 or later (%)
Year house built - Built 2000 to 2004 (%)
Year house built - Built 1990 to 1999 (%)
Year house built - Built 1980 to 1989 (%)
Year house built - Built 1970 to 1979 (%)
Year house built - Built 1960 to 1969 (%)
Year house built - Built 1950 to 1959 (%)
Year house built - Built 1940 to 1949 (%)
Year house built - Built 1939 or earlier (%)
Average household size
Household density (households per square mile)
Average household size - White
Average household size - Black or African American
Average household size - Asian
Average household size - Hispanic or Latino
Average household size - American Indian and Alaska Native
Average household size - Multirace
Average household size - Other Race
Occupied housing units (%)
Vacant housing units (%)
Owner occupied housing units (%)
Renter occupied housing units (%)
Vacancy status - For rent (%)
Vacancy status - For sale only (%)
Vacancy status - Rented or sold, not occupied (%)
Vacancy status - For seasonal, recreational, or occasional use (%)
Vacancy status - For migrant workers (%)
Vacancy status - Other vacant (%)
Residents with income below the poverty level (%)
Residents with income below 50% of the poverty level (%)
Children below poverty level (%)
Poor families by family type - Married-couple family (%)
Poor families by family type - Male, no wife present (%)
Poor families by family type - Female, no husband present (%)
Poverty status for native-born residents (%)
Poverty status for foreign-born residents (%)
Poverty among high school graduates not in families (%)
Poverty among people who did not graduate high school not in families (%)
Residents with income below the poverty level (%) - White
Residents with income below the poverty level (%) - Black or African American
Residents with income below the poverty level (%) - Asian
Residents with income below the poverty level (%) - Hispanic or Latino
Residents with income below the poverty level (%) - American Indian and Alaska Native
Residents with income below the poverty level (%) - Multirace
Residents with income below the poverty level (%) - Other Race
Air pollution - Air Quality Index (AQI)
Air pollution - CO
Air pollution - NO2
Air pollution - SO2
Air pollution - Ozone
Air pollution - PM10
Air pollution - PM25
Air pollution - Pb
Crime - Murders per 100,000 population
Crime - Rapes per 100,000 population
Crime - Robberies per 100,000 population
Crime - Assaults per 100,000 population
Crime - Burglaries per 100,000 population
Crime - Thefts per 100,000 population
Crime - Auto thefts per 100,000 population
Crime - Arson per 100,000 population
Crime - City-data.com crime index
Crime - Violent crime index
Crime - Property crime index
Crime - Murders per 100,000 population (5 year average)
Crime - Rapes per 100,000 population (5 year average)
Crime - Robberies per 100,000 population (5 year average)
Crime - Assaults per 100,000 population (5 year average)
Crime - Burglaries per 100,000 population (5 year average)
Crime - Thefts per 100,000 population (5 year average)
Crime - Auto thefts per 100,000 population (5 year average)
Crime - Arson per 100,000 population (5 year average)
Crime - City-data.com crime index (5 year average)
Crime - Violent crime index (5 year average)
Crime - Property crime index (5 year average)
1996 Presidential Elections Results (%) - Democratic Party (Clinton)
1996 Presidential Elections Results (%) - Republican Party (Dole)
1996 Presidential Elections Results (%) - Other
2000 Presidential Elections Results (%) - Democratic Party (Gore)
2000 Presidential Elections Results (%) - Republican Party (Bush)
2000 Presidential Elections Results (%) - Other
2004 Presidential Elections Results (%) - Democratic Party (Kerry)
2004 Presidential Elections Results (%) - Republican Party (Bush)
2004 Presidential Elections Results (%) - Other
2008 Presidential Elections Results (%) - Democratic Party (Obama)
2008 Presidential Elections Results (%) - Republican Party (McCain)
2008 Presidential Elections Results (%) - Other
2012 Presidential Elections Results (%) - Democratic Party (Obama)
2012 Presidential Elections Results (%) - Republican Party (Romney)
2012 Presidential Elections Results (%) - Other
2016 Presidential Elections Results (%) - Democratic Party (Clinton)
2016 Presidential Elections Results (%) - Republican Party (Trump)
2016 Presidential Elections Results (%) - Other
2020 Presidential Elections Results (%) - Democratic Party (Biden)
2020 Presidential Elections Results (%) - Republican Party (Trump)
2020 Presidential Elections Results (%) - Other
Ancestries Reported - Arab (%)
Ancestries Reported - Czech (%)
Ancestries Reported - Danish (%)
Ancestries Reported - Dutch (%)
Ancestries Reported - English (%)
Ancestries Reported - French (%)
Ancestries Reported - French Canadian (%)
Ancestries Reported - German (%)
Ancestries Reported - Greek (%)
Ancestries Reported - Hungarian (%)
Ancestries Reported - Irish (%)
Ancestries Reported - Italian (%)
Ancestries Reported - Lithuanian (%)
Ancestries Reported - Norwegian (%)
Ancestries Reported - Polish (%)
Ancestries Reported - Portuguese (%)
Ancestries Reported - Russian (%)
Ancestries Reported - Scotch-Irish (%)
Ancestries Reported - Scottish (%)
Ancestries Reported - Slovak (%)
Ancestries Reported - Subsaharan African (%)
Ancestries Reported - Swedish (%)
Ancestries Reported - Swiss (%)
Ancestries Reported - Ukrainian (%)
Ancestries Reported - United States (%)
Ancestries Reported - Welsh (%)
Ancestries Reported - West Indian (%)
Ancestries Reported - Other (%)
Educational Attainment - No schooling completed (%)
Educational Attainment - Less than high school (%)
Educational Attainment - High school or equivalent (%)
Educational Attainment - Less than 1 year of college (%)
Educational Attainment - 1 or more years of college (%)
Educational Attainment - Associate degree (%)
Educational Attainment - Bachelor's degree (%)
Educational Attainment - Master's degree (%)
Educational Attainment - Professional school degree (%)
Educational Attainment - Doctorate degree (%)
School Enrollment - Nursery, preschool (%)
School Enrollment - Kindergarten (%)
School Enrollment - Grade 1 to 4 (%)
School Enrollment - Grade 5 to 8 (%)
School Enrollment - Grade 9 to 12 (%)
School Enrollment - College undergrad (%)
School Enrollment - Graduate or professional (%)
School Enrollment - Not enrolled in school (%)
School enrollment - Public schools (%)
School enrollment - Private schools (%)
School enrollment - Not enrolled (%)
Median number of rooms in houses and condos
Median number of rooms in apartments
Housing units lacking complete plumbing facilities (%)
Housing units lacking complete kitchen facilities (%)
Density of houses
Urban houses (%)
Rural houses (%)
Households with people 60 years and over (%)
Households with people 65 years and over (%)
Households with people 75 years and over (%)
Households with one or more nonrelatives (%)
Households with no nonrelatives (%)
Population in households (%)
Family households (%)
Nonfamily households (%)
Population in families (%)
Family households with own children (%)
Median number of bedrooms in owner occupied houses
Mean number of bedrooms in owner occupied houses
Median number of bedrooms in renter occupied houses
Mean number of bedrooms in renter occupied houses
Median number of vehichles in owner occupied houses
Mean number of vehichles in owner occupied houses
Median number of vehichles in renter occupied houses
Mean number of vehichles in renter occupied houses
Mortgage status - with mortgage (%)
Mortgage status - with second mortgage (%)
Mortgage status - with home equity loan (%)
Mortgage status - with both second mortgage and home equity loan (%)
Mortgage status - without a mortgage (%)
Average family size
Average family size - White
Average family size - Black or African American
Average family size - Asian
Average family size - Hispanic or Latino
Average family size - American Indian and Alaska Native
Average family size - Multirace
Average family size - Other Race
Geographical mobility - Same house 1 year ago (%)
Geographical mobility - Moved within same county (%)
Geographical mobility - Moved from different county within same state (%)
Geographical mobility - Moved from different state (%)
Geographical mobility - Moved from abroad (%)
Place of birth - Born in state of residence (%)
Place of birth - Born in other state (%)
Place of birth - Native, outside of US (%)
Place of birth - Foreign born (%)
Housing units in structures - 1, detached (%)
Housing units in structures - 1, attached (%)
Housing units in structures - 2 (%)
Housing units in structures - 3 or 4 (%)
Housing units in structures - 5 to 9 (%)
Housing units in structures - 10 to 19 (%)
Housing units in structures - 20 to 49 (%)
Housing units in structures - 50 or more (%)
Housing units in structures - Mobile home (%)
Housing units in structures - Boat, RV, van, etc. (%)
House/condo owner moved in on average (years ago)
Renter moved in on average (years ago)
Year householder moved into unit - Moved in 1999 to March 2000 (%)
Year householder moved into unit - Moved in 1995 to 1998 (%)
Year householder moved into unit - Moved in 1990 to 1994 (%)
Year householder moved into unit - Moved in 1980 to 1989 (%)
Year householder moved into unit - Moved in 1970 to 1979 (%)
Year householder moved into unit - Moved in 1969 or earlier (%)
Means of transportation to work - Drove car alone (%)
Means of transportation to work - Carpooled (%)
Means of transportation to work - Public transportation (%)
Means of transportation to work - Bus or trolley bus (%)
Means of transportation to work - Streetcar or trolley car (%)
Means of transportation to work - Subway or elevated (%)
Means of transportation to work - Railroad (%)
Means of transportation to work - Ferryboat (%)
Means of transportation to work - Taxicab (%)
Means of transportation to work - Motorcycle (%)
Means of transportation to work - Bicycle (%)
Means of transportation to work - Walked (%)
Means of transportation to work - Other means (%)
Working at home (%)
Industry diversity
Most Common Industries - Agriculture, forestry, fishing and hunting, and mining (%)
Most Common Industries - Agriculture, forestry, fishing and hunting (%)
Most Common Industries - Mining, quarrying, and oil and gas extraction (%)
Most Common Industries - Construction (%)
Most Common Industries - Manufacturing (%)
Most Common Industries - Wholesale trade (%)
Most Common Industries - Retail trade (%)
Most Common Industries - Transportation and warehousing, and utilities (%)
Most Common Industries - Transportation and warehousing (%)
Most Common Industries - Utilities (%)
Most Common Industries - Information (%)
Most Common Industries - Finance and insurance, and real estate and rental and leasing (%)
Most Common Industries - Finance and insurance (%)
Most Common Industries - Real estate and rental and leasing (%)
Most Common Industries - Professional, scientific, and management, and administrative and waste management services (%)
Most Common Industries - Professional, scientific, and technical services (%)
Most Common Industries - Management of companies and enterprises (%)
Most Common Industries - Administrative and support and waste management services (%)
Most Common Industries - Educational services, and health care and social assistance (%)
Most Common Industries - Educational services (%)
Most Common Industries - Health care and social assistance (%)
Most Common Industries - Arts, entertainment, and recreation, and accommodation and food services (%)
Most Common Industries - Arts, entertainment, and recreation (%)
Most Common Industries - Accommodation and food services (%)
Most Common Industries - Other services, except public administration (%)
Most Common Industries - Public administration (%)
Occupation diversity
Most Common Occupations - Management, business, science, and arts occupations (%)
Most Common Occupations - Management, business, and financial occupations (%)
Most Common Occupations - Management occupations (%)
Most Common Occupations - Business and financial operations occupations (%)
Most Common Occupations - Computer, engineering, and science occupations (%)
Most Common Occupations - Computer and mathematical occupations (%)
Most Common Occupations - Architecture and engineering occupations (%)
Most Common Occupations - Life, physical, and social science occupations (%)
Most Common Occupations - Education, legal, community service, arts, and media occupations (%)
Most Common Occupations - Community and social service occupations (%)
Most Common Occupations - Legal occupations (%)
Most Common Occupations - Education, training, and library occupations (%)
Most Common Occupations - Arts, design, entertainment, sports, and media occupations (%)
Most Common Occupations - Healthcare practitioners and technical occupations (%)
Most Common Occupations - Health diagnosing and treating practitioners and other technical occupations (%)
Most Common Occupations - Health technologists and technicians (%)
Most Common Occupations - Service occupations (%)
Most Common Occupations - Healthcare support occupations (%)
Most Common Occupations - Protective service occupations (%)
Most Common Occupations - Fire fighting and prevention, and other protective service workers including supervisors (%)
Most Common Occupations - Law enforcement workers including supervisors (%)
Most Common Occupations - Food preparation and serving related occupations (%)
Most Common Occupations - Building and grounds cleaning and maintenance occupations (%)
Most Common Occupations - Personal care and service occupations (%)
Most Common Occupations - Sales and office occupations (%)
Most Common Occupations - Sales and related occupations (%)
Most Common Occupations - Office and administrative support occupations (%)
Most Common Occupations - Natural resources, construction, and maintenance occupations (%)
Most Common Occupations - Farming, fishing, and forestry occupations (%)
Most Common Occupations - Construction and extraction occupations (%)
Most Common Occupations - Installation, maintenance, and repair occupations (%)
Most Common Occupations - Production, transportation, and material moving occupations (%)
Most Common Occupations - Production occupations (%)
Most Common Occupations - Transportation occupations (%)
Most Common Occupations - Material moving occupations (%)
People in Group quarters - Institutionalized population (%)
People in Group quarters - Correctional institutions (%)
People in Group quarters - Federal prisons and detention centers (%)
People in Group quarters - Halfway houses (%)
People in Group quarters - Local jails and other confinement facilities (including police lockups) (%)
People in Group quarters - Military disciplinary barracks (%)
People in Group quarters - State prisons (%)
People in Group quarters - Other types of correctional institutions (%)
People in Group quarters - Nursing homes (%)
People in Group quarters - Hospitals/wards, hospices, and schools for the handicapped (%)
People in Group quarters - Hospitals/wards and hospices for chronically ill (%)
People in Group quarters - Hospices or homes for chronically ill (%)
People in Group quarters - Military hospitals or wards for chronically ill (%)
People in Group quarters - Other hospitals or wards for chronically ill (%)
People in Group quarters - Hospitals or wards for drug/alcohol abuse (%)
People in Group quarters - Mental (Psychiatric) hospitals or wards (%)
People in Group quarters - Schools, hospitals, or wards for the mentally retarded (%)
People in Group quarters - Schools, hospitals, or wards for the physically handicapped (%)
People in Group quarters - Institutions for the deaf (%)
People in Group quarters - Institutions for the blind (%)
People in Group quarters - Orthopedic wards and institutions for the physically handicapped (%)
People in Group quarters - Wards in general hospitals for patients who have no usual home elsewhere (%)
People in Group quarters - Wards in military hospitals for patients who have no usual home elsewhere (%)
People in Group quarters - Juvenile institutions (%)
People in Group quarters - Long-term care (%)
People in Group quarters - Homes for abused, dependent, and neglected children (%)
People in Group quarters - Residential treatment centers for emotionally disturbed children (%)
People in Group quarters - Training schools for juvenile delinquents (%)
People in Group quarters - Short-term care, detention or diagnostic centers for delinquent children (%)
People in Group quarters - Type of juvenile institution unknown (%)
People in Group quarters - Noninstitutionalized population (%)
People in Group quarters - College dormitories (includes college quarters off campus) (%)
People in Group quarters - Military quarters (%)
People in Group quarters - On base (%)
People in Group quarters - Barracks, unaccompanied personnel housing (UPH), (Enlisted/Officer), ;and similar group living quarters for military personnel (%)
People in Group quarters - Transient quarters for temporary residents (%)
People in Group quarters - Military ships (%)
People in Group quarters - Group homes (%)
People in Group quarters - Homes or halfway houses for drug/alcohol abuse (%)
People in Group quarters - Homes for the mentally ill (%)
People in Group quarters - Homes for the mentally retarded (%)
People in Group quarters - Homes for the physically handicapped (%)
People in Group quarters - Other group homes (%)
People in Group quarters - Religious group quarters (%)
People in Group quarters - Dormitories (%)
People in Group quarters - Agriculture workers' dormitories on farms (%)
People in Group quarters - Job Corps and vocational training facilities (%)
People in Group quarters - Other workers' dormitories (%)
People in Group quarters - Crews of maritime vessels (%)
People in Group quarters - Other nonhousehold living situations (%)
People in Group quarters - Other noninstitutional group quarters (%)
Residents speaking English at home (%)
Residents speaking English at home - Born in the United States (%)
Residents speaking English at home - Native, born elsewhere (%)
Residents speaking English at home - Foreign born (%)
Residents speaking Spanish at home (%)
Residents speaking Spanish at home - Born in the United States (%)
Residents speaking Spanish at home - Native, born elsewhere (%)
Residents speaking Spanish at home - Foreign born (%)
Residents speaking other language at home (%)
Residents speaking other language at home - Born in the United States (%)
Residents speaking other language at home - Native, born elsewhere (%)
Residents speaking other language at home - Foreign born (%)
Class of Workers - Employee of private company (%)
Class of Workers - Self-employed in own incorporated business (%)
Class of Workers - Private not-for-profit wage and salary workers (%)
Class of Workers - Local government workers (%)
Class of Workers - State government workers (%)
Class of Workers - Federal government workers (%)
Class of Workers - Self-employed workers in own not incorporated business and Unpaid family workers (%)
House heating fuel used in houses and condos - Utility gas (%)
House heating fuel used in houses and condos - Bottled, tank, or LP gas (%)
House heating fuel used in houses and condos - Electricity (%)
House heating fuel used in houses and condos - Fuel oil, kerosene, etc. (%)
House heating fuel used in houses and condos - Coal or coke (%)
House heating fuel used in houses and condos - Wood (%)
House heating fuel used in houses and condos - Solar energy (%)
House heating fuel used in houses and condos - Other fuel (%)
House heating fuel used in houses and condos - No fuel used (%)
House heating fuel used in apartments - Utility gas (%)
House heating fuel used in apartments - Bottled, tank, or LP gas (%)
House heating fuel used in apartments - Electricity (%)
House heating fuel used in apartments - Fuel oil, kerosene, etc. (%)
House heating fuel used in apartments - Coal or coke (%)
House heating fuel used in apartments - Wood (%)
House heating fuel used in apartments - Solar energy (%)
House heating fuel used in apartments - Other fuel (%)
House heating fuel used in apartments - No fuel used (%)
Armed forces status - In Armed Forces (%)
Armed forces status - Civilian (%)
Armed forces status - Civilian - Veteran (%)
Armed forces status - Civilian - Nonveteran (%)
Fatal accidents locations in years 2005-2021
Fatal accidents locations in 2005
Fatal accidents locations in 2006
Fatal accidents locations in 2007
Fatal accidents locations in 2008
Fatal accidents locations in 2009
Fatal accidents locations in 2010
Fatal accidents locations in 2011
Fatal accidents locations in 2012
Fatal accidents locations in 2013
Fatal accidents locations in 2014
Fatal accidents locations in 2015
Fatal accidents locations in 2016
Fatal accidents locations in 2017
Fatal accidents locations in 2018
Fatal accidents locations in 2019
Fatal accidents locations in 2020
Fatal accidents locations in 2021
Alcohol use - People drinking some alcohol every month (%)
Alcohol use - People not drinking at all (%)
Alcohol use - Average days/month drinking alcohol
Alcohol use - Average drinks/week
Alcohol use - Average days/year people drink much
Audiometry - Average condition of hearing (%)
Audiometry - People that can hear a whisper from across a quiet room (%)
Audiometry - People that can hear normal voice from across a quiet room (%)
Audiometry - Ears ringing, roaring, buzzing (%)
Audiometry - Had a job exposure to loud noise (%)
Audiometry - Had off-work exposure to loud noise (%)
Blood Pressure & Cholesterol - Has high blood pressure (%)
Blood Pressure & Cholesterol - Checking blood pressure at home (%)
Blood Pressure & Cholesterol - Frequently checking blood cholesterol (%)
Blood Pressure & Cholesterol - Has high cholesterol level (%)
Consumer Behavior - Money monthly spent on food at supermarket/grocery store
Consumer Behavior - Money monthly spent on food at other stores
Consumer Behavior - Money monthly spent on eating out
Consumer Behavior - Money monthly spent on carryout/delivered foods
Consumer Behavior - Income spent on food at supermarket/grocery store (%)
Consumer Behavior - Income spent on food at other stores (%)
Consumer Behavior - Income spent on eating out (%)
Consumer Behavior - Income spent on carryout/delivered foods (%)
Current Health Status - General health condition (%)
Current Health Status - Blood donors (%)
Current Health Status - Has blood ever tested for HIV virus (%)
Current Health Status - Left-handed people (%)
Dermatology - People using sunscreen (%)
Diabetes - Diabetics (%)
Diabetes - Had a blood test for high blood sugar (%)
Diabetes - People taking insulin (%)
Diet Behavior & Nutrition - Diet health (%)
Diet Behavior & Nutrition - Milk product consumption (# of products/month)
Diet Behavior & Nutrition - Meals not home prepared (#/week)
Diet Behavior & Nutrition - Meals from fast food or pizza place (#/week)
Diet Behavior & Nutrition - Ready-to-eat foods (#/month)
Diet Behavior & Nutrition - Frozen meals/pizza (#/month)
Drug Use - People that ever used marijuana or hashish (%)
Drug Use - Ever used hard drugs (%)
Drug Use - Ever used any form of cocaine (%)
Drug Use - Ever used heroin (%)
Drug Use - Ever used methamphetamine (%)
Health Insurance - People covered by health insurance (%)
Kidney Conditions-Urology - Avg. # of times urinating at night
Medical Conditions - People with asthma (%)
Medical Conditions - People with anemia (%)
Medical Conditions - People with psoriasis (%)
Medical Conditions - People with overweight (%)
Medical Conditions - Elderly people having difficulties in thinking or remembering (%)
Medical Conditions - People who ever received blood transfusion (%)
Medical Conditions - People having trouble seeing even with glass/contacts (%)
Medical Conditions - People with arthritis (%)
Medical Conditions - People with gout (%)
Medical Conditions - People with congestive heart failure (%)
Medical Conditions - People with coronary heart disease (%)
Medical Conditions - People with angina pectoris (%)
Medical Conditions - People who ever had heart attack (%)
Medical Conditions - People who ever had stroke (%)
Medical Conditions - People with emphysema (%)
Medical Conditions - People with thyroid problem (%)
Medical Conditions - People with chronic bronchitis (%)
Medical Conditions - People with any liver condition (%)
Medical Conditions - People who ever had cancer or malignancy (%)
Mental Health - People who have little interest in doing things (%)
Mental Health - People feeling down, depressed, or hopeless (%)
Mental Health - People who have trouble sleeping or sleeping too much (%)
Mental Health - People feeling tired or having little energy (%)
Mental Health - People with poor appetite or overeating (%)
Mental Health - People feeling bad about themself (%)
Mental Health - People who have trouble concentrating on things (%)
Mental Health - People moving or speaking slowly or too fast (%)
Mental Health - People having thoughts they would be better off dead (%)
Oral Health - Average years since last visit a dentist
Oral Health - People embarrassed because of mouth (%)
Oral Health - People with gum disease (%)
Oral Health - General health of teeth and gums (%)
Oral Health - Average days a week using dental floss/device
Oral Health - Average days a week using mouthwash for dental problem
Oral Health - Average number of teeth
Pesticide Use - Households using pesticides to control insects (%)
Pesticide Use - Households using pesticides to kill weeds (%)
Physical Activity - People doing vigorous-intensity work activities (%)
Physical Activity - People doing moderate-intensity work activities (%)
Physical Activity - People walking or bicycling (%)
Physical Activity - People doing vigorous-intensity recreational activities (%)
Physical Activity - People doing moderate-intensity recreational activities (%)
Physical Activity - Average hours a day doing sedentary activities
Physical Activity - Average hours a day watching TV or videos
Physical Activity - Average hours a day using computer
Physical Functioning - People having limitations keeping them from working (%)
Physical Functioning - People limited in amount of work they can do (%)
Physical Functioning - People that need special equipment to walk (%)
Physical Functioning - People experiencing confusion/memory problems (%)
Physical Functioning - People requiring special healthcare equipment (%)
Prescription Medications - Average number of prescription medicines taking
Preventive Aspirin Use - Adults 40+ taking low-dose aspirin (%)
Reproductive Health - Vaginal deliveries (%)
Reproductive Health - Cesarean deliveries (%)
Reproductive Health - Deliveries resulted in a live birth (%)
Reproductive Health - Pregnancies resulted in a delivery (%)
Reproductive Health - Women breastfeeding newborns (%)
Reproductive Health - Women that had a hysterectomy (%)
Reproductive Health - Women that had both ovaries removed (%)
Reproductive Health - Women that have ever taken birth control pills (%)
Reproductive Health - Women taking birth control pills (%)
Reproductive Health - Women that have ever used Depo-Provera or injectables (%)
Reproductive Health - Women that have ever used female hormones (%)
Sexual Behavior - People 18+ that ever had sex (vaginal, anal, or oral) (%)
Sexual Behavior - Males 18+ that ever had vaginal sex with a woman (%)
Sexual Behavior - Males 18+ that ever performed oral sex on a woman (%)
Sexual Behavior - Males 18+ that ever had anal sex with a woman (%)
Sexual Behavior - Males 18+ that ever had any sex with a man (%)
Sexual Behavior - Females 18+ that ever had vaginal sex with a man (%)
Sexual Behavior - Females 18+ that ever performed oral sex on a man (%)
Sexual Behavior - Females 18+ that ever had anal sex with a man (%)
Sexual Behavior - Females 18+ that ever had any kind of sex with a woman (%)
Sexual Behavior - Average age people first had sex
Sexual Behavior - Average number of female sex partners in lifetime (males 18+)
Sexual Behavior - Average number of female vaginal sex partners in lifetime (males 18+)
Sexual Behavior - Average age people first performed oral sex on a woman (18+)
Sexual Behavior - Average number of woman performed oral sex on in lifetime (18+)
Sexual Behavior - Average number of male sex partners in lifetime (males 18+)
Sexual Behavior - Average number of male anal sex partners in lifetime (males 18+)
Sexual Behavior - Average age people first performed oral sex on a man (18+)
Sexual Behavior - Average number of male oral sex partners in lifetime (18+)
Sexual Behavior - People using protection when performing oral sex (%)
Sexual Behavior - Average number of times people have vaginal or anal sex a year
Sexual Behavior - People having sex without condom (%)
Sexual Behavior - Average number of male sex partners in lifetime (females 18+)
Sexual Behavior - Average number of male vaginal sex partners in lifetime (females 18+)
Sexual Behavior - Average number of female sex partners in lifetime (females 18+)
Sexual Behavior - Circumcised males 18+ (%)
Sleep Disorders - Average hours sleeping at night
Sleep Disorders - People that has trouble sleeping (%)
Smoking-Cigarette Use - People smoking cigarettes (%)
Taste & Smell - People 40+ having problems with smell (%)
Taste & Smell - People 40+ having problems with taste (%)
Taste & Smell - People 40+ that ever had wisdom teeth removed (%)
Taste & Smell - People 40+ that ever had tonsils teeth removed (%)
Taste & Smell - People 40+ that ever had a loss of consciousness because of a head injury (%)
Taste & Smell - People 40+ that ever had a broken nose or other serious injury to face or skull (%)
Taste & Smell - People 40+ that ever had two or more sinus infections (%)
Weight - Average height (inches)
Weight - Average weight (pounds)
Weight - Average BMI
Weight - People that are obese (%)
Weight - People that ever were obese (%)
Weight - People trying to lose weight (%)
100%
urban population.
Estimated median house/condo value in 2022: $73,870
48503:
$73,870Michigan:
$224,400
Median resident age: This zip code:
38.5 yearsMichigan median age:
40.3 years
Average household size: This zip code:
2.3 peopleMichigan:
2.4 people
Averages for the 2020 tax year for zip code 48503, filed in 2021:
Average Adjusted Gross Income (AGI) in 2020: $35,763 (Individual Income Tax Returns) Here:
$35,763State:
$68,945
Salary/wage: $30,938 (reported on 73.4% of returns )Here:
$30,938State:
$57,142
(% of AGI for various income ranges: 872.9% for AGIs below $25k , 2974.0% for AGIs $25k-50k , 5978.9% for AGIs $50k-75k , 9367.3% for AGIs $75k-100k , 15447.3% for AGIs $100k-200k , 89695.0% for AGIs over 200k ) Taxable interest for individuals: $740 (reported on 17.7% of returns )This zip code:
$740Michigan:
$1,630
(% of AGI for various income ranges: 4.8% for AGIs below $25k , 11.7% for AGIs $25k-50k , 23.9% for AGIs $50k-75k , 71.5% for AGIs $75k-100k , 130.5% for AGIs $100k-200k , 840.0% for AGIs over 200k ) Ordinary dividends: $4,852 (reported on 7.1% of returns )(% of AGI for various income ranges: 4.7% for AGIs below $25k , 19.1% for AGIs $25k-50k , 63.3% for AGIs $50k-75k , 145.8% for AGIs $75k-100k , 335.5% for AGIs $100k-200k , 5385.0% for AGIs over 200k ) Net capital gain/loss in AGI: +$3,797 (reported on 6.8% of returns )Here:
+$3,797State:
+$20,064
(% of AGI for various income ranges: 2.4% for AGIs below $25k , 5.7% for AGIs $25k-50k , 46.8% for AGIs $50k-75k , 94.2% for AGIs $75k-100k , 447.7% for AGIs $100k-200k , 3395.0% for AGIs over 200k ) Profit/loss from business: +$3,427 (reported on 16.9% of returns )Here:
+$3,427State:
+$11,172
(% of AGI for various income ranges: 74.9% for AGIs below $25k , 26.3% for AGIs $25k-50k , 104.1% for AGIs $50k-75k , 114.2% for AGIs $75k-100k , 241.8% for AGIs $100k-200k , 3265.0% for AGIs over 200k ) Taxable individual retirement arrangement distribution: $11,805 (reported on 4.3% of returns )48503:
$11,805Michigan:
$19,803
(% of AGI for various income ranges: 8.2% for AGIs below $25k , 35.8% for AGIs $25k-50k , 129.8% for AGIs $50k-75k , 263.5% for AGIs $75k-100k , 953.6% for AGIs $100k-200k ) Total itemized deductions: $26,958 (reported on 2.6% of returns )Here:
$26,958State:
$34,117
(% of AGI for various income ranges: 10.7% for AGIs below $25k , 34.5% for AGIs $25k-50k , 203.9% for AGIs $50k-75k , 355.4% for AGIs $75k-100k , 711.4% for AGIs $100k-200k , 7450.0% for AGIs over 200k ) Charity contributions: $11,771 (reported on 2.2% of returns )Here:
$11,771State:
$13,548
(% of AGI for various income ranges: 14.8% for AGIs $25k-50k , 57.4% for AGIs $50k-75k , 153.1% for AGIs $75k-100k , 284.1% for AGIs $100k-200k , 3715.0% for AGIs over 200k ) Taxes paid: $6,150 (reported on 2.6% of returns )(% of AGI for various income ranges: 1.0% for AGIs below $25k , 6.1% for AGIs $25k-50k , 37.6% for AGIs $50k-75k , 89.2% for AGIs $75k-100k , 228.6% for AGIs $100k-200k , 1625.0% for AGIs over 200k ) Earned income credit: $2,540 (reported on 31.8% of returns )(% of AGI for various income ranges: 139.6% for AGIs below $25k , 117.6% for AGIs $25k-50k ) Percentage of individuals using paid preparers for their 2020 taxes: 92.8%(% for various income ranges: 93.4% for AGIs below $25k , 93.1% for AGIs $25k-50k , 90.5% for AGIs $50k-75k , 93.0% for AGIs $75k-100k , 90.2% for AGIs $100k-200k , 87.5% for AGIs over 200k )
Averages for the 2012 tax year for zip code 48503, filed in 2013:
Average Adjusted Gross Income (AGI) in 2012: $31,575 (Individual Income Tax Returns) Here:
$31,575State:
$55,609
Salary/wage: $25,485 (reported on 78.3% of returns )Here:
$25,485State:
$46,782
(% of AGI for various income ranges: 63.3% for AGIs below $25k , 66.3% for AGIs $25k-50k , 63.4% for AGIs $50k-75k , 64.9% for AGIs $75k-100k , 64.1% for AGIs $100k-200k , 49.1% for AGIs over 200k ) Taxable interest for individuals: $1,062 (reported on 19.7% of returns )This zip code:
$1,062Michigan:
$1,491
(% of AGI for various income ranges: 0.5% for AGIs below $25k , 0.4% for AGIs $25k-50k , 0.7% for AGIs $50k-75k , 0.5% for AGIs $75k-100k , 0.8% for AGIs $100k-200k , 1.9% for AGIs over 200k ) Ordinary dividends: $4,441 (reported on 9.9% of returns )(% of AGI for various income ranges: 0.5% for AGIs below $25k , 0.6% for AGIs $25k-50k , 1.4% for AGIs $50k-75k , 1.6% for AGIs $75k-100k , 1.9% for AGIs $100k-200k , 4.7% for AGIs over 200k ) Net capital gain/loss in AGI: +$3,538 (reported on 7.9% of returns )Here:
+$3,538State:
+$9,326
(% of AGI for various income ranges: 0.6% for AGIs $75k-100k , 0.4% for AGIs $100k-200k , 10.8% for AGIs over 200k ) Profit/loss from business: +$7,096 (reported on 17.5% of returns )Here:
+$7,096State:
+$11,523
(% of AGI for various income ranges: 13.9% for AGIs below $25k , 1.2% for AGIs $25k-50k , 0.8% for AGIs $50k-75k , 1.5% for AGIs $75k-100k , 1.6% for AGIs $100k-200k ) Taxable individual retirement arrangement distribution: $11,870 (reported on 6.6% of returns )48503:
$11,870Michigan:
$15,298
(% of AGI for various income ranges: 1.0% for AGIs below $25k , 1.6% for AGIs $25k-50k , 2.7% for AGIs $50k-75k , 3.0% for AGIs $75k-100k , 6.2% for AGIs $100k-200k ) Total itemized deductions: $16,852 (22% of AGI, reported on 17.2% of returns )Here:
$16,852State:
$21,628
Here:
22.2% of AGIState:
18.4% of AGI
(% of AGI for various income ranges: 4.5% for AGIs below $25k , 7.8% for AGIs $25k-50k , 11.1% for AGIs $50k-75k , 10.4% for AGIs $75k-100k , 12.7% for AGIs $100k-200k , 12.2% for AGIs over 200k ) Charity contributions: $4,446 (reported on 14.9% of returns )(% of AGI for various income ranges: 0.6% for AGIs below $25k , 1.8% for AGIs $25k-50k , 2.8% for AGIs $50k-75k , 2.6% for AGIs $75k-100k , 3.3% for AGIs $100k-200k , 2.2% for AGIs over 200k ) Taxes paid: $5,547 (reported on 16.8% of returns )(% of AGI for various income ranges: 0.8% for AGIs below $25k , 1.9% for AGIs $25k-50k , 3.3% for AGIs $50k-75k , 3.7% for AGIs $75k-100k , 4.9% for AGIs $100k-200k , 6.4% for AGIs over 200k ) Earned income credit: $2,548 (reported on 35.9% of returns )(% of AGI for various income ranges: 11.9% for AGIs below $25k , 1.3% for AGIs $25k-50k ) Percentage of individuals using paid preparers for their 2012 taxes: 59.4%(% for various income ranges: 56.5% for AGIs below $25k , 60.6% for AGIs $25k-50k , 65.6% for AGIs $50k-75k , 68.3% for AGIs $75k-100k , 70.3% for AGIs $100k-200k , 83.3% for AGIs over 200k )
Averages for the 2004 tax year for zip code 48503, filed in 2005:
Average Adjusted Gross Income (AGI) in 2004: $33,726 (Individual Income Tax Returns) Here:
$33,726State:
$48,204
Salary/wage: $29,899 (reported on 84.8% of returns )Here:
$29,899State:
$42,791
(% of AGI for various income ranges: 81.6% for AGIs below $10k , 67.2% for AGIs $10k-25k , 75.9% for AGIs $25k-50k , 79.4% for AGIs $50k-75k , 76.9% for AGIs $75k-100k , 73.5% for AGIs over 100k ) Taxable interest for individuals: $1,336 (reported on 32.4% of returns )This zip code:
$1,336Michigan:
$1,725
(% of AGI for various income ranges: 2.4% for AGIs below $10k , 1.5% for AGIs $10k-25k , 1.1% for AGIs $25k-50k , 1.1% for AGIs $50k-75k , 1.3% for AGIs $75k-100k , 1.3% for AGIs over 100k ) Taxable dividends: $2,797 (reported on 16.3% of returns )(% of AGI for various income ranges: 1.7% for AGIs below $10k , 0.7% for AGIs $10k-25k , 1.0% for AGIs $25k-50k , 1.0% for AGIs $50k-75k , 1.1% for AGIs $75k-100k , 2.4% for AGIs over 100k ) Net capital gain/loss: +$3,031 (reported on 11.1% of returns )Here:
+$3,031State:
+$8,532
(% of AGI for various income ranges: -1.3% for AGIs below $10k , -0.1% for AGIs $10k-25k , 0.2% for AGIs $25k-50k , 0.7% for AGIs $50k-75k , 0.6% for AGIs $75k-100k , 3.3% for AGIs over 100k ) Profit/loss from business: +$7,092 (reported on 12.8% of returns )Here:
+$7,092State:
+$9,547
(% of AGI for various income ranges: 10.1% for AGIs below $10k , 5.2% for AGIs $10k-25k , 1.2% for AGIs $25k-50k , 0.9% for AGIs $50k-75k , 1.0% for AGIs $75k-100k , 4.1% for AGIs over 100k ) IRA payment deduction: $2,250 (reported on 1.2% of returns )48503:
$2,250Michigan:
$2,875
(% of AGI for various income ranges: 0.1% for AGIs $10k-25k , 0.1% for AGIs $25k-50k , 0.1% for AGIs $50k-75k , 0.1% for AGIs over 100k ) Self-employed pension: $13,391 (reported on 0.2% of returns )Here:
$13,391Michigan:
$13,826
Total itemized deductions: $15,432 (22% of AGI, reported on 26.8% of returns )Here:
$15,432State:
$18,509
Here:
22.0% of AGIState:
20.7% of AGI
(% of AGI for various income ranges: 10.0% for AGIs below $10k , 5.5% for AGIs $10k-25k , 11.0% for AGIs $25k-50k , 13.6% for AGIs $50k-75k , 13.8% for AGIs $75k-100k , 15.6% for AGIs over 100k ) Charity contributions deductions: $3,693 (5% of AGI, reported on 24.4% of returns )Here:
5.1% of AGIState:
3.6% of AGI
(% of AGI for various income ranges: 0.6% for AGIs below $10k , 1.1% for AGIs $10k-25k , 2.1% for AGIs $25k-50k , 2.7% for AGIs $50k-75k , 3.5% for AGIs $75k-100k , 4.0% for AGIs over 100k ) Total tax: $5,136 (reported on 67.0% of returns )(% of AGI for various income ranges: 2.5% for AGIs below $10k , 3.5% for AGIs $10k-25k , 6.9% for AGIs $25k-50k , 10.3% for AGIs $50k-75k , 11.9% for AGIs $75k-100k , 17.5% for AGIs over 100k ) Earned income credit: $1,859 (reported on 27.6% of returns )Percentage of individuals using paid preparers for their 2004 taxes: 68.1%(% for various income ranges: 65.9% for AGIs below $10k , 70.1% for AGIs $10k-25k , 65.7% for AGIs $25k-50k , 69.5% for AGIs $50k-75k , 72.2% for AGIs $75k-100k , 71.6% for AGIs over 100k )
Estimated median household income in 2022: This zip code:
$35,668Michigan:
$66,986
Nearest zip codes: 48551 ,
48502 ,
48553 ,
48507 ,
48529 ,
48504 .
Flint Zip Code Map
Percentage of family households: This zip code:
36.9%Michigan:
43.3%
Percentage of households with unmarried partners: This zip code:
8.2%Michigan:
45.7%
Likely homosexual households (counted as self-reported same-sex unmarried-partner households)
Lesbian couples: 0.1% of all households Gay men: 0.3% of all households
Household received Food Stamps/SNAP in the past 12 months: 4,157Household did not receive Food Stamps/SNAP in the past 12 months: 6,005
Women who had a birth in the past 12 months: 180 (23 now married , 150 unmarried) Women who did not have a birth in the past 12 months: 5,131 (1,197 now married , 3,952 unmarried)
Housing units in zip code 48503 with a mortgage: 2,405 (110
second mortgage , 96
both second mortgage and home equity loan )
Houses without a mortgage: 35
Median monthly owner costs for units with a mortgage: $1,082
Median monthly owner costs for units without a mortgage: $498
Residents with income below the poverty level in 2022:
This zip code:
32.3%Whole state:
13.4%
Residents with income below 50% of the poverty level in 2022:
This zip code:
18.1%Whole state:
6.9%
Median number of rooms in houses and condos: Median number of rooms in apartments: Notable locations in this zip code not listed on our city pages
Click to draw/clear zip code borders Notable locations in zip code 48503: (A) , Chicago Blvd Playground (B) , Durham Natatorium (C) , Swartz Creek Golf Course (D) , Flint Station (E) , Pierce Park Golf Course (F) , City of Flint Fire Department Station 1 (G) , Fire Station Number 2 (H) , City of Flint Fire Department Station 3 (I) , Stat Emergency Medical Services (J) , Flint Police Department (K) , Sloan Museum (L) , Frances Willson Thompson Library (M) , Harding Mott University Center (N) , First Street Residence Hall (O) , Mott Library (P) , Ballenger Field House (Q) , Presidential Conference Center (R) , Presidential Residence (S) , West Flint Library (T) . Display/hide their locations on the map
Churches in zip code 48503 include: (A) , New Zion Baptist Church (B) , Mount Tabor Missionary Baptist Church (C) , Mount Zion Missionary Baptist Church (D) , Dozier Memorial Christian Methodist Episcopal Church (E) , Cornerstone Missionary Baptist Church (F) , Marantha Baptist Church (G) , New Life Church of Apostolic Faith (H) , Grace Emmanuel Baptist Church (I) . Display/hide their locations on the map
Cemeteries: (1) , Aventine Cemetery (2) , Avondale Cemetery (3) . Display/hide their locations on the map
Creeks: (A) , Thread Creek (B) , Swartz Creek (C) . Display/hide their locations on the map
Parks in zip code 48503 include: (1) , Wilson Park (2) , Woodlawn Park (3) , Charles W Nash Historical Marker (4) , Court Street United Methodist Church Historical Marker (5) , Flint Road Cart Factory Historical Marker (6) , Durant-Dort Carriage Factory Number One Historical Marker (7) , Flint Sit-Down Historical Marker (8) , Genesee County Courthouse Historical Marker (9) . Display/hide their locations on the map
Tourist attractions (not listed on the city page) : (1) , Convention & Visitors Bureau (316 Water Street) (2) , Bradley & Associates (Arcades & Amusements; 931 South Averill) (3) . Display/hide their approximate locations on the map
Year house built (houses)
27 2020 or later107 2010 to 2019363 2000 to 2009121 1990 to 1999490 1980 to 19891,506 1970 to 19791,485 1960 to 19692,433 1950 to 19591,467 1940 to 19493,481 1939 or earlier
Zip code 48503 household income distribution in 2022 1,458 Less than $10,0001,034 $10,000 to $14,999584 $15,000 to $19,999805 $20,000 to $24,999486 $25,000 to $29,999491 $30,000 to $34,999596 $35,000 to $39,999495 $40,000 to $44,999261 $45,000 to $49,999923 $50,000 to $59,999846 $60,000 to $74,999714 $75,000 to $99,999510 $100,000 to $124,999291 $125,000 to $149,999313 $150,000 to $199,999267 $200,000 or moreEstimate of home value of owner-occupied houses/condos in 2022 in zip code 48503 192 Less than $10,000161 $10,000 to $14,999181 $15,000 to $19,999124 $20,000 to $24,999190 $25,000 to $29,999133 $30,000 to $34,999160 $35,000 to $39,999336 $40,000 to $49,999396 $50,000 to $59,999419 $60,000 to $69,999281 $70,000 to $79,999267 $80,000 to $89,999144 $90,000 to $99,999347 $100,000 to $124,999261 $125,000 to $149,999302 $150,000 to $174,99977 $175,000 to $199,999178 $200,000 to $249,999140 $250,000 to $299,99969 $300,000 to $399,99938 $500,000 to $749,9995 $2,000,000 or moreRent paid by renters in 2022 in zip code 48503 64 Less than $100282 $150 to $199307 $200 to $24960 $250 to $29921 $300 to $34981 $350 to $399133 $400 to $449244 $450 to $499516 $500 to $549488 $550 to $599551 $600 to $649473 $650 to $699351 $700 to $749161 $750 to $799349 $800 to $899239 $900 to $999104 $1,000 to $1,24911 $1,250 to $1,49910 $1,500 to $1,999413 No cash rent
Median gross rent in 2022: $832.
Estimated median house (or condo) value in 2022 for: White Non-Hispanic householders: $79,535Black or African American householders: $64,466American Indian or Alaska Native householders: $84,066Asian householders: $84,973Some other race householders: $79,535Two or more races householders: $66,505Hispanic or Latino householders: $79,308Estimated median house or condo value in 2022: $73,870
48503:
$73,870Michigan:
$224,400
Lower value quartile - upper value quartile: $42,348 - $133,325
Mean price in 2022: Detached houses: $84,473Here:
$84,473State:
$280,038
Townhouses or other attached units: $113,198Here:
$113,198State:
$239,520
In 2-unit structures: $66,351Here:
$66,351State:
$219,481
In 3-to-4-unit structures: $284,151Here:
$284,151State:
$207,067
In 5-or-more-unit structures: $126,111Here:
$126,111State:
$192,733
Mobile homes: $183,291Here:
$183,291State:
$72,868
Housing units in structures:
One, detached: 8,303One, attached: 297Two: 5493 or 4: 4855 to 9: 41510 to 19: 38420 to 49: 25250 or more: 906Mobile homes: 59Unemployment : 12.3%
Means of transportation to work in zip code 48503 72.6% 5,941 Drove a car alone9.1% 741 Carpooled3.1% 256 Bus or trolley bus2.2% 182 Walked0.3% 27 Other means11.2% 913 Worked at homeTravel time to work (commute) in zip code 48503 146 Less than 5 minutes1,325 5 to 9 minutes1,704 10 to 14 minutes1,394 15 to 19 minutes735 20 to 24 minutes234 25 to 29 minutes719 30 to 34 minutes13 35 to 39 minutes131 40 to 44 minutes361 45 to 59 minutes259 60 to 89 minutes188 90 or more minutes
Neighborhoods in zip code 48503: Percentage of zip code residents living and working in this county: 88.7%
Household type by relationship:
Households: 22,836
Male householders: 4,520 (2,213 living alone ), Female householders: 5,439 (1,951 living alone )2,169 spouses (2,146 opposite-sex spouses ), 1,124 unmarried partners , (1,064 opposite-sex unmarried partners ), 6,937 children (6,480 natural , 82 adopted , 378 stepchildren ), 604 grandchildren , 238 brothers or sisters , 198 parents , 45 foster children , 353 other relatives , 787 non-relatives In group quarters: 422 (-1 institutionalized population )
Size of family households: 2,419 2-persons , 1,235 3-persons , 809 4-persons , 381 5-persons , 184 6-persons , 54 7-or-more-persons
Size of nonfamily households: 4,161 1-person , 604 2-persons , 6 3-persons , 38 4-persons , 76 5-persons
1,466 married couples with children. single-parent households (576 men , 2,343 women ).
95.3% of residents of 48503 zip code speak English at home. of residents speak Spanish at home (83% very well, 11% well, 5% not well ).of residents speak other Indo-European language at home (92% very well, 8% not well ).of residents speak Asian or Pacific Island language at home (53% very well, 47% not well ).of residents speak other language at home (52% very well, 31% well, 17% not well ).
Foreign born population: 674 (3.0%)
(72.5%
of them are naturalized citizens )
This zip code:
3.0%Whole state:
6.9%
71% United Arab Emirates 9% Lebanon 4% Malaysia 3% Nepal 2% Chile 2% Haiti 2% Cambodia 8% American 3% Arab 3% English 2% Irish 2% German 1% African 1% Italian
Year of entry for the foreign-born population
651 2010 or later 42 2000 to 2009 34 1990 to 1999 100 Before 1990
There are
148 Social Workers 136 Counselors 427 Other Medical Specialists in Zip Code 48503.
Major facilities with environmental interests located in this zip code:
EISENHOWER SCHOOL (1235 PERSHING STREET in FLINT, MI)
(Geographic Names Information System) (National Center for Education Statistics) - STATE ID-01098 Organizations: FLINT CITY SCHOOL DISTRICT (SCHOOL DISTRICT)
DOYLE/RYDER SCHOOL (1040 N. SAGINAW STREET in FLINT, MI)
(National Center for Education Statistics) - STATE ID-03129 Organizations: FLINT CITY SCHOOL DISTRICT (SCHOOL DISTRICT)
ALLEN STORAGE & MOVING (501 WEST KEARSLEY ST in FLINT, MI)
(Resource Conservation and Recovery Act (tracking hazardous waste)) Organizations: 501 WEST KEARSLEY ST PARTNERSHIP (CONTACT/OWNER)
BLEVINS SCREW PRODUCTS INC (1838 REMELL ST in FLINT, MI)
(Resource Conservation and Recovery Act (tracking hazardous waste)) Organizations: BLEVINS BRUCE (CONTACT/OPERATOR)
MI DEPT/TRANSPORTATION BRIDGE B01-25051 (M-54 OVER THREAD CREEK in FLINT, MI)
(Resource Conservation and Recovery Act (tracking hazardous waste)) Organizations: MICH DEPT OF TRANSPORTATION (CONTACT/OWNER)
Alternative names: MIDOT BRIDGE M-54 OVER THREAD CREEK
GRUENER SALES INC (1830 KELSO ST in FLINT, MI)
AIR MINOR (AIRS/AFS) Business SIC classification: ASBESTOS PRODUCTS
ESB INC (2630 S GRAND TRAVERSE in FLINT, MI)
(Resource Conservation and Recovery Act (tracking hazardous waste)) Organizations: ESB INCORPORATED (CONTACT/OPERATOR)
ACTION AUTO STORE 002 (1275 S CENTER RD in FLINT, MI)
(Resource Conservation and Recovery Act (tracking hazardous waste))
BEST IMAGES INC (2719 W COURT in FLINT, MI)
(Resource Conservation and Recovery Act (tracking hazardous waste))
BFS RETAIL & COMMERCIAL OPERATION LLC (1514 SOUTH SAGINAW in FLINT, MI)
Conditionally Exempt Small Quantity Generators, less than 100 kg/month of hazardous waste (Resource Conservation and Recovery Act (tracking hazardous waste)) Organizations: BRIDGESTONE/FIRESTONE INC (CONTACT/OWNER)
Alternative names: FIRESTONE STORE 7377
MELONIES MAGIC (3534 S SAGINAW ST in FLINT, MI)
(Resource Conservation and Recovery Act (tracking hazardous waste))
FLINT CITY OF (525 E COURT ST in FLINT, MI)
(Resource Conservation and Recovery Act (tracking hazardous waste))
FORMAX GRAPHICS INC (1846 BAGWELL ST in FLINT, MI)
(Resource Conservation and Recovery Act (tracking hazardous waste))
Housing units lacking complete plumbing facilities: 8.0%
Housing units lacking complete kitchen facilities: 6.2%
80.1% Utility gas 16.6% Electricity 1.9% Bottled, tank, or LP gas 0.9% No fuel used
Population in 1990: 33,451.
Place of birth for U.S.-born residents:
This state: 18,236Northeast: 350Midwest: 1,145South: 1,815West: 503
55% of the 48503 zip code residents lived in the same house 5 years ago.
Out of people who lived in different houses, 79% lived in this county.
Out of people who lived in different counties, 50% lived in Michigan.
88% of the 48503 zip code residents lived in the same house 1 year ago.
Out of people who lived in different houses, 72% moved from this county.
Out of people who lived in different houses, 15% moved from different county within same state.
Out of people who lived in different houses, 10% moved from different state.
Private vs. public school enrollment:
Students in private schools in grades 1 to 8 (elementary and middle school): 192
Students in private schools in grades 9 to 12 (high school): 164
Students in private undergraduate colleges: 118
Occupation by median earnings in the past 12 months ($)
106,756 Legal occupations 81,891 Architecture and engineering occupations 68,433 Management occupations 64,691 Health diagnosing and treating practitioners and other technical occupations 57,742 Business and financial operations occupations 55,410 Community and social service occupations
Companies with federal contracts located in this zip code (FLINT, MI):
TALBOT QD MOUNTS (129 N GRAND TRAVERSE; small business) employees , $0 revenue . Veteran Owned Business: $161,998 in 2 contracts in 2003
$151,998 with Army for Night Vision Equipment, Emitted and Reflected Radiation. Signed on 2003-02-05. Completion date: 2003-08-15.
with Army for Miscellaneous Weapons. Signed on 2003-09-10. Completion date: 2004-10-25.
SCHOOL DISTRICT OF THE CITY OF (923 E KEARSLEY ST) in 2 contracts in 2004
$12,000 with U.S. Army Corps of Engineers - civil program financing only for Other Education and Training Services. Signed on 2004-10-19. Completion date: 2004-10-22.
with Army for Other Education and Training Services. Signed on 2004-10-19. Completion date: 2004-10-22.
SEYMORE & SON LANDSCAPING & YA (1818 VALLEY LANE; small business) in 3 contracts from 2003 to 2004
$8,196 with Army for Landscaping/Groundskeeping Services. Signed on 2004-03-22. Completion date: 2004-03-31.
, same as above. Signed on 2003-03-14. Completion date: 2004-03-31.
, same as above. Signed on 2003-03-14. Completion date: 2004-03-31.
BLEVINS SCREW PRODUCTS INC (1838 REMELL ST; small business) in 2 contracts in 2006
$5,255 with Defense Logistics Agency for Nuts and Washers. Signed on 2006-05-11. Completion date: 2006-09-27.
, same as above. Signed on 2006-02-09. Completion date: 2006-06-10.
Top industries in this zip code by the number of employees in 2005:
Health Care and Social Assistance: General Medical and Surgical Hospitals (over 1000 employees: 2 establishments)Administrative and Support and Waste Management and Remediation Services: Employment Placement Agencies (500-999: 1, 1-4: 1)Accommodation and Food Services: Full-Service Restaurants (100-249: 1, 50-99: 1, 20-49: 2, 10-19: 3, 5-9: 3, 1-4: 5)Other Services (except Public Administration): Religious Organizations (20-49: 3, 10-19: 2, 5-9: 8, 1-4: 9)Health Care and Social Assistance: Offices of Physicians (except Mental Health Specialists) (20-49: 3, 10-19: 3, 5-9: 5, 1-4: 11)Arts, Entertainment, and Recreation: Museums (100-249: 1, 20-49: 1, 1-4: 1)Accommodation and Food Services: Limited-Service Restaurants (20-49: 3, 10-19: 4, 5-9: 2, 1-4: 5)Wholesale Trade: Other Grocery and Related Products Merchant Wholesalers (100-249: 1, 1-4: 1)
People in group quarters in 2010:
354 people in college/university student housing
123 people in group homes intended for adults
114 people in emergency and transitional shelters (with sleeping facilities) for people experiencing homelessness
60 people in other noninstitutional facilities
34 people in correctional residential facilities
30 people in residential treatment centers for juveniles (non-correctional)
19 people in workers' group living quarters and job corps centers
18 people in residential treatment centers for adults
People in group quarters in 2000:
306 people in other noninstitutional group quarters
88 people in nursing homes
84 people in other group homes
63 people in homes or halfway houses for drug/alcohol abuse
55 people in institutions for the deaf
35 people in homes for the mentally ill
24 people in homes for abused, dependent, and neglected children
19 people in homes for the physically handicapped
15 people in agriculture workers' dormitories on farms
11 people in homes for the mentally retarded
3 people in schools, hospitals, or wards for the intellectually disabled
Fatal accident statistics in 2014:
Fatal accident count: 3Vehicles involved in fatal accidents: 5Fatal accidents caused by drunken drivers: 0Fatalities: 3Persons involved in fatal accidents: 6Pedestrians involved in fatal accidents: 1
Fatal accident statistics in 2012:
Fatal accident count: 2Vehicles involved in fatal accidents: 2Fatal accidents caused by drunken drivers: 1Fatalities: 2Persons involved in fatal accidents: 3Pedestrians involved in fatal accidents: 1
Home Mortgage Disclosure Act Aggregated Statistics For Year 2009(Based on 9 full and 18 partial tracts) A) FHA, FSA/RHS & VA B) Conventional C) Refinancings D) Home Improvement Loans E) Loans on Dwellings For 5+ Families F) Non-occupant Loans on G) Loans On Manufactured Number Average Value Number Average Value Number Average Value Number Average Value Number Average Value Number Average Value Number Average Value
LOANS ORIGINATED 108 $64,295 35 $52,497 169 $82,521 21 $7,342 1 $402,000 24 $57,943 0 $0 APPLICATIONS APPROVED, NOT ACCEPTED 8 $44,005 10 $30,393 21 $80,573 3 $10,220 0 $0 6 $22,208 0 $0 APPLICATIONS DENIED 36 $48,040 22 $49,380 149 $75,630 90 $21,402 0 $0 32 $58,456 5 $36,920 APPLICATIONS WITHDRAWN 30 $57,852 9 $42,219 72 $65,447 1 $7,980 0 $0 10 $35,564 0 $0 FILES CLOSED FOR INCOMPLETENESS 4 $31,620 1 $3,600 19 $78,655 2 $22,690 1 $675,000 2 $42,010 0 $0
Aggregated Statistics For Year 2008(Based on 9 full and 18 partial tracts) A) FHA, FSA/RHS & VA B) Conventional C) Refinancings D) Home Improvement Loans E) Loans on Dwellings For 5+ Families F) Non-occupant Loans on G) Loans On Manufactured Number Average Value Number Average Value Number Average Value Number Average Value Number Average Value Number Average Value Number Average Value
LOANS ORIGINATED 142 $64,619 76 $66,373 209 $64,824 66 $18,276 2 $501,875 59 $38,044 0 $0 APPLICATIONS APPROVED, NOT ACCEPTED 6 $44,073 10 $70,913 66 $56,042 6 $22,707 0 $0 17 $45,494 0 $0 APPLICATIONS DENIED 35 $61,535 82 $64,651 411 $80,643 157 $30,590 4 $997,425 83 $47,357 12 $31,428 APPLICATIONS WITHDRAWN 21 $57,395 19 $71,228 104 $77,899 11 $44,537 3 $1,866,667 20 $48,665 0 $0 FILES CLOSED FOR INCOMPLETENESS 1 $74,400 8 $49,898 26 $83,693 7 $35,631 0 $0 5 $33,668 0 $0
Aggregated Statistics For Year 2007(Based on 9 full and 18 partial tracts) A) FHA, FSA/RHS & VA B) Conventional C) Refinancings D) Home Improvement Loans E) Loans on Dwellings For 5+ Families F) Non-occupant Loans on G) Loans On Manufactured Number Average Value Number Average Value Number Average Value Number Average Value Number Average Value Number Average Value Number Average Value
LOANS ORIGINATED 101 $71,654 286 $62,182 458 $67,859 110 $21,636 4 $727,380 161 $44,612 2 $9,710 APPLICATIONS APPROVED, NOT ACCEPTED 3 $53,213 71 $63,495 148 $68,077 15 $72,517 0 $0 31 $45,466 1 $12,290 APPLICATIONS DENIED 26 $65,882 242 $68,391 734 $79,702 239 $37,688 0 $0 197 $55,705 9 $38,460 APPLICATIONS WITHDRAWN 18 $73,928 50 $61,484 208 $79,080 24 $60,703 0 $0 34 $46,533 0 $0 FILES CLOSED FOR INCOMPLETENESS 0 $0 27 $63,663 36 $100,639 6 $22,990 0 $0 7 $68,284 0 $0
Aggregated Statistics For Year 2006(Based on 9 full and 18 partial tracts) A) FHA, FSA/RHS & VA B) Conventional C) Refinancings D) Home Improvement Loans E) Loans on Dwellings For 5+ Families F) Non-occupant Loans on G) Loans On Manufactured Number Average Value Number Average Value Number Average Value Number Average Value Number Average Value Number Average Value Number Average Value
LOANS ORIGINATED 93 $69,187 592 $65,855 696 $63,717 147 $27,119 2 $387,500 304 $48,780 4 $46,192 APPLICATIONS APPROVED, NOT ACCEPTED 3 $55,367 162 $58,904 206 $78,362 22 $41,569 0 $0 82 $57,236 1 $23,330 APPLICATIONS DENIED 12 $65,906 422 $63,452 1,007 $85,117 277 $70,660 4 $267,765 300 $50,536 11 $26,625 APPLICATIONS WITHDRAWN 14 $61,464 115 $63,745 421 $84,601 32 $53,621 0 $0 68 $53,067 0 $0 FILES CLOSED FOR INCOMPLETENESS 2 $81,210 35 $80,397 119 $80,892 2 $12,515 0 $0 19 $71,142 0 $0
Aggregated Statistics For Year 2005(Based on 9 full and 18 partial tracts) A) FHA, FSA/RHS & VA B) Conventional C) Refinancings D) Home Improvement Loans E) Loans on Dwellings For 5+ Families F) Non-occupant Loans on G) Loans On Manufactured Number Average Value Number Average Value Number Average Value Number Average Value Number Average Value Number Average Value Number Average Value
LOANS ORIGINATED 124 $76,583 755 $72,106 873 $68,898 203 $31,673 5 $676,124 297 $54,905 2 $55,855 APPLICATIONS APPROVED, NOT ACCEPTED 4 $75,400 152 $67,351 281 $72,764 35 $23,081 0 $0 71 $51,523 5 $36,452 APPLICATIONS DENIED 11 $92,282 396 $71,107 1,139 $79,347 274 $28,024 1 $1,240,000 204 $58,051 13 $32,672 APPLICATIONS WITHDRAWN 14 $85,366 160 $131,017 530 $80,327 53 $91,112 0 $0 73 $59,371 1 $79,820 FILES CLOSED FOR INCOMPLETENESS 5 $134,564 54 $94,147 222 $84,178 6 $32,015 0 $0 11 $65,759 0 $0
Aggregated Statistics For Year 2004(Based on 9 full and 18 partial tracts) A) FHA, FSA/RHS & VA B) Conventional C) Refinancings D) Home Improvement Loans E) Loans on Dwellings For 5+ Families F) Non-occupant Loans on G) Loans On Manufactured Number Average Value Number Average Value Number Average Value Number Average Value Number Average Value Number Average Value Number Average Value
LOANS ORIGINATED 164 $75,832 598 $69,225 1,109 $66,395 223 $22,678 4 $488,025 284 $46,138 11 $71,720 APPLICATIONS APPROVED, NOT ACCEPTED 9 $80,556 137 $70,157 284 $76,636 36 $32,808 0 $0 62 $53,600 3 $60,813 APPLICATIONS DENIED 30 $74,624 276 $78,711 1,072 $69,088 269 $22,337 1 $1,230,000 166 $51,641 12 $26,380 APPLICATIONS WITHDRAWN 14 $71,365 82 $73,499 524 $78,041 45 $54,060 0 $0 43 $52,159 0 $0 FILES CLOSED FOR INCOMPLETENESS 9 $80,304 57 $94,088 237 $76,417 9 $45,824 0 $0 13 $71,046 2 $38,905
Aggregated Statistics For Year 2003(Based on 9 full and 18 partial tracts) A) FHA, FSA/RHS & VA B) Conventional C) Refinancings D) Home Improvement Loans E) Loans on Dwellings For 5+ Families F) Non-occupant Loans on Number Average Value Number Average Value Number Average Value Number Average Value Number Average Value Number Average Value
LOANS ORIGINATED 222 $72,133 452 $69,793 1,815 $71,833 151 $17,884 5 $400,340 250 $46,835 APPLICATIONS APPROVED, NOT ACCEPTED 11 $64,745 104 $81,755 323 $74,121 47 $13,206 0 $0 53 $49,577 APPLICATIONS DENIED 46 $65,631 198 $60,017 1,020 $65,759 229 $15,072 1 $68,000 193 $41,729 APPLICATIONS WITHDRAWN 18 $82,778 74 $68,753 496 $69,002 9 $18,427 2 $269,420 45 $51,688 FILES CLOSED FOR INCOMPLETENESS 17 $73,152 36 $88,894 150 $75,237 8 $36,036 0 $0 12 $46,585
Aggregated Statistics For Year 2002(Based on 9 full and 18 partial tracts) A) FHA, FSA/RHS & VA B) Conventional C) Refinancings D) Home Improvement Loans E) Loans on Dwellings For 5+ Families F) Non-occupant Loans on Number Average Value Number Average Value Number Average Value Number Average Value Number Average Value Number Average Value
LOANS ORIGINATED 258 $68,884 400 $72,051 1,375 $67,038 196 $17,424 3 $286,157 209 $44,203 APPLICATIONS APPROVED, NOT ACCEPTED 4 $62,662 69 $72,012 301 $60,485 44 $15,776 0 $0 45 $40,919 APPLICATIONS DENIED 33 $79,515 130 $53,513 799 $59,770 221 $11,756 1 $52,000 86 $36,383 APPLICATIONS WITHDRAWN 24 $81,727 52 $80,708 599 $66,362 24 $38,540 2 $48,555 39 $40,494 FILES CLOSED FOR INCOMPLETENESS 10 $74,347 22 $49,214 132 $64,176 1 $63,920 0 $0 10 $42,037
Aggregated Statistics For Year 2001(Based on 9 full and 18 partial tracts) A) FHA, FSA/RHS & VA B) Conventional C) Refinancings D) Home Improvement Loans E) Loans on Dwellings For 5+ Families F) Non-occupant Loans on Number Average Value Number Average Value Number Average Value Number Average Value Number Average Value Number Average Value
LOANS ORIGINATED 287 $70,380 417 $78,270 1,272 $60,210 248 $11,788 1 $430,220 192 $42,212 APPLICATIONS APPROVED, NOT ACCEPTED 8 $103,418 70 $72,734 251 $53,693 57 $19,929 4 $127,838 36 $54,211 APPLICATIONS DENIED 19 $73,719 165 $60,388 813 $52,433 295 $15,786 1 $176,000 86 $40,963 APPLICATIONS WITHDRAWN 16 $64,389 48 $72,697 488 $61,250 35 $20,858 1 $220,000 23 $39,738 FILES CLOSED FOR INCOMPLETENESS 1 $42,000 5 $92,100 121 $64,233 7 $16,074 1 $206,000 8 $34,688
Aggregated Statistics For Year 2000(Based on 9 full and 18 partial tracts) A) FHA, FSA/RHS & VA B) Conventional C) Refinancings D) Home Improvement Loans E) Loans on Dwellings For 5+ Families F) Non-occupant Loans on Number Average Value Number Average Value Number Average Value Number Average Value Number Average Value Number Average Value
LOANS ORIGINATED 290 $62,854 388 $65,027 669 $46,297 263 $12,105 5 $381,706 144 $31,072 APPLICATIONS APPROVED, NOT ACCEPTED 9 $73,424 55 $52,543 222 $45,909 80 $18,185 0 $0 39 $28,780 APPLICATIONS DENIED 21 $55,588 173 $49,221 610 $47,447 371 $10,882 0 $0 87 $33,369 APPLICATIONS WITHDRAWN 24 $56,394 74 $47,636 386 $46,352 31 $20,713 0 $0 36 $33,388 FILES CLOSED FOR INCOMPLETENESS 4 $55,518 12 $42,987 147 $55,194 3 $44,980 0 $0 10 $30,401
Aggregated Statistics For Year 1999(Based on 5 full and 9 partial tracts) A) FHA, FSA/RHS & VA B) Conventional C) Refinancings D) Home Improvement Loans E) Loans on Dwellings For 5+ Families F) Non-occupant Loans on Number Average Value Number Average Value Number Average Value Number Average Value Number Average Value Number Average Value
LOANS ORIGINATED 156 $62,542 209 $66,679 536 $56,818 175 $12,655 1 $99,760 80 $34,114 APPLICATIONS APPROVED, NOT ACCEPTED 6 $48,935 41 $66,827 178 $48,416 40 $12,932 1 $315,000 30 $45,582 APPLICATIONS DENIED 9 $48,281 116 $52,366 329 $43,946 177 $11,925 1 $52,960 37 $42,258 APPLICATIONS WITHDRAWN 15 $68,883 41 $50,454 240 $47,527 18 $29,166 0 $0 22 $35,327 FILES CLOSED FOR INCOMPLETENESS 3 $66,943 6 $47,892 78 $43,575 1 $30,250 0 $0 5 $28,618
Private Mortgage Insurance Companies Aggregated Statistics For Year 2009(Based on 3 full and 8 partial tracts) A) Conventional B) Refinancings C) Non-occupant Loans on Number Average Value Number Average Value Number Average Value
LOANS ORIGINATED 4 $53,838 1 $62,000 1 $22,200 APPLICATIONS APPROVED, NOT ACCEPTED 4 $50,400 3 $69,660 2 $71,800 APPLICATIONS DENIED 1 $104,490 1 $56,000 0 $0 APPLICATIONS WITHDRAWN 0 $0 0 $0 0 $0 FILES CLOSED FOR INCOMPLETENESS 0 $0 0 $0 0 $0
Aggregated Statistics For Year 2008(Based on 7 full and 18 partial tracts) A) Conventional B) Refinancings C) Non-occupant Loans on Number Average Value Number Average Value Number Average Value
LOANS ORIGINATED 42 $63,681 13 $72,651 8 $31,154 APPLICATIONS APPROVED, NOT ACCEPTED 25 $81,138 22 $72,215 15 $63,721 APPLICATIONS DENIED 1 $61,200 6 $68,775 5 $66,360 APPLICATIONS WITHDRAWN 4 $49,788 3 $61,850 0 $0 FILES CLOSED FOR INCOMPLETENESS 7 $62,260 0 $0 2 $16,610
Aggregated Statistics For Year 2007(Based on 9 full and 18 partial tracts) A) Conventional B) Refinancings C) Non-occupant Loans on Number Average Value Number Average Value Number Average Value
LOANS ORIGINATED 124 $67,287 55 $86,105 21 $46,151 APPLICATIONS APPROVED, NOT ACCEPTED 35 $66,381 21 $98,747 13 $54,298 APPLICATIONS DENIED 6 $122,803 6 $105,192 2 $128,400 APPLICATIONS WITHDRAWN 4 $85,778 9 $68,446 1 $47,400 FILES CLOSED FOR INCOMPLETENESS 1 $28,800 1 $146,270 0 $0
Aggregated Statistics For Year 2006(Based on 9 full and 18 partial tracts) A) Conventional B) Refinancings C) Non-occupant Loans on Number Average Value Number Average Value Number Average Value
LOANS ORIGINATED 134 $80,625 53 $83,788 32 $57,335 APPLICATIONS APPROVED, NOT ACCEPTED 39 $81,405 18 $79,112 15 $48,912 APPLICATIONS DENIED 5 $89,668 0 $0 3 $50,300 APPLICATIONS WITHDRAWN 9 $105,251 3 $72,887 4 $105,912 FILES CLOSED FOR INCOMPLETENESS 1 $29,750 1 $92,000 1 $92,000
Aggregated Statistics For Year 2005(Based on 9 full and 18 partial tracts) A) Conventional B) Refinancings C) Non-occupant Loans on Number Average Value Number Average Value Number Average Value
LOANS ORIGINATED 164 $74,962 48 $75,759 43 $47,081 APPLICATIONS APPROVED, NOT ACCEPTED 18 $68,353 28 $76,898 8 $57,420 APPLICATIONS DENIED 1 $25,750 0 $0 1 $25,750 APPLICATIONS WITHDRAWN 18 $87,799 10 $75,718 4 $48,075 FILES CLOSED FOR INCOMPLETENESS 4 $57,665 2 $145,200 1 $28,800
Aggregated Statistics For Year 2004(Based on 9 full and 18 partial tracts) A) Conventional B) Refinancings C) Non-occupant Loans on Number Average Value Number Average Value Number Average Value
LOANS ORIGINATED 155 $76,820 90 $79,366 42 $41,164 APPLICATIONS APPROVED, NOT ACCEPTED 34 $72,965 52 $77,252 11 $48,456 APPLICATIONS DENIED 5 $53,568 1 $35,400 2 $31,920 APPLICATIONS WITHDRAWN 8 $78,248 16 $86,747 1 $160,000 FILES CLOSED FOR INCOMPLETENESS 3 $76,157 2 $53,840 1 $23,940
Aggregated Statistics For Year 2003(Based on 9 full and 18 partial tracts) A) Conventional B) Refinancings C) Non-occupant Loans on Number Average Value Number Average Value Number Average Value
LOANS ORIGINATED 181 $76,390 203 $90,534 41 $53,633 APPLICATIONS APPROVED, NOT ACCEPTED 19 $84,179 53 $83,295 7 $66,041 APPLICATIONS DENIED 2 $65,500 5 $68,400 0 $0 APPLICATIONS WITHDRAWN 7 $79,613 10 $62,602 1 $36,600 FILES CLOSED FOR INCOMPLETENESS 0 $0 3 $76,023 2 $55,035
Aggregated Statistics For Year 2002(Based on 9 full and 18 partial tracts) A) Conventional B) Refinancings C) Non-occupant Loans on Number Average Value Number Average Value Number Average Value
LOANS ORIGINATED 172 $74,623 140 $84,643 53 $45,086 APPLICATIONS APPROVED, NOT ACCEPTED 26 $91,123 43 $93,670 12 $50,764 APPLICATIONS DENIED 7 $75,500 11 $64,904 6 $56,157 APPLICATIONS WITHDRAWN 8 $119,240 8 $92,469 2 $93,000 FILES CLOSED FOR INCOMPLETENESS 0 $0 0 $0 0 $0
Aggregated Statistics For Year 2001(Based on 9 full and 18 partial tracts) A) Conventional B) Refinancings C) Non-occupant Loans on Number Average Value Number Average Value Number Average Value
LOANS ORIGINATED 214 $88,109 148 $76,215 37 $47,207 APPLICATIONS APPROVED, NOT ACCEPTED 31 $92,457 32 $72,441 11 $76,236 APPLICATIONS DENIED 11 $70,845 8 $126,888 6 $98,882 APPLICATIONS WITHDRAWN 8 $62,035 5 $90,674 2 $47,875 FILES CLOSED FOR INCOMPLETENESS 4 $116,262 1 $21,770 1 $21,770
Aggregated Statistics For Year 2000(Based on 9 full and 16 partial tracts) A) Conventional B) Refinancings C) Non-occupant Loans on Number Average Value Number Average Value Number Average Value
LOANS ORIGINATED 159 $67,625 70 $70,375 40 $34,485 APPLICATIONS APPROVED, NOT ACCEPTED 18 $72,864 7 $52,489 5 $40,864 APPLICATIONS DENIED 7 $60,511 3 $118,600 2 $26,845 APPLICATIONS WITHDRAWN 3 $85,637 1 $27,570 1 $27,570 FILES CLOSED FOR INCOMPLETENESS 0 $0 0 $0 0 $0
Aggregated Statistics For Year 1999(Based on 5 full and 8 partial tracts) A) Conventional B) Refinancings C) Non-occupant Loans on Number Average Value Number Average Value Number Average Value
LOANS ORIGINATED 103 $71,943 41 $66,950 17 $37,725 APPLICATIONS APPROVED, NOT ACCEPTED 6 $92,218 5 $60,874 2 $26,525 APPLICATIONS DENIED 4 $51,030 2 $215,800 2 $32,010 APPLICATIONS WITHDRAWN 0 $0 0 $0 0 $0 FILES CLOSED FOR INCOMPLETENESS 0 $0 0 $0 0 $0
2003 - 2018 National Fire Incident Reporting System (NFIRS) incidents See full 2006 National Fire Incident Reporting System statistics for zip code 48503, Michigan
Most common first names in zip code 48503 among deceased individuals Name Count Lived (average)
John 297 73.0 years William 291 72.7 years Mary 287 77.5 years James 248 71.0 years Robert 187 68.3 years Charles 184 73.0 years George 140 74.3 years Helen 126 79.4 years Dorothy 118 76.7 years Joseph 116 73.5 years
Most common last names in zip code 48503 among deceased individuals Last name Count Lived (average)
Smith 158 75.1 years Williams 133 74.5 years Johnson 125 71.7 years Jones 102 72.9 years Brown 93 72.2 years Miller 68 71.0 years White 59 69.7 years Wilson 54 77.1 years Wright 52 71.7 years Taylor 51 75.9 years
Businesses in zip code 48503
Name Count Name Count
Blockbuster 2 Old Navy 1 Church's Chicken 1 Rite Aid 1 FedEx 2 Subway 1 GameStop 1 T-Mobile 1 H&R Block 1 T.J.Maxx 1 Holiday Inn 1 Taco Bell 1 KFC 1 Target 1 Little Caesars Pizza 1 U-Haul 1 New Balance 1 YMCA 1 Nike 1

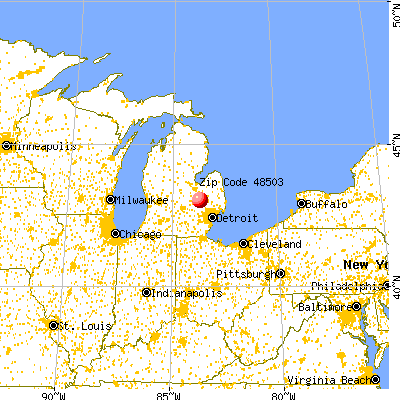


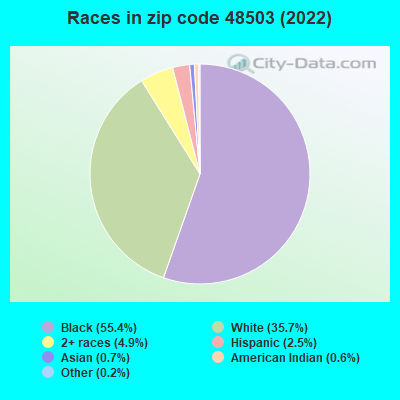


 Nearest zip codes: 48551, 48502, 48553, 48507, 48529, 48504.
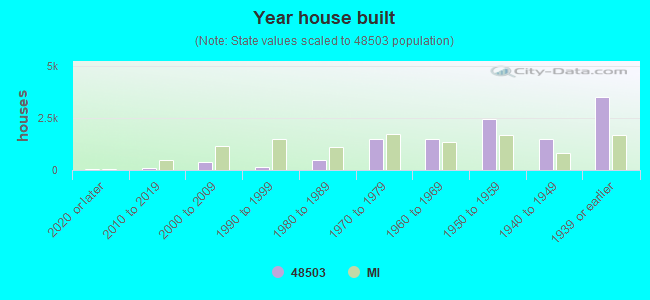

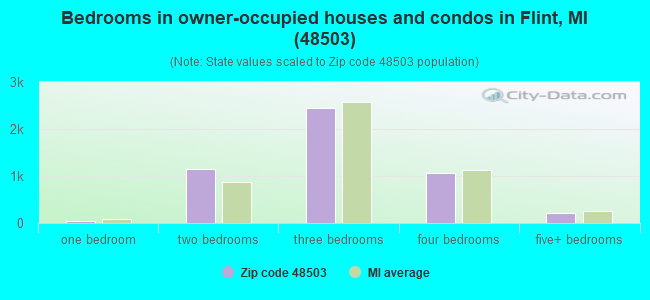
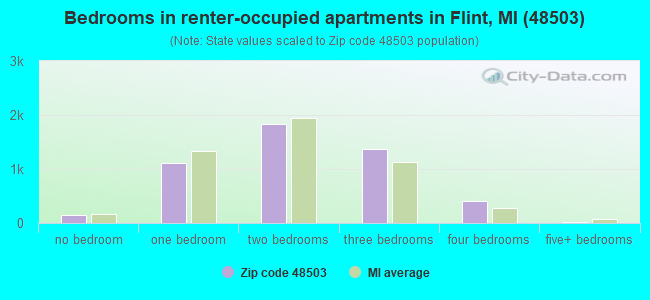
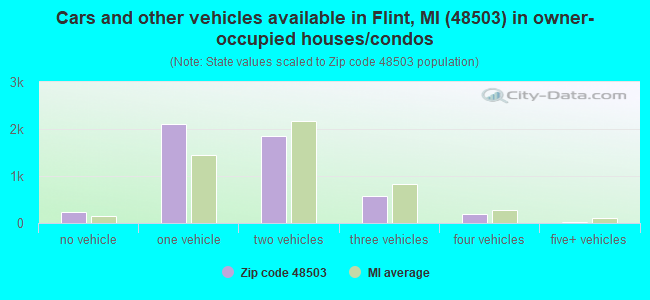
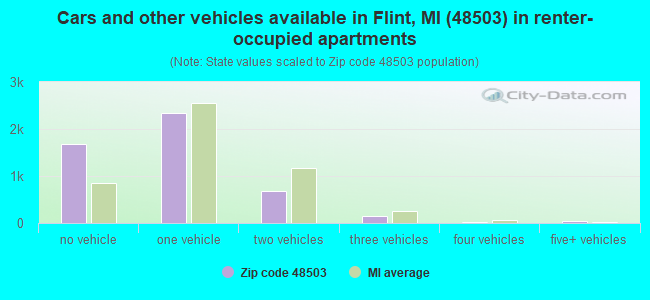


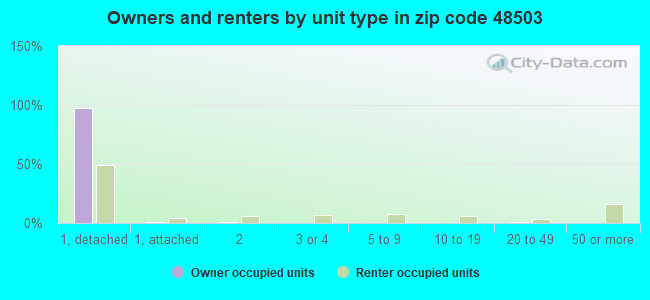
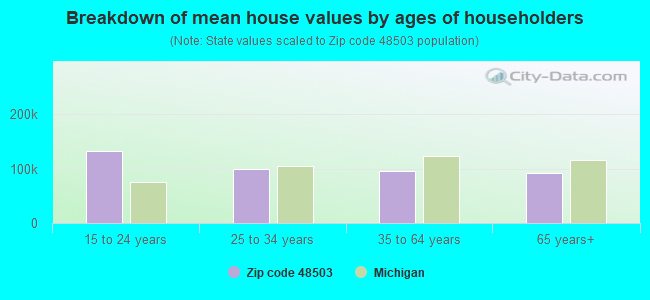


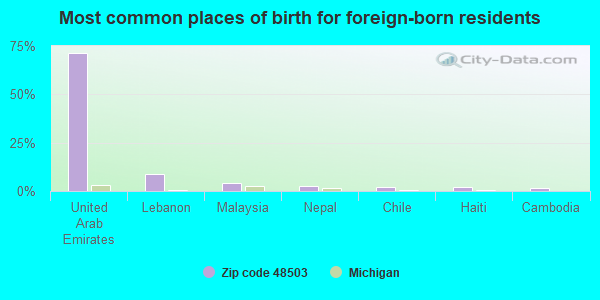
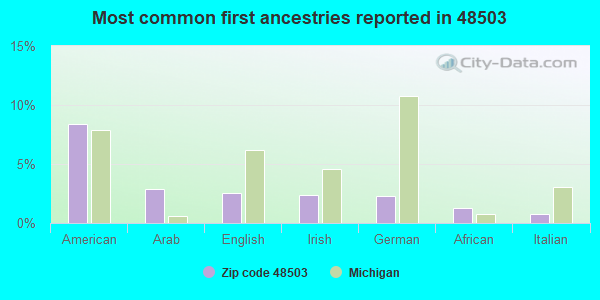
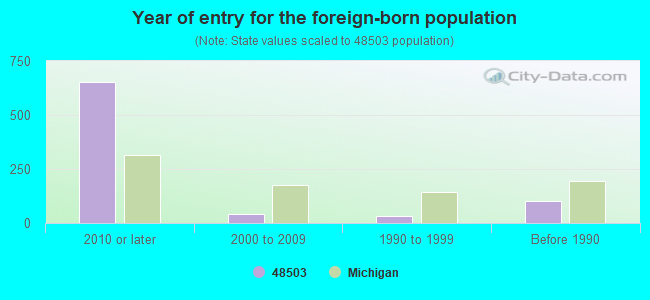


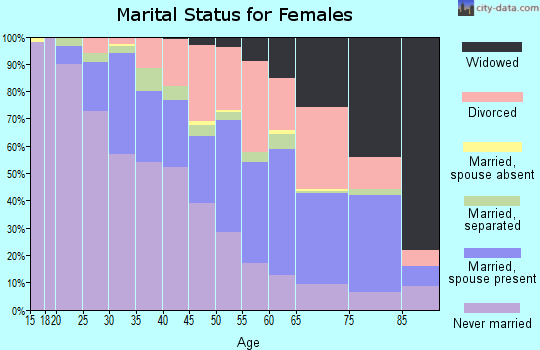
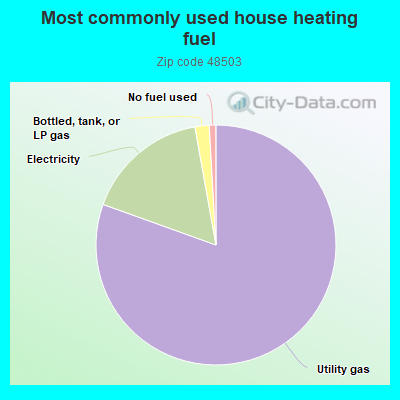
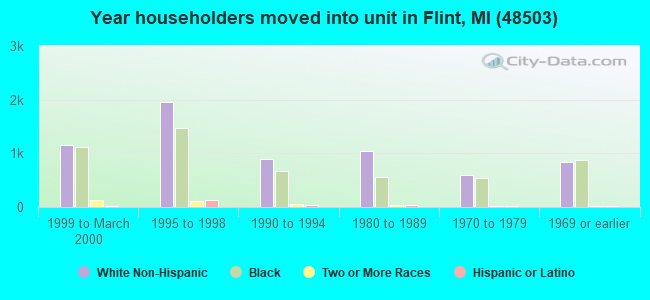
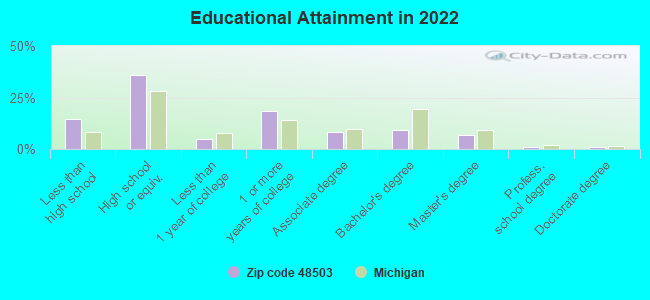
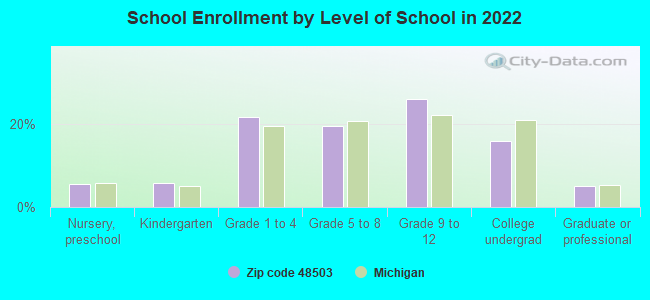
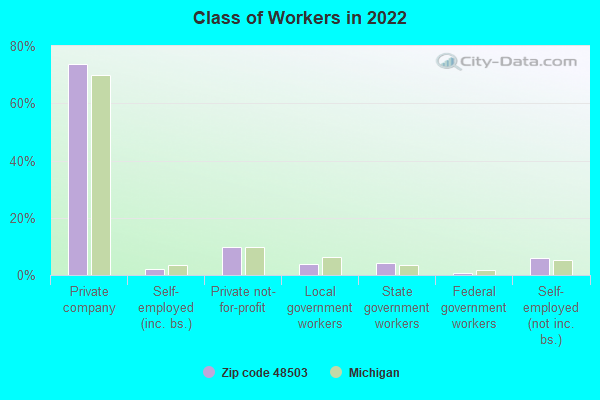
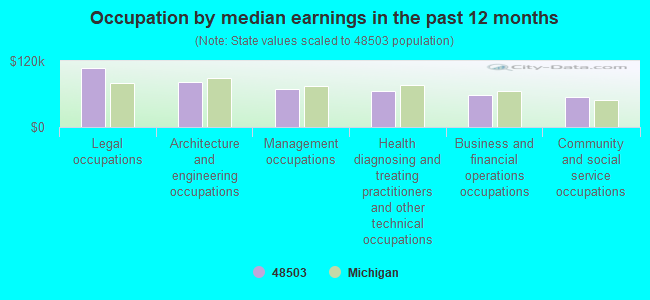
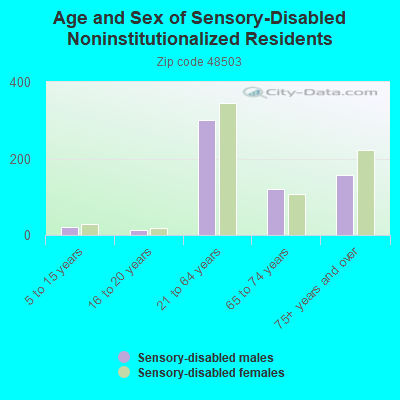
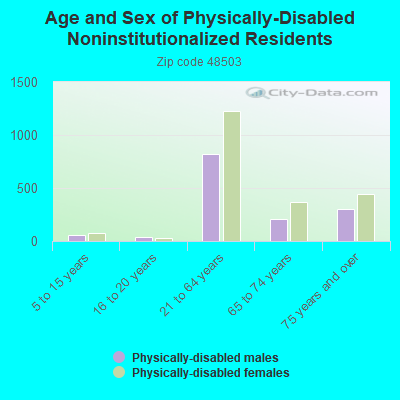
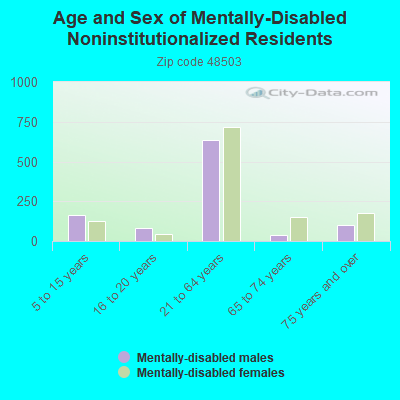
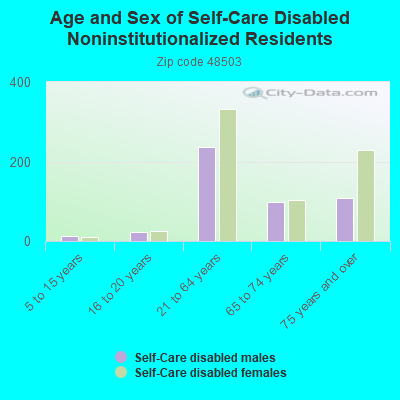
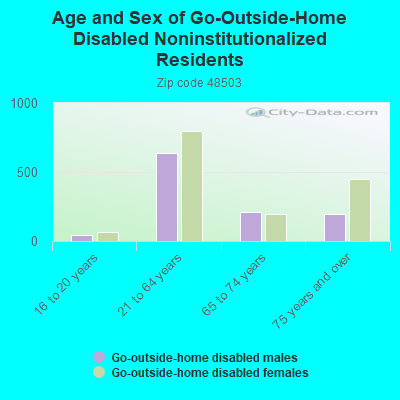
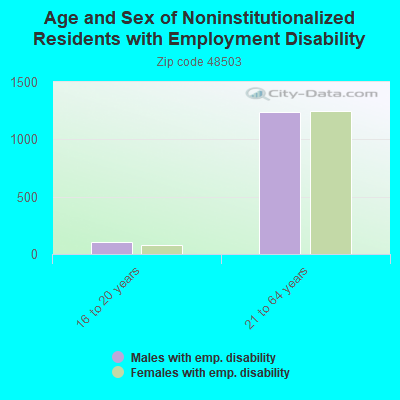
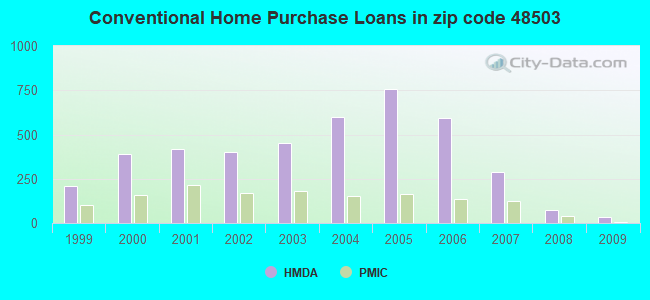
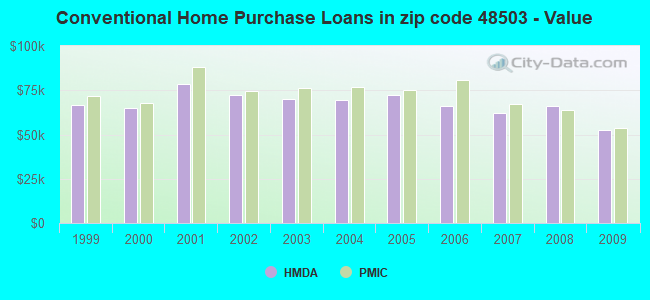
 Based on the data from the years 2003 - 2018 the average number of fire incidents per year is 93. The highest number of fires - 254 took place in 2003, and the least - 1 in 2005. The data has a dropping trend.
 When looking into fire subcategories, the most reports belonged to: Structure Fires (55.7%), and Outside Fires (18.1%).