Estimated zip code population in 2022: 21,068 Zip code population in 2010: 22,127 Zip code population in 2000: 22,869
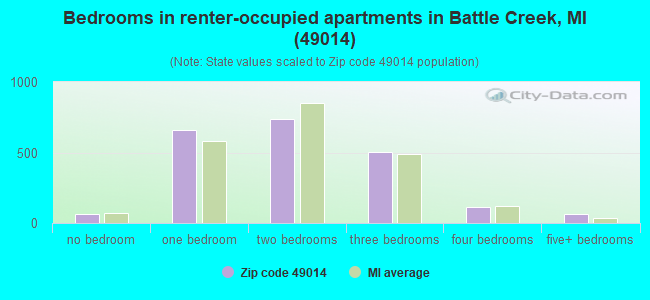
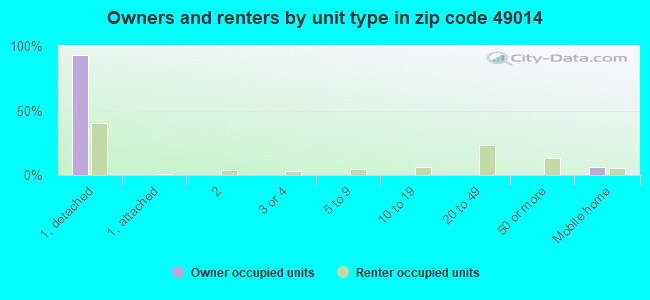
Houses and condos: 9,316 Renter-occupied apartments: 2,137
% of renters here:
26%
State:
27%
March 2022 cost of living index in zip code 49014: 82.4 (low, U.S. average is 100)
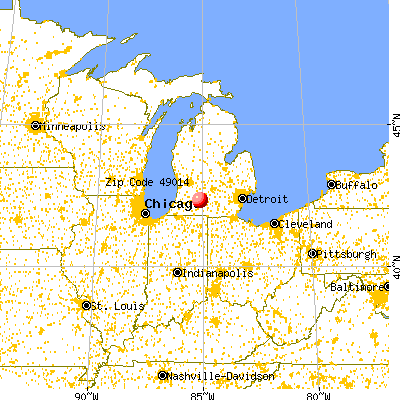
Land area: 75.6 sq. mi. Water area: 1.3 sq. mi.
Population density: 279 people per square mile
(very low).
OSM Map
General Map
Google Map
MSN Map
OSM Map
General Map
Google Map
MSN Map
OSM Map
General Map
Google Map
MSN Map
OSM Map
General Map
Google Map
MSN Map
Please wait while loading the map...
Real estate property taxes paid for housing units in 2022:
This zip code:
1.5% ($2,444)
Michigan:
1.2% ($2,746)
Median real estate property taxes paid for housing units with mortgages in 2022: $2,609 (1.5%) Median real estate property taxes paid for housing units with no mortgage in 2022: $2,134 (1.8%)
Averages for the 2020 tax year for zip code 49014, filed in 2021:
Average Adjusted Gross Income (AGI) in 2020: $54,027 (Individual Income Tax Returns)
Here:
$54,027
State:
$68,945
Salary/wage: $47,774 (reported on 79.1% of returns)
Here:
$47,774
State:
$57,142
(% of AGI for various income ranges: 996.8% for AGIs below $25k, 3258.1% for AGIs $25k-50k, 6047.5% for AGIs $50k-75k, 8536.5% for AGIs $75k-100k, 16221.1% for AGIs $100k-200k, 63670.0% for AGIs over 200k)
Taxable interest for individuals: $1,010 (reported on 27.7% of returns)
This zip code:
$1,010
Michigan:
$1,630
(% of AGI for various income ranges: 10.6% for AGIs below $25k, 16.4% for AGIs $25k-50k, 42.5% for AGIs $50k-75k, 69.8% for AGIs $75k-100k, 93.9% for AGIs $100k-200k, 913.3% for AGIs over 200k)
Ordinary dividends: $4,792 (reported on 14.9% of returns)
Here:
$4,792
State:
$6,972
(% of AGI for various income ranges: 21.2% for AGIs below $25k, 28.2% for AGIs $25k-50k, 73.6% for AGIs $50k-75k, 169.4% for AGIs $75k-100k, 226.3% for AGIs $100k-200k, 3921.7% for AGIs over 200k)
Net capital gain/loss in AGI: +$6,102 (reported on 12.5% of returns)
Here:
+$6,102
State:
+$20,064
(% of AGI for various income ranges: 5.4% for AGIs below $25k, 31.9% for AGIs $25k-50k, 39.6% for AGIs $50k-75k, 115.6% for AGIs $75k-100k, 340.0% for AGIs $100k-200k, 4875.0% for AGIs over 200k)
Profit/loss from business: +$9,258 (reported on 10.8% of returns)
Here:
+$9,258
State:
+$11,172
(% of AGI for various income ranges: 63.6% for AGIs below $25k, 70.1% for AGIs $25k-50k, 92.9% for AGIs $50k-75k, 176.6% for AGIs $75k-100k, 360.1% for AGIs $100k-200k, 3241.7% for AGIs over 200k)
Taxable individual retirement arrangement distribution: $18,514 (reported on 9.6% of returns)
49014:
$18,514
Michigan:
$19,803
(% of AGI for various income ranges: 52.7% for AGIs below $25k, 93.1% for AGIs $25k-50k, 226.4% for AGIs $50k-75k, 457.4% for AGIs $75k-100k, 852.4% for AGIs $100k-200k, 4181.7% for AGIs over 200k)
Total itemized deductions: $30,365 (reported on 3.5% of returns)
Here:
$30,365
State:
$34,117
(% of AGI for various income ranges: 17.7% for AGIs below $25k, 50.7% for AGIs $25k-50k, 121.9% for AGIs $50k-75k, 292.1% for AGIs $75k-100k, 445.3% for AGIs $100k-200k, 3966.7% for AGIs over 200k)
Charity contributions: $11,154 (reported on 2.7% of returns)
Here:
$11,154
State:
$13,548
(% of AGI for various income ranges: 10.5% for AGIs $25k-50k, 23.3% for AGIs $50k-75k, 79.7% for AGIs $75k-100k, 138.8% for AGIs $100k-200k, 1490.0% for AGIs over 200k)
Taxes paid: $7,318 (reported on 3.5% of returns)
49014:
$7,318
State:
$7,972
(% of AGI for various income ranges: 8.9% for AGIs $25k-50k, 31.3% for AGIs $50k-75k, 79.7% for AGIs $75k-100k, 134.2% for AGIs $100k-200k, 785.0% for AGIs over 200k)
Earned income credit: $2,327 (reported on 17.8% of returns)
Here:
$2,327
State:
$2,251
(% of AGI for various income ranges: 94.8% for AGIs below $25k, 76.2% for AGIs $25k-50k, 1.3% for AGIs $50k-75k)
Percentage of individuals using paid preparers for their 2020 taxes: 93.5%
Here:
93%
State:
93%
(% for various income ranges: 93.3% for AGIs below $25k, 94.1% for AGIs $25k-50k, 92.6% for AGIs $50k-75k, 94.3% for AGIs $75k-100k, 92.8% for AGIs $100k-200k, 94.7% for AGIs over 200k)
Averages for the 2012 tax year for zip code 49014, filed in 2013:
Average Adjusted Gross Income (AGI) in 2012: $45,576 (Individual Income Tax Returns)
Here:
$45,576
State:
$55,609
Salary/wage: $41,297 (reported on 80.7% of returns)
Here:
$41,297
State:
$46,782
(% of AGI for various income ranges: 71.2% for AGIs below $25k, 76.7% for AGIs $25k-50k, 75.3% for AGIs $50k-75k, 73.2% for AGIs $75k-100k, 76.5% for AGIs $100k-200k, 56.1% for AGIs over 200k)
Taxable interest for individuals: $915 (reported on 32.4% of returns)
This zip code:
$915
Michigan:
$1,491
(% of AGI for various income ranges: 0.8% for AGIs below $25k, 0.5% for AGIs $25k-50k, 0.6% for AGIs $50k-75k, 0.6% for AGIs $75k-100k, 0.6% for AGIs $100k-200k, 1.1% for AGIs over 200k)
Ordinary dividends: $3,244 (reported on 17.4% of returns)
Here:
$3,244
State:
$6,225
(% of AGI for various income ranges: 1.1% for AGIs below $25k, 1.0% for AGIs $25k-50k, 1.1% for AGIs $50k-75k, 1.2% for AGIs $75k-100k, 1.3% for AGIs $100k-200k, 2.2% for AGIs over 200k)
Net capital gain/loss in AGI: +$4,256 (reported on 12.0% of returns)
Here:
+$4,256
State:
+$9,326
(% of AGI for various income ranges: 0.3% for AGIs $50k-75k, 0.5% for AGIs $75k-100k, 0.8% for AGIs $100k-200k, 8.2% for AGIs over 200k)
Profit/loss from business: +$8,488 (reported on 11.4% of returns)
Here:
+$8,488
State:
+$11,523
(% of AGI for various income ranges: 6.1% for AGIs below $25k, 1.7% for AGIs $25k-50k, 1.4% for AGIs $50k-75k, 1.3% for AGIs $75k-100k, 2.4% for AGIs $100k-200k)
Taxable individual retirement arrangement distribution: $14,430 (reported on 11.5% of returns)
49014:
$14,430
Michigan:
$15,298
(% of AGI for various income ranges: 3.3% for AGIs below $25k, 3.5% for AGIs $25k-50k, 3.6% for AGIs $50k-75k, 4.3% for AGIs $75k-100k, 3.7% for AGIs $100k-200k, 3.1% for AGIs over 200k)
Self-employment retirement plans: $16,850 (reported on 0.2% of returns)
49014:
$16,850
Michigan:
$20,834
Total itemized deductions: $19,780 (21% of AGI, reported on 24.6% of returns)
Here:
$19,780
State:
$21,628
Here:
20.9% of AGI
State:
18.4% of AGI
(% of AGI for various income ranges: 6.2% for AGIs below $25k, 7.4% for AGIs $25k-50k, 9.7% for AGIs $50k-75k, 11.1% for AGIs $75k-100k, 13.3% for AGIs $100k-200k, 15.7% for AGIs over 200k)
Charity contributions: $3,231 (reported on 19.1% of returns)
Here:
$3,231
State:
$4,225
(% of AGI for various income ranges: 0.4% for AGIs below $25k, 0.9% for AGIs $25k-50k, 1.2% for AGIs $50k-75k, 1.6% for AGIs $75k-100k, 1.9% for AGIs $100k-200k, 1.8% for AGIs over 200k)
Taxes paid: $7,060 (reported on 24.6% of returns)
49014:
$7,060
State:
$8,327
(% of AGI for various income ranges: 1.2% for AGIs below $25k, 2.0% for AGIs $25k-50k, 3.1% for AGIs $50k-75k, 4.0% for AGIs $75k-100k, 5.8% for AGIs $100k-200k, 5.8% for AGIs over 200k)
Earned income credit: $2,429 (reported on 21.1% of returns)
Here:
$2,429
State:
$2,306
(% of AGI for various income ranges: 8.0% for AGIs below $25k, 1.1% for AGIs $25k-50k)
Percentage of individuals using paid preparers for their 2012 taxes: 55.8%
Here:
56%
State:
57%
(% for various income ranges: 51.5% for AGIs below $25k, 56.2% for AGIs $25k-50k, 60.3% for AGIs $50k-75k, 61.2% for AGIs $75k-100k, 61.8% for AGIs $100k-200k, 75.0% for AGIs over 200k)
Averages for the 2004 tax year for zip code 49014, filed in 2005:
Average Adjusted Gross Income (AGI) in 2004: $39,249 (Individual Income Tax Returns)
Here:
$39,249
State:
$48,204
Salary/wage: $37,606 (reported on 84.3% of returns)
Here:
$37,606
State:
$42,791
(% of AGI for various income ranges: 95.5% for AGIs below $10k, 73.3% for AGIs $10k-25k, 81.0% for AGIs $25k-50k, 78.7% for AGIs $50k-75k, 86.7% for AGIs $75k-100k, 80.1% for AGIs over 100k)
Taxable interest for individuals: $1,096 (reported on 41.4% of returns)
This zip code:
$1,096
Michigan:
$1,725
(% of AGI for various income ranges: 4.0% for AGIs below $10k, 1.6% for AGIs $10k-25k, 1.0% for AGIs $25k-50k, 1.2% for AGIs $50k-75k, 0.7% for AGIs $75k-100k, 1.1% for AGIs over 100k)
Taxable dividends: $2,013 (reported on 21.5% of returns)
Here:
$2,013
State:
$3,420
(% of AGI for various income ranges: 2.2% for AGIs below $10k, 1.2% for AGIs $10k-25k, 1.0% for AGIs $25k-50k, 1.2% for AGIs $50k-75k, 0.8% for AGIs $75k-100k, 1.3% for AGIs over 100k)
Net capital gain/loss: +$2,912 (reported on 14.8% of returns)
Here:
+$2,912
State:
+$8,532
(% of AGI for various income ranges: -0.9% for AGIs below $10k, -0.1% for AGIs $10k-25k, 0.3% for AGIs $25k-50k, 0.5% for AGIs $50k-75k, 0.9% for AGIs $75k-100k, 3.0% for AGIs over 100k)
Profit/loss from business: +$6,161 (reported on 12.3% of returns)
Here:
+$6,161
State:
+$9,547
(% of AGI for various income ranges: 4.2% for AGIs below $10k, 3.0% for AGIs $10k-25k, 1.2% for AGIs $25k-50k, 1.6% for AGIs $50k-75k, 1.4% for AGIs $75k-100k, 2.6% for AGIs over 100k)
IRA payment deduction: $2,578 (reported on 1.7% of returns)
49014:
$2,578
Michigan:
$2,875
(% of AGI for various income ranges: 0.1% for AGIs $10k-25k, 0.2% for AGIs $25k-50k, 0.2% for AGIs $50k-75k, 0.1% for AGIs $75k-100k, 0.0% for AGIs over 100k)
Self-employed pension: $9,594 (reported on 0.3% of returns)
Here:
$9,594
Michigan:
$13,826
Total itemized deductions: $16,305 (21% of AGI, reported on 28.6% of returns)
Here:
$16,305
State:
$18,509
Here:
21.3% of AGI
State:
20.7% of AGI
(% of AGI for various income ranges: 8.0% for AGIs below $10k, 6.2% for AGIs $10k-25k, 9.1% for AGIs $25k-50k, 12.1% for AGIs $50k-75k, 15.1% for AGIs $75k-100k, 14.6% for AGIs over 100k)
Charity contributions deductions: $2,983 (4% of AGI, reported on 24.5% of returns)
Here:
$2,983
State:
$3,365
Here:
3.7% of AGI
State:
3.6% of AGI
(% of AGI for various income ranges: 0.4% for AGIs below $10k, 0.7% for AGIs $10k-25k, 1.1% for AGIs $25k-50k, 1.7% for AGIs $50k-75k, 2.2% for AGIs $75k-100k, 3.0% for AGIs over 100k)
Total tax: $5,278 (reported on 72.0% of returns)
49014:
$5,278
State:
$7,691
(% of AGI for various income ranges: 2.3% for AGIs below $10k, 3.5% for AGIs $10k-25k, 6.7% for AGIs $25k-50k, 8.9% for AGIs $50k-75k, 10.0% for AGIs $75k-100k, 15.8% for AGIs over 100k)
Earned income credit: $1,755 (reported on 18.0% of returns)
Here:
$1,755
State:
$1,737
Percentage of individuals using paid preparers for their 2004 taxes: 60.7%
Here:
61%
State:
60%
(% for various income ranges: 56.0% for AGIs below $10k, 62.5% for AGIs $10k-25k, 62.2% for AGIs $25k-50k, 60.7% for AGIs $50k-75k, 59.8% for AGIs $75k-100k, 64.6% for AGIs over 100k)
Likely homosexual households (counted as self-reported same-sex unmarried-partner households)
Lesbian couples: 0.5% of all households
Gay men: 0.0% of all households
Household received Food Stamps/SNAP in the past 12 months: 1,094 Household did not receive Food Stamps/SNAP in the past 12 months: 7,244
Women who had a birth in the past 12 months: 317 (271 now married, 50 unmarried) Women who did not have a birth in the past 12 months: 3,596 (1,585 now married, 2,007 unmarried)
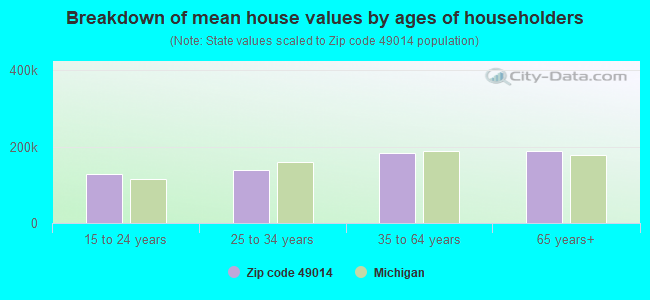
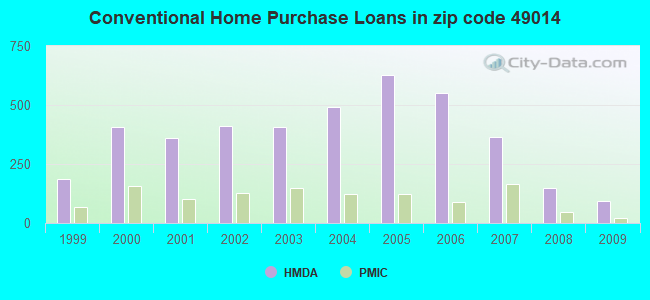
Housing units in zip code 49014 with a mortgage: 3,562 (112 second mortgage, 1 home equity loan, 104 both second mortgage and home equity loan) Houses without a mortgage: 212
Median monthly owner costs for units with a mortgage: $1,187 Median monthly owner costs for units without a mortgage: $529
Residents with income below the poverty level in 2022:
This zip code:
13.3%
Whole state:
13.4%
Residents with income below 50% of the poverty level in 2022:
This zip code:
7.5%
Whole state:
6.9%
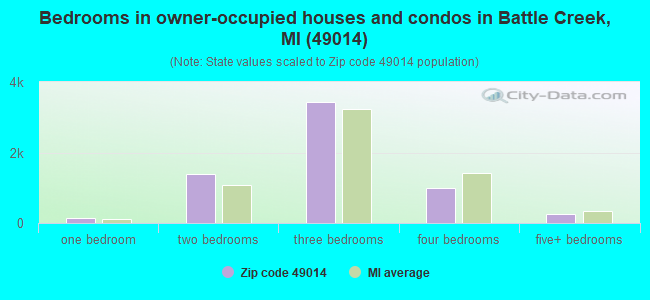
Median number of rooms in houses and condos:
Here:
6.4
State:
6.5
Median number of rooms in apartments:
Here:
4.3
State:
4.3
Notable locations in this zip code not listed on our city pages
Notable locations in zip code 49014: Camp Holston (A), Oakland Hills Golf Club (B), Binder Park Golf Course (C), Riverside Country Club (D), Pennfield Station (E), Riverside Country Club (F), Calhoun County Sheriff's Department (G), Calhoun County Justice Center (H), Battle Creek Police Department (I), Battle Creek Fire Department Station 1 Headquarters (J), Emmett Township Department of Public Safety Fire Station (K), Battle Creek Fire Department Station 3 (L), Pennfield Township Fire Department Station 2 (M), Emmett Township Department of Public Safety Substation (N). Display/hide their locations on the map
Churches in zip code 49014 include: Union Church (A), First Congregational Church (B), First United Methodist Church (C), First Church of the Nazarene (D), First Christian Church (E), Harper Creek Baptist Church (F), Victory Life Church (G), Family Altar Chapel (H), Fairfax Community Baptist Church (I). Display/hide their locations on the map
Cemeteries: Floral Lawn Memorial Gardens (1), Mount Olive Cemetery (2), Sandstone Cemetery (3), Newbre Cemetery (4), Oak Hill Cemetery (5). Display/hide their locations on the map
Lakes and swamps: Pine Lake (A), Little Goose Lake (B), Wiegands Lake (C), Mud Lake (D), Hall Lake (E), Graham Lake (F), Goose Lake (G), Gardner Lake (H). Display/hide their locations on the map
Streams, rivers, and creeks: Barnum Creek (A), Wanadoga Creek (B), Harper Creek (C), Willow Creek (D), Ackley Creek (E), Severence Creek (F), Minges Brook (G), Dickinson Creek (H). Display/hide their locations on the map
Parks in zip code 49014 include: James and Ellen White Historical Marker (1), Postum Cereal Company Historical Marker (2), Postum Cereal Company Factory Historical Marker (3), W K Kellogg Historical Marker (4), Kellogg Company Historical Marker (5), Bryant Farm Historical Marker (6), Charles Binder Park (7), Barnes Park (8), Kellogg Biological Preserve (9). Display/hide their locations on the map
2,828 married couples with children.
1,291 single-parent households (324 men, 967 women).
91.4% of residents of 49014 zip code speak English at home.
4.2% of residents speak Spanish at home (69% very well, 11% well, 13% not well, 8% not at all).
1.4% of residents speak other Indo-European language at home (78% very well, 10% well, 12% not well).
1.5% of residents speak Asian or Pacific Island language at home (77% very well, 13% well, 9% not well, 1% not at all).
1.5% of residents speak other language at home (74% very well, 26% well).
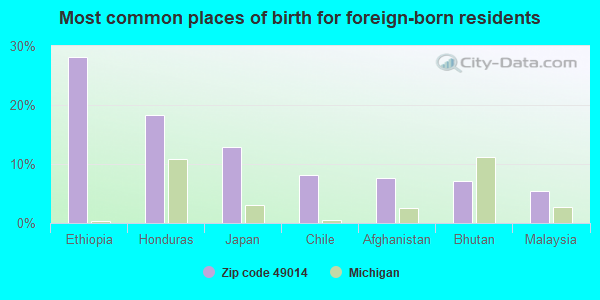
Foreign born population: 998 (4.7%) (51.7% of them are naturalized citizens)
This zip code:
4.7%
Whole state:
6.9%
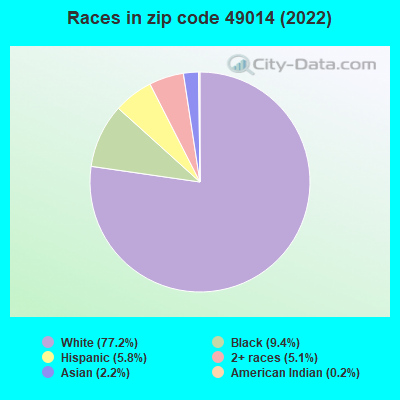
28%Ethiopia
18%Honduras
13%Japan
8%Chile
8%Afghanistan
7%Bhutan
5%Malaysia
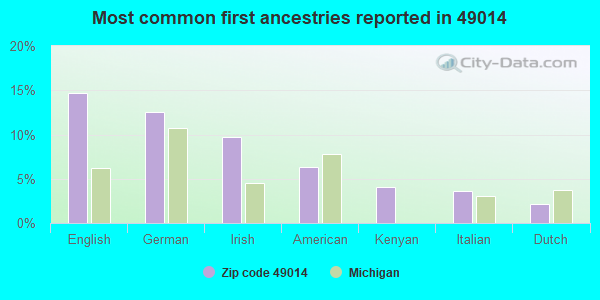
15%English
13%German
10%Irish
6%American
4%Kenyan
4%Italian
2%Dutch
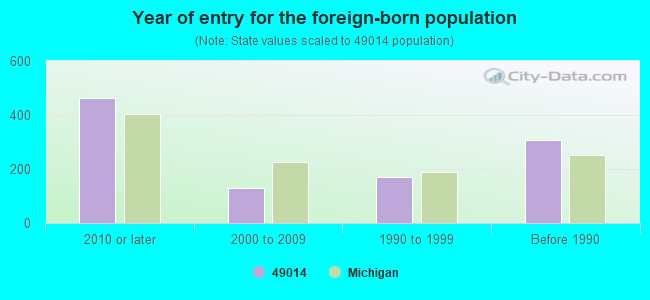
Year of entry for the foreign-born population
4622010 or later
1302000 to 2009
1711990 to 1999
308Before 1990
Facilities with environmental interests located in this zip code:
DORIS KLAUSSEN DEV. CENTER (408 JAMESON STREET in BATTLE CREEK, MI)
(National Center for Education Statistics) - STATE ID-00426 (Resource Conservation and Recovery Act (tracking hazardous waste)) Organizations: CALHOUN ISD (SCHOOL DISTRICT)
Alternative names: KLAUSSEN DEVELOPMENT CTRY
BEADLE LAKE ELEMENTARY SCHOOL (8175 C DRIVE NORTH in BATTLE CREEK, MI)
(National Center for Education Statistics) - STATE ID-00234 Organizations: HARPER CREEK COMMUNITY SCHOOLS (SCHOOL DISTRICT)
FOOD CITY PICKLE (13760 VERONA RD in BATTLE CREEK, MI)
COMPLIANCE ACTIVITY (Tracking inspections of insecticide, fungicide, and rodenticide, and toxic substances) National Pollutant Discharge Elimination System NON-MAJOR (Tracking pollutant discharge elimination systems) - permit Business SIC classification: PICKLED FRUITS AND VEGETABLES, VEGETABLE SAUCES AND SEASONINGS, AND SALAD DRESSINGS Organizations: FOOD CITY PICKLE,LLC (CONTACT/OWNER)
AGGREGATE INDUSTRIES, INC. (18646 12 MILE RD in BATTLE CREEK, MI)
AIR MINOR (AIRS/AFS) CRITERIA AND HAZARDOUS AIR POLLUTANT INVENTORY (Inventory of air pollution sources) Business SIC classification: CRUSHED AND BROKEN LIMESTONE; CRUSHED AND BROKEN GRANITE; CONSTRUCTION SAND AND GRAVEL Alternative names: BILL SMITH SAND & GRAVEL INC
ALLEN PATTERN OF MI INC (202 MCGRATH PL in BATTLE CREEK, MI)
(Resource Conservation and Recovery Act (tracking hazardous waste))
AA ENGINE MACHINE INC (650 N RAYMOND RD in BATTLE CREEK, MI)
(Resource Conservation and Recovery Act (tracking hazardous waste)) Business NAICS classification: GENERAL AUTOMOTIVE REPAIR.
MEIJER INC (6345 B DRIVE NORTH in BATTLE CREEK, MI)
Conditionally Exempt Small Quantity Generators, less than 100 kg/month of hazardous waste (Resource Conservation and Recovery Act (tracking hazardous waste)) Business NAICS classification: DISCOUNT DEPARTMENT STORES. Alternative names: MEIJER INC 195
GRESLYS INC (1626 E MICHIGAN in BATTLE CREEK, MI)
Conditionally Exempt Small Quantity Generators, less than 100 kg/month of hazardous waste (Resource Conservation and Recovery Act (tracking hazardous waste)) Organizations: ROBERT M. GRESLY (CONTACT/OPERATOR)
CENTRAL MICHIGAN PRESS INC (1320 E COLUMBIA in BATTLE CREEK, MI)
Conditionally Exempt Small Quantity Generators, less than 100 kg/month of hazardous waste (Resource Conservation and Recovery Act (tracking hazardous waste)) Organizations: MIKE FATT (CONTACT/OWNER)
BATTLE CREEK WRECKING (185 MCCALLISTER RD in BATTLE CREEK, MI)
SUPERFUND (Superfund database) Alternative names: BATTLE CREEK WRECKING LANDFILL
BATTLE CREEK WRECKING CO INC. (1019 VERONA RD in BATTLE CREEK, MI)
CRITERIA AND HAZARDOUS AIR POLLUTANT INVENTORY (Inventory of air pollution sources) Business SIC classification: REFUSE SYSTEMS Business NAICS classification: SOLID WASTE LANDFILL.
Housing units lacking complete plumbing facilities: 0.5% Housing units lacking complete kitchen facilities: 1.7%
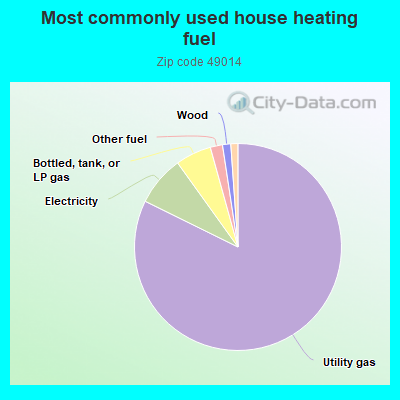
82.3%Utility gas
7.8%Electricity
5.6%Bottled, tank, or LP gas
1.9%Other fuel
1.3%Wood
1.1%Fuel oil, kerosene, etc.
Place of birth for U.S.-born residents:
This state: 16,047
Northeast: 460
Midwest: 1,608
South: 1,168
West: 738
54% of the 49014 zip code residents lived in the same house 5 years ago. Out of people who lived in different houses, 67% lived in this county. Out of people who lived in different counties, 50% lived in Michigan.
89% of the 49014 zip code residents lived in the same house 1 year ago. Out of people who lived in different houses, 49% moved from this county. Out of people who lived in different houses, 25% moved from different county within same state. Out of people who lived in different houses, 26% moved from different state. Out of people who lived in different houses, 0% moved from abroad.
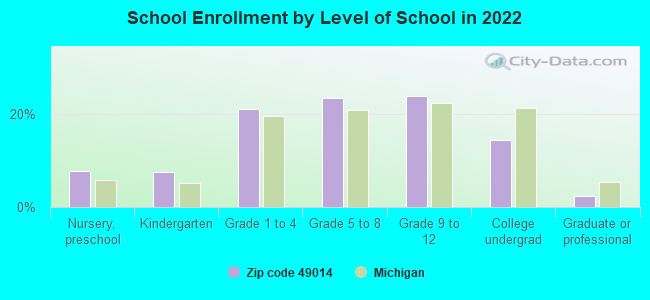
Private vs. public school enrollment:
Students in private schools in grades 1 to 8 (elementary and middle school): 146
Here:
7.9%
Michigan:
12.4%
Students in private schools in grades 9 to 12 (high school): 106
Here:
10.7%
Michigan:
9.8%
Students in private undergraduate colleges: 103
Here:
17.3%
Michigan:
14.9%
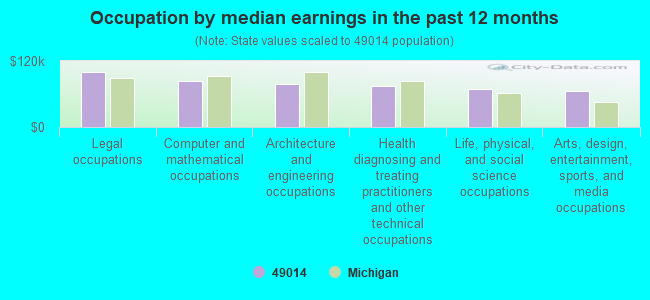
Occupation by median earnings in the past 12 months ($)
100,463Legal occupations
83,333Computer and mathematical occupations
79,023Architecture and engineering occupations
75,054Health diagnosing and treating practitioners and other technical occupations
69,407Life, physical, and social science occupations
65,530Arts, design, entertainment, sports, and media occupations
Companies with federal contracts located in this zip code (BATTLE CREEK, MI):
CONTRACT FOOD SERVICES, INC (1240 E COLUMBIA AVE; small business) : $297,266 in 29 contractsfrom 2002 to 2006
Contracts for Food Services, Military Personnel Recruitment by Army, Navy Signed by year:2000: $0; 2001: $0; 2002: $27,801; 2003: $32,553; 2004: $22,798; 2005: $94,361; 2006: $119,753.
Biggest contracts:
$55,273 with Army for Food Services. Signed on 2006-06-03. Completion date: 2006-07-23.
$26,877, same as above.Signed on 2003-06-09. Completion date: 2003-06-26.
$22,441, same as above.Signed on 2006-03-16. Completion date: 2006-01-22.
$22,416, same as above.Signed on 2002-06-10. Completion date: 2002-06-24.
GREEN STAR LANDSCAPE SERVICES (8800 E DRIVE NORTH; small business)
$22,699 with Army for Maintenance, Repair or Alteration of Real Property -- Unimproved Real Property (Land). Signed on 2005-05-16. Completion date: 2005-06-12.
FERREES TOOLS INC (1477 MICHIGAN AVE E; small business) : $18,953 in 2 contractsfrom 2004 to 2005
$10,000 with Navy for Musical Instruments. Taking place in LA. Signed on 2005-09-30. Completion date: 2006-01-03.
$8,953 with Department of Defense Education Activity for Musical Instrument Parts and Accessories. Signed on 2004-09-10. Completion date: 2004-10-10.
MAIN STREET MARKETING (540 MAIN STREET; small business) : $17,516 in 6 contractsfrom 2002 to 2003
Contracts for Meat, Poultry, and Fish by Army Signed by year:2000: $0; 2001: $0; 2002: $6,199; 2003: $11,317; 2004: $0; 2005: $0; 2006: $0.
Biggest contracts:
$3,500 with Army for Meat, Poultry, and Fish. Signed on 2002-02-19. Completion date: 2002-02-22.
$3,240, same as above.Signed on 2003-01-08. Completion date: 2003-01-10.
$2,882, same as above.Signed on 2003-04-01. Completion date: 2003-04-04.
$2,699, same as above.Signed on 2002-04-03. Completion date: 2002-04-19.
MIDWEST COMMUNICATIONS SERVICE (7255 TOWER RD; small business)
$11,508 with Army for Modification of Equipment -- Communication, Detection, and Coherent Radiation Equipment. Signed on 2002-03-14. Completion date: 2002-03-15.
WILLS AUTO SERVICE (1018 COLUMBIA AVE E; small business)
$5,368 with Army for Miscellaneous Alarm, Signal and Security Detection Systems. Signed on 2006-04-14. Completion date: 2006-06-02.
KIPP REFUSE INC (1185 NORTH RAYMOND ROAD) : $924 in 2 contractsin 2003
$924 with Army for Trash/Garbage Collection Services - Including Portable Sanitation Services. Signed on 2003-02-18. Completion date: 2004-03-31.
$0, same as above.Signed on 2003-02-18. Completion date: 2004-03-31.
Top industries in this zip code by the number of employees in 2005:
2002 - 2018 National Fire Incident Reporting System (NFIRS) incidents
Based on the data from the years 2002 - 2018 the average number of fire incidents per year is 62. The highest number of reported fires - 115 took place in 2017, and the least - 25 in 2009. The data has a rising trend.
When looking into fire subcategories, the most incidents belonged to: Structure Fires (51.0%), and Outside Fires (26.7%).
Fire incident types reported to NFIRS in Zip Code 49014


 Nearest zip codes: 49033, 49015, 49037, 49017, 49021, 49068.


 Based on the data from the years 2002 - 2018 the average number of fire incidents per year is 62. The highest number of reported fires - 115 took place in 2017, and the least - 25 in 2009. The data has a rising trend.
 When looking into fire subcategories, the most incidents belonged to: Structure Fires (51.0%), and Outside Fires (26.7%).