Estimated zip code population in 2022: 2,480 Zip code population in 2010: 2,523 Zip code population in 2000: 2,488
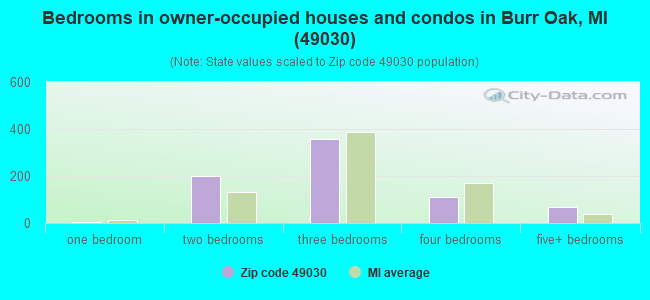
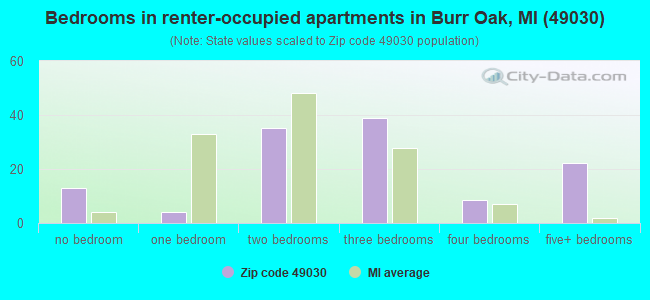
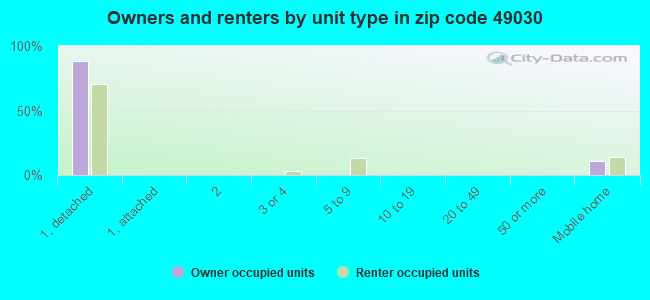
Houses and condos: 913 Renter-occupied apartments: 123
% of renters here:
14%
State:
27%
March 2022 cost of living index in zip code 49030: 80.6 (low, U.S. average is 100)
Land area: 47.4 sq. mi. Water area: 0.7 sq. mi.
Population density: 52 people per square mile
(very low).
OSM Map
General Map
Google Map
MSN Map
OSM Map
General Map
Google Map
MSN Map
OSM Map
General Map
Google Map
MSN Map
OSM Map
General Map
Google Map
MSN Map
Please wait while loading the map...
Real estate property taxes paid for housing units in 2022:
This zip code:
1.1% ($1,465)
Michigan:
1.2% ($2,746)
Median real estate property taxes paid for housing units with mortgages in 2022: $1,337 (1.0%) Median real estate property taxes paid for housing units with no mortgage in 2022: $1,747 (1.3%)
Business Search- 14 Million verified businesses
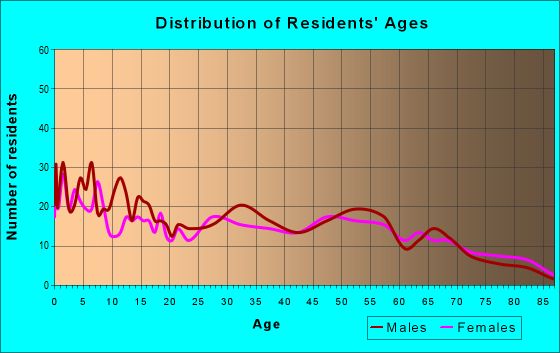
Males: 1,339
(54.0%)
Females: 1,140
(46.0%)
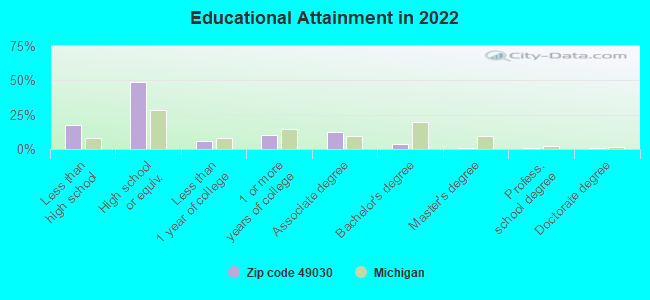
For population 25 years and over in 49030:
High school or higher: 81.0%
Bachelor's degree or higher: 5.5%
Graduate or professional degree: 2.0%
Unemployed: 2.7%
Mean travel time to work (commute): 26.1 minutes
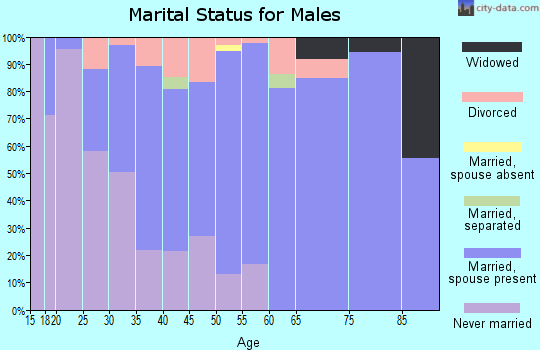
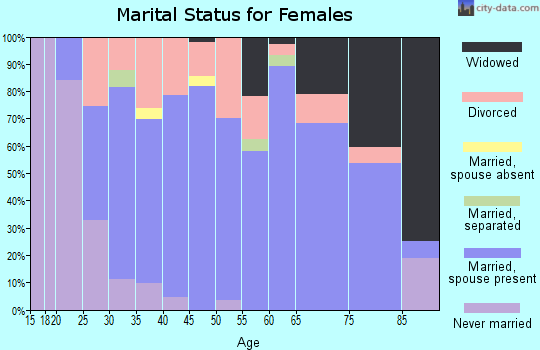
For population 15 years and over in 49030:
Never married: 27.9%
Now married: 53.5%
Separated: 0.6%
Widowed: 4.6%
Divorced: 13.4%
Zip code 49030 compared to state average:
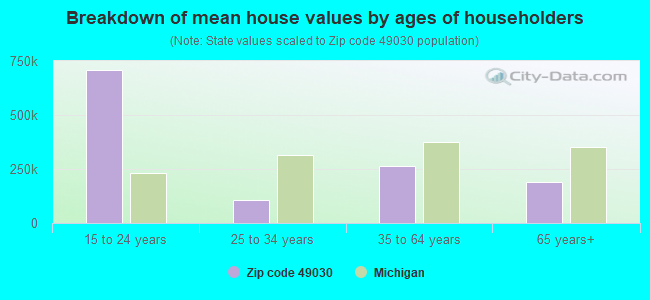
Median house value below state average.
Unemployed percentage below state average.
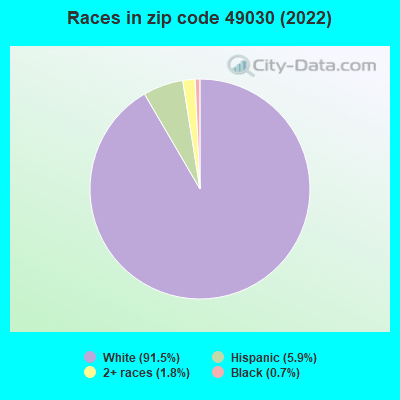
Black race population percentage significantly below state average.
Median age below state average.
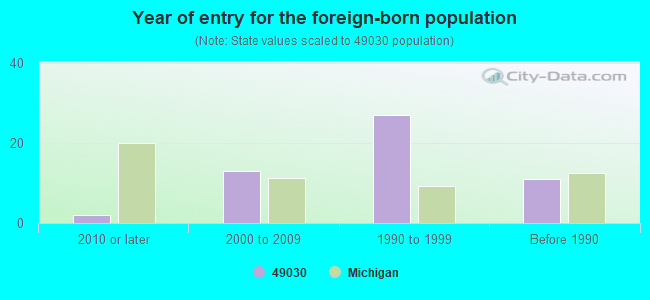
Foreign-born population percentage significantly below state average.
Renting percentage below state average.
Length of stay since moving in significantly above state average.
Percentage of population with a bachelor's degree or higher significantly below state average.
Averages for the 2020 tax year for zip code 49030, filed in 2021:
Average Adjusted Gross Income (AGI) in 2020: $50,180 (Individual Income Tax Returns)
Here:
$50,180
State:
$68,945
Salary/wage: $42,871 (reported on 79.5% of returns)
Here:
$42,871
State:
$57,142
(% of AGI for various income ranges: 1054.2% for AGIs below $25k, 3851.7% for AGIs $25k-50k, 6047.9% for AGIs $50k-75k, 9585.0% for AGIs $75k-100k, 17076.7% for AGIs $100k-200k)
Taxable interest for individuals: $1,207 (reported on 25.0% of returns)
This zip code:
$1,207
Michigan:
$1,630
(% of AGI for various income ranges: 22.5% for AGIs below $25k, 16.7% for AGIs $25k-50k, 74.3% for AGIs $50k-75k, 32.5% for AGIs $75k-100k, 190.0% for AGIs $100k-200k)
Ordinary dividends: $2,512 (reported on 15.2% of returns)
Here:
$2,512
State:
$6,972
(% of AGI for various income ranges: 11.7% for AGIs below $25k, 25.0% for AGIs $25k-50k, 77.9% for AGIs $50k-75k, 95.0% for AGIs $75k-100k, 256.7% for AGIs $100k-200k)
Net capital gain/loss in AGI: +$3,736 (reported on 12.5% of returns)
Here:
+$3,736
State:
+$20,064
(% of AGI for various income ranges: 5.8% for AGIs below $25k, 15.0% for AGIs $25k-50k, 122.1% for AGIs $50k-75k, 106.2% for AGIs $75k-100k, 361.7% for AGIs $100k-200k)
Profit/loss from business: +$14,206 (reported on 16.1% of returns)
Here:
+$14,206
State:
+$11,172
(% of AGI for various income ranges: 130.8% for AGIs below $25k, 273.8% for AGIs $25k-50k, 395.7% for AGIs $50k-75k, 307.5% for AGIs $75k-100k, 1310.0% for AGIs $100k-200k)
Taxable individual retirement arrangement distribution: $16,110 (reported on 8.9% of returns)
49030:
$16,110
Michigan:
$19,803
(% of AGI for various income ranges: 80.0% for AGIs below $25k, 97.5% for AGIs $25k-50k, 365.7% for AGIs $50k-75k, 841.2% for AGIs $75k-100k)
Total itemized deductions: $35,950 (reported on 1.8% of returns)
Here:
$35,950
State:
$34,117
(% of AGI for various income ranges: 513.6% for AGIs $50k-75k)
Taxes paid: $7,950 (reported on 1.8% of returns)
49030:
$7,950
State:
$7,972
(% of AGI for various income ranges: 113.6% for AGIs $50k-75k)
Earned income credit: $2,053 (reported on 17.0% of returns)
Here:
$2,053
State:
$2,251
(% of AGI for various income ranges: 78.8% for AGIs below $25k, 83.8% for AGIs $25k-50k)
Percentage of individuals using paid preparers for their 2020 taxes: 91.1%
Here:
91%
State:
93%
(% for various income ranges: 89.2% for AGIs below $25k, 93.8% for AGIs $25k-50k, 90.0% for AGIs $50k-75k, 90.9% for AGIs $75k-100k, 91.7% for AGIs $100k-200k)
Averages for the 2012 tax year for zip code 49030, filed in 2013:
Average Adjusted Gross Income (AGI) in 2012: $37,743 (Individual Income Tax Returns)
Here:
$37,743
State:
$55,609
Salary/wage: $33,468 (reported on 81.2% of returns)
Here:
$33,468
State:
$46,782
(% of AGI for various income ranges: 71.8% for AGIs below $25k, 79.7% for AGIs $25k-50k, 82.3% for AGIs $50k-75k, 75.4% for AGIs $75k-100k, 44.3% for AGIs $100k-200k)
Taxable interest for individuals: $1,397 (reported on 29.5% of returns)
This zip code:
$1,397
Michigan:
$1,491
(% of AGI for various income ranges: 1.9% for AGIs below $25k, 0.9% for AGIs $25k-50k, 0.9% for AGIs $50k-75k, 0.3% for AGIs $75k-100k, 1.7% for AGIs $100k-200k)
Ordinary dividends: $1,581 (reported on 14.3% of returns)
Here:
$1,581
State:
$6,225
(% of AGI for various income ranges: 1.2% for AGIs below $25k, 0.5% for AGIs $25k-50k, 0.8% for AGIs $50k-75k, 0.4% for AGIs $100k-200k)
Net capital gain/loss in AGI: +$2,485 (reported on 11.6% of returns)
Here:
+$2,485
State:
+$9,326
(% of AGI for various income ranges: 0.8% for AGIs below $25k, 0.6% for AGIs $25k-50k, 1.1% for AGIs $50k-75k, 1.1% for AGIs $100k-200k)
Profit/loss from business: +$8,211 (reported on 17.0% of returns)
Here:
+$8,211
State:
+$11,523
(% of AGI for various income ranges: 7.9% for AGIs below $25k, 6.2% for AGIs $25k-50k, 3.4% for AGIs $50k-75k)
Taxable individual retirement arrangement distribution: $11,045 (reported on 9.8% of returns)
49030:
$11,045
Michigan:
$15,298
(% of AGI for various income ranges: 3.8% for AGIs below $25k, 3.8% for AGIs $25k-50k, 9.9% for AGIs $75k-100k)
Total itemized deductions: $16,547 (21% of AGI, reported on 15.2% of returns)
Here:
$16,547
State:
$21,628
Here:
21.0% of AGI
State:
18.4% of AGI
(% of AGI for various income ranges: 6.9% for AGIs $25k-50k, 5.8% for AGIs $50k-75k, 7.3% for AGIs $75k-100k, 11.8% for AGIs $100k-200k)
Charity contributions: $4,769 (reported on 11.6% of returns)
Here:
$4,769
State:
$4,225
(% of AGI for various income ranges: 1.1% for AGIs $25k-50k, 1.5% for AGIs $50k-75k, 4.0% for AGIs $100k-200k)
Taxes paid: $4,782 (reported on 15.2% of returns)
49030:
$4,782
State:
$8,327
(% of AGI for various income ranges: 1.4% for AGIs $25k-50k, 1.7% for AGIs $50k-75k, 2.1% for AGIs $75k-100k, 4.2% for AGIs $100k-200k)
Earned income credit: $2,148 (reported on 24.1% of returns)
Here:
$2,148
State:
$2,306
(% of AGI for various income ranges: 7.1% for AGIs below $25k, 1.5% for AGIs $25k-50k)
Percentage of individuals using paid preparers for their 2012 taxes: 64.3%
Here:
64%
State:
57%
(% for various income ranges: 61.2% for AGIs below $25k, 66.7% for AGIs $25k-50k, 66.7% for AGIs $50k-75k, 57.1% for AGIs $75k-100k, 80.0% for AGIs $100k-200k)
Averages for the 2004 tax year for zip code 49030, filed in 2005:
Average Adjusted Gross Income (AGI) in 2004: $31,667 (Individual Income Tax Returns)
Here:
$31,667
State:
$48,204
Salary/wage: $30,594 (reported on 84.1% of returns)
Here:
$30,594
State:
$42,791
(% of AGI for various income ranges: 97.5% for AGIs below $10k, 73.1% for AGIs $10k-25k, 83.0% for AGIs $25k-50k, 86.7% for AGIs $50k-75k, 82.4% for AGIs $75k-100k, 60.9% for AGIs over 100k)
Taxable interest for individuals: $1,221 (reported on 39.4% of returns)
This zip code:
$1,221
Michigan:
$1,725
(% of AGI for various income ranges: 6.5% for AGIs below $10k, 2.7% for AGIs $10k-25k, 1.6% for AGIs $25k-50k, 0.9% for AGIs $50k-75k, 0.8% for AGIs $75k-100k, 0.8% for AGIs over 100k)
Taxable dividends: $1,332 (reported on 16.8% of returns)
Here:
$1,332
State:
$3,420
(% of AGI for various income ranges: 2.9% for AGIs below $10k, 1.0% for AGIs $10k-25k, 0.4% for AGIs $25k-50k, 1.0% for AGIs $50k-75k, 0.1% for AGIs $75k-100k, 0.5% for AGIs over 100k)
Net capital gain/loss: +$3,566 (reported on 12.5% of returns)
Here:
+$3,566
State:
+$8,532
(% of AGI for various income ranges: -2.0% for AGIs below $10k, 0.3% for AGIs $10k-25k, 1.1% for AGIs $25k-50k, 0.8% for AGIs $50k-75k, 0.4% for AGIs $75k-100k, 9.3% for AGIs over 100k)
Profit/loss from business: +$6,955 (reported on 15.6% of returns)
Here:
+$6,955
State:
+$9,547
(% of AGI for various income ranges: 0.5% for AGIs below $10k, 8.7% for AGIs $10k-25k, 3.7% for AGIs $25k-50k, 3.2% for AGIs $50k-75k)
IRA payment deduction: $3,206 (reported on 3.0% of returns)
49030:
$3,206
Michigan:
$2,875
Total itemized deductions: $13,339 (23% of AGI, reported on 19.0% of returns)
Here:
$13,339
State:
$18,509
Here:
22.9% of AGI
State:
20.7% of AGI
(% of AGI for various income ranges: 16.1% for AGIs below $10k, 4.2% for AGIs $10k-25k, 5.6% for AGIs $25k-50k, 10.0% for AGIs $50k-75k, 9.4% for AGIs $75k-100k, 12.6% for AGIs over 100k)
Charity contributions deductions: $2,701 (4% of AGI, reported on 15.4% of returns)
Here:
$2,701
State:
$3,365
Here:
4.5% of AGI
State:
3.6% of AGI
(% of AGI for various income ranges: 0.8% for AGIs $10k-25k, 0.9% for AGIs $25k-50k, 1.8% for AGIs $50k-75k, 1.6% for AGIs $75k-100k, 2.5% for AGIs over 100k)
Total tax: $3,406 (reported on 70.7% of returns)
49030:
$3,406
State:
$7,691
(% of AGI for various income ranges: 3.3% for AGIs below $10k, 4.7% for AGIs $10k-25k, 5.9% for AGIs $25k-50k, 8.3% for AGIs $50k-75k, 10.2% for AGIs $75k-100k, 15.0% for AGIs over 100k)
Earned income credit: $1,670 (reported on 17.7% of returns)
Here:
$1,670
State:
$1,737
Percentage of individuals using paid preparers for their 2004 taxes: 66.1%
Here:
66%
State:
60%
(% for various income ranges: 59.1% for AGIs below $10k, 66.8% for AGIs $10k-25k, 65.5% for AGIs $25k-50k, 76.8% for AGIs $50k-75k, 66.0% for AGIs $75k-100k, 63.6% for AGIs over 100k)
Household received Food Stamps/SNAP in the past 12 months: 104 Household did not receive Food Stamps/SNAP in the past 12 months: 757
Women who had a birth in the past 12 months: 19 (14 now married, 4 unmarried) Women who did not have a birth in the past 12 months: 492 (252 now married, 238 unmarried)
Housing units in zip code 49030 with a mortgage: 410 (25 second mortgage, 27 both second mortgage and home equity loan) Houses without a mortgage: 13
Median monthly owner costs for units with a mortgage: $1,153 Median monthly owner costs for units without a mortgage: $507
Residents with income below the poverty level in 2022:
This zip code:
10.1%
Whole state:
13.4%
Residents with income below 50% of the poverty level in 2022:
This zip code:
3.8%
Whole state:
6.9%
Median number of rooms in houses and condos:
Here:
6.6
State:
6.5
Median number of rooms in apartments:
Here:
5.7
State:
4.3
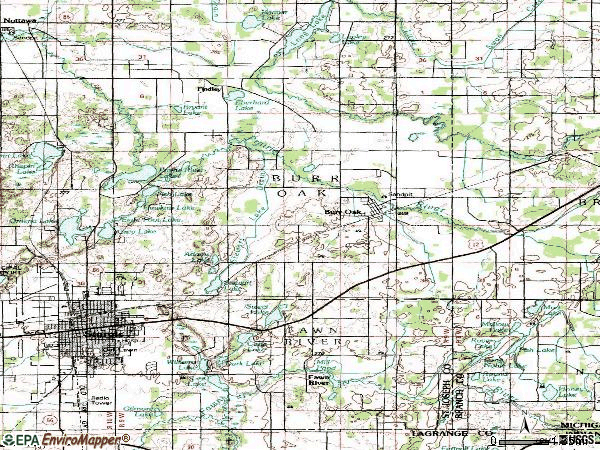
Notable locations in this zip code not listed on our city pages
Notable locations in zip code 49030: Burr Oak Station (A), Burr Oak Fire Department (B), Burr Oak Township Hall (C), Burr Oak Public Library (D), Burr Oak Police Department (E). Display/hide their locations on the map
Churches in zip code 49030 include: Saint Pauls Church (A), Mennonite Church (B), Locust Grove Church (C), New Covenant Christian Fellowship (D), United Methodist Church (E), Saint John's Evangelical Lutheran Church (F), Burr Oak Missionary Church (G). Display/hide their locations on the map
Cemeteries: Locust Grove Mennonite Cemetery (1), Findley Cemetery (2), Burr Oak Township Cemetery (3), Sanborn Cemetery (4). Display/hide their locations on the map
Lakes: Long Noble Lake (A), Fish Lake (B), Bryant Lake (C), Eberhard Lake (D), Lepley Lake (E), Long Lake (F), Round Lake (G). Display/hide their locations on the map
In group quarters: 5 (-1 institutionalized population)
Size of family households: 237 2-persons, 109 3-persons, 51 4-persons, 74 5-persons, 61 6-persons, 44 7-or-more-persons
Size of nonfamily households: 208 1-person, 75 2-persons
622 married couples with children.
99 single-parent households (12 men, 87 women).
81.9% of residents of 49030 zip code speak English at home.
3.4% of residents speak Spanish at home (65% very well, 13% well, 18% not well, 4% not at all).
13.7% of residents speak other Indo-European language at home (74% very well, 20% well, 6% not well).
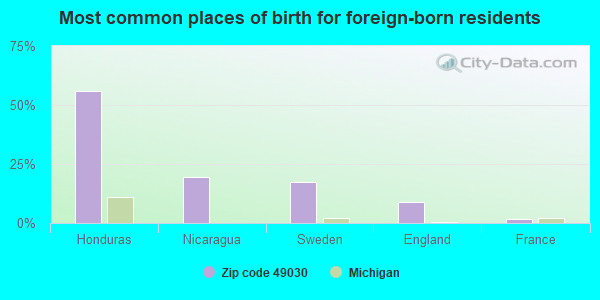
Foreign born population: 56 (2.3%) (45.1% of them are naturalized citizens)
This zip code:
2.3%
Whole state:
6.9%
56%Honduras
19%Nicaragua
18%Sweden
9%England
2%France
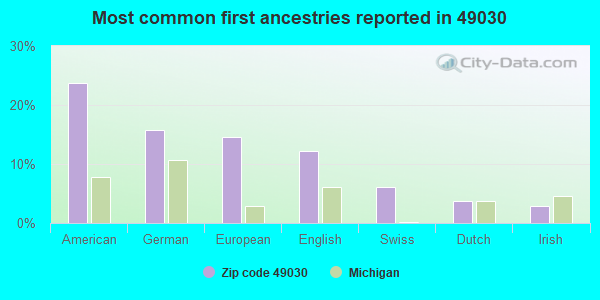
24%American
16%German
15%European
12%English
6%Swiss
4%Dutch
3%Irish
Year of entry for the foreign-born population
22010 or later
132000 to 2009
271990 to 1999
11Before 1990
Facilities with environmental interests located in this zip code:
DOERR ELECTRIC CORP BURR OAK DIV (937 W FRONT ST PO BOX 106 in BURR OAK, MI)
(Resource Conservation and Recovery Act (tracking hazardous waste))
2301 LUNT PARTNERSHIP (951 FRONT ST in BURR OAK, MI)
Conditionally Exempt Small Quantity Generators, less than 100 kg/month of hazardous waste (Resource Conservation and Recovery Act (tracking hazardous waste)) - notification Alternative names: 2301 LUNT PARTNERSHIP - VACANT BLDG
GAS HOUSE THE (205 S 3RD ST in BURR OAK, MI)
Conditionally Exempt Small Quantity Generators, less than 100 kg/month of hazardous waste (Resource Conservation and Recovery Act (tracking hazardous waste)) - notification Organizations: GRAY ALAN (CONTACT/OWNER)
Housing units lacking complete plumbing facilities: 2.3% Housing units lacking complete kitchen facilities: 3.3%
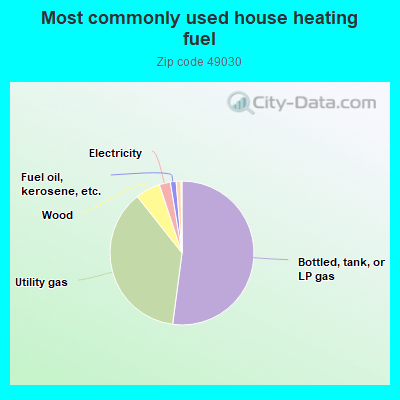
52.3%Bottled, tank, or LP gas
37.4%Utility gas
5.6%Wood
2.5%Electricity
1.3%Fuel oil, kerosene, etc.
1.1%Other fuel
Population in 1990: 3,192.
Place of birth for U.S.-born residents:
This state: 1,750
Northeast: 31
Midwest: 531
South: 90
West: 20
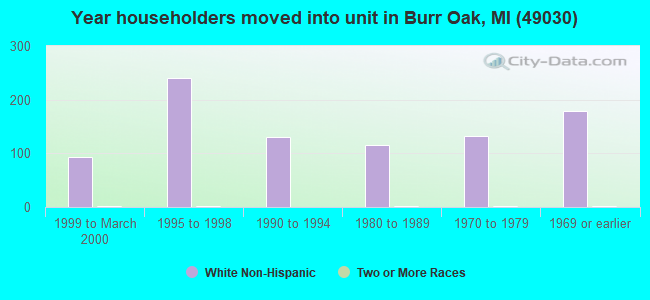
64% of the 49030 zip code residents lived in the same house 5 years ago. Out of people who lived in different houses, 59% lived in this county. Out of people who lived in different counties, 50% lived in Michigan.
92% of the 49030 zip code residents lived in the same house 1 year ago. Out of people who lived in different houses, 75% moved from this county. Out of people who lived in different houses, 18% moved from different county within same state. Out of people who lived in different houses, 3% moved from different state.
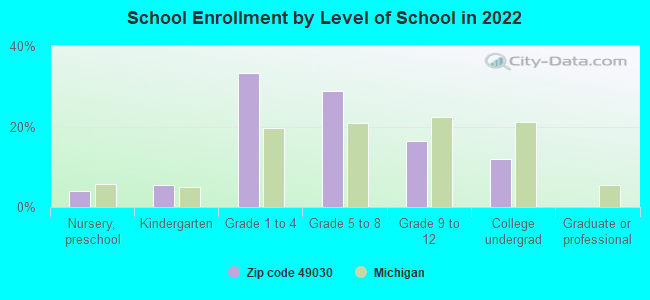
Private vs. public school enrollment:
Students in private schools in grades 1 to 8 (elementary and middle school): 62
Here:
15.9%
Michigan:
12.4%
Students in private schools in grades 9 to 12 (high school): 8
Here:
7.9%
Michigan:
9.8%
Students in private undergraduate colleges: 14
Here:
19.7%
Michigan:
14.9%
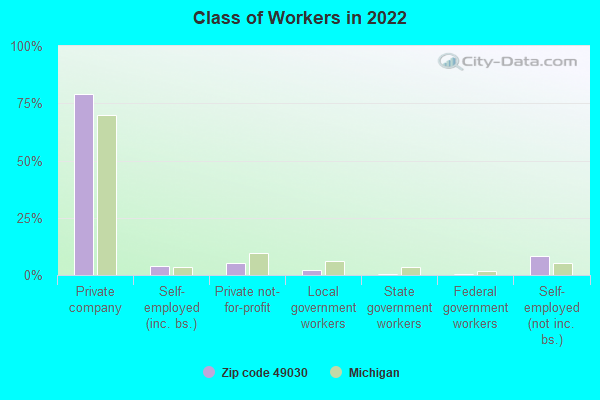
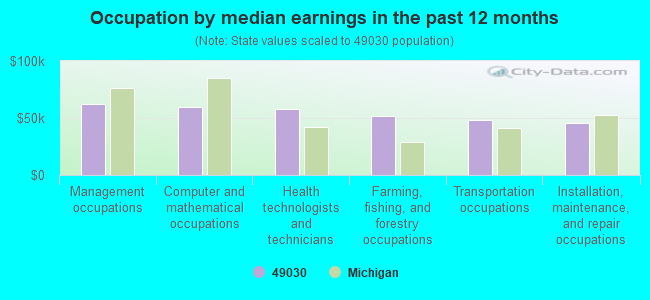
Occupation by median earnings in the past 12 months ($)
61,880Management occupations
59,928Computer and mathematical occupations
57,531Health technologists and technicians
52,176Farming, fishing, and forestry occupations
48,081Transportation occupations
45,611Installation, maintenance, and repair occupations
Top industries in this zip code by the number of employees in 2005:
Other Services (except Public Administration): Religious Organizations (5-9: 1, 1-4: 1)
Other Services (except Public Administration): Other Electronic and Precision Equipment Repair and Maintenance (5-9: 1)
Wholesale Trade: Other Grocery and Related Products Merchant Wholesalers (5-9: 1)
Construction: Plumbing, Heating, and Air-Conditioning Contractors (5-9: 1)
Wholesale Trade: Farm and Garden Machinery and Equipment Merchant Wholesalers (5-9: 1)
Other Services (except Public Administration): Automotive Body, Paint, and Interior Repair and Maintenance (1-4: 1)
People in group quarters in 2010:
7 people in group homes intended for adults
People in group quarters in 2000:
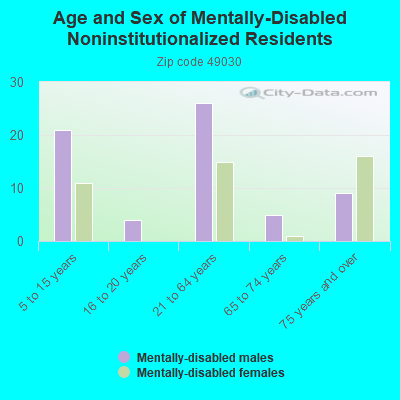
5 people in homes for the mentally retarded
Fatal accident statistics in 2013:
Fatal accident count: 1
Vehicles involved in fatal accidents: 1
Fatal accidents caused by drunken drivers: 1
Fatalities: 1
Persons involved in fatal accidents: 1
Pedestrians involved in fatal accidents: 0
Fatal accident statistics in 2010:
Fatal accident count: 1
Vehicles involved in fatal accidents: 2
Fatal accidents caused by drunken drivers: 0
Fatalities: 1
Persons involved in fatal accidents: 3
Pedestrians involved in fatal accidents: 0
2002 - 2018 National Fire Incident Reporting System (NFIRS) incidents
Based on the data from the years 2002 - 2018 the average number of fire incidents per year is 12. The highest number of reported fires - 31 took place in 2005, and the least - 1 in 2016. The data has a declining trend.
When looking into fire subcategories, the most incidents belonged to: Structure Fires (48.7%), and Outside Fires (37.1%).
Fire incident types reported to NFIRS in Zip Code 49030
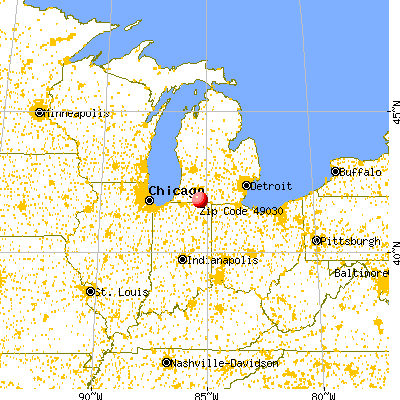


 Nearest zip codes: 49040, 49075, 49091, 46746, 49028, 46771.


 Based on the data from the years 2002 - 2018 the average number of fire incidents per year is 12. The highest number of reported fires - 31 took place in 2005, and the least - 1 in 2016. The data has a declining trend.
 When looking into fire subcategories, the most incidents belonged to: Structure Fires (48.7%), and Outside Fires (37.1%).