Estimated zip code population in 2022: 27,727 Zip code population in 2010: 25,420 Zip code population in 2000: 24,452
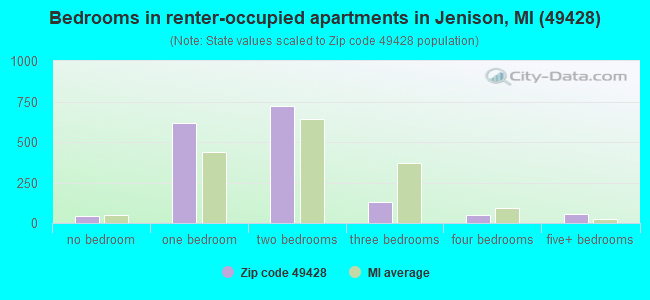
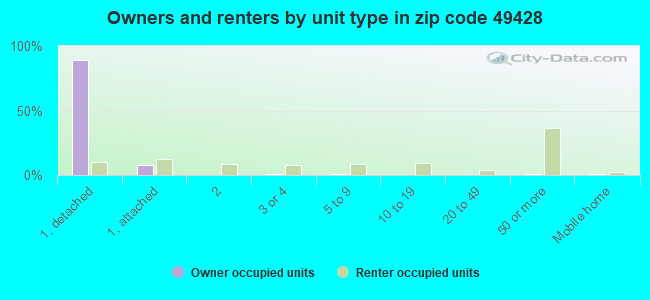
Houses and condos: 10,404 Renter-occupied apartments: 1,593
% of renters here:
15%
State:
27%
March 2022 cost of living index in zip code 49428: 85.0 (less than average, U.S. average is 100)
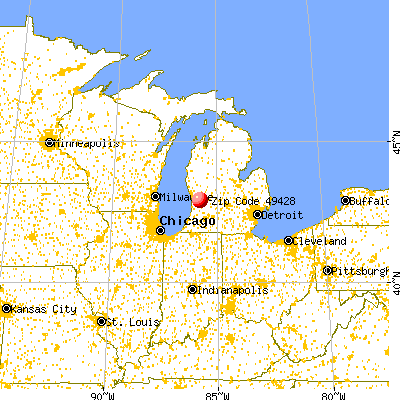
Land area: 16.5 sq. mi. Water area: 0.7 sq. mi.
Population density: 1,677 people per square mile
(low).
OSM Map
General Map
Google Map
MSN Map
OSM Map
General Map
Google Map
MSN Map
OSM Map
General Map
Google Map
MSN Map
OSM Map
General Map
Google Map
MSN Map
Please wait while loading the map...
Real estate property taxes paid for housing units in 2022:
This zip code:
0.9% ($2,588)
Michigan:
1.2% ($2,746)
Median real estate property taxes paid for housing units with mortgages in 2022: $2,655 (0.9%) Median real estate property taxes paid for housing units with no mortgage in 2022: $2,495 (0.9%)
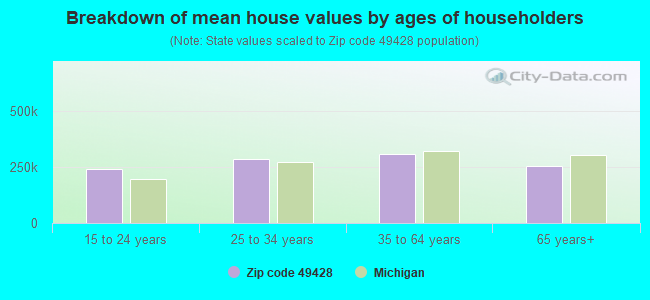
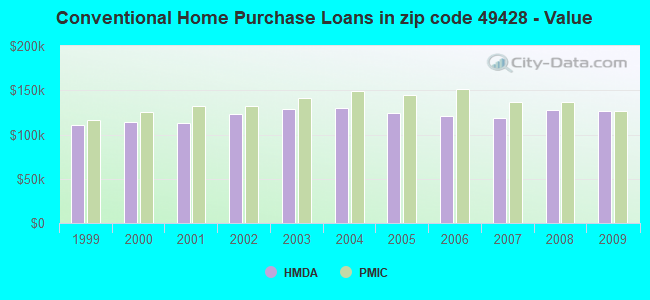
Estimated median house/condo value in 2022: $279,635
49428:
$279,635
Michigan:
$224,400
According to our research of Michigan and other state lists, there were 34 registered sex offenders living in 49428 zip code as of April 27, 2024. The ratio of all residents to sex offenders in zip code 49428 is 814 to 1. The ratio of registered sex offenders to all residents in this zip code is much lower than the state average.
Median resident age:
This zip code:
38.2 years
Michigan median age:
40.3 years
Average household size:
This zip code:
2.7 people
Michigan:
2.4 people
Averages for the 2020 tax year for zip code 49428, filed in 2021:
Average Adjusted Gross Income (AGI) in 2020: $69,704 (Individual Income Tax Returns)
Here:
$69,704
State:
$68,945
Salary/wage: $61,288 (reported on 79.7% of returns)
Here:
$61,288
State:
$57,142
(% of AGI for various income ranges: 1021.2% for AGIs below $25k, 3270.7% for AGIs $25k-50k, 6079.9% for AGIs $50k-75k, 9057.7% for AGIs $75k-100k, 17002.1% for AGIs $100k-200k, 59622.0% for AGIs over 200k)
Taxable interest for individuals: $1,037 (reported on 45.9% of returns)
This zip code:
$1,037
Michigan:
$1,630
(% of AGI for various income ranges: 29.8% for AGIs below $25k, 38.4% for AGIs $25k-50k, 50.6% for AGIs $50k-75k, 47.6% for AGIs $75k-100k, 96.6% for AGIs $100k-200k, 1302.0% for AGIs over 200k)
Ordinary dividends: $4,380 (reported on 23.9% of returns)
Here:
$4,380
State:
$6,972
(% of AGI for various income ranges: 48.8% for AGIs below $25k, 68.0% for AGIs $25k-50k, 79.2% for AGIs $50k-75k, 102.6% for AGIs $75k-100k, 208.8% for AGIs $100k-200k, 3704.0% for AGIs over 200k)
Net capital gain/loss in AGI: +$11,402 (reported on 21.8% of returns)
Here:
+$11,402
State:
+$20,064
(% of AGI for various income ranges: 13.3% for AGIs below $25k, 48.8% for AGIs $25k-50k, 86.5% for AGIs $50k-75k, 140.0% for AGIs $75k-100k, 529.9% for AGIs $100k-200k, 13490.7% for AGIs over 200k)
Profit/loss from business: +$13,746 (reported on 14.1% of returns)
Here:
+$13,746
State:
+$11,172
(% of AGI for various income ranges: 69.1% for AGIs below $25k, 141.8% for AGIs $25k-50k, 229.0% for AGIs $50k-75k, 344.6% for AGIs $75k-100k, 571.9% for AGIs $100k-200k, 3093.3% for AGIs over 200k)
Taxable individual retirement arrangement distribution: $16,603 (reported on 15.0% of returns)
49428:
$16,603
Michigan:
$19,803
(% of AGI for various income ranges: 176.2% for AGIs below $25k, 220.9% for AGIs $25k-50k, 330.2% for AGIs $50k-75k, 432.4% for AGIs $75k-100k, 580.1% for AGIs $100k-200k, 3268.7% for AGIs over 200k)
Self-employed (Keogh) retirement plans: $22,340 (reported on 0.4% of returns)
49428:
$22,340
Michigan:
$25,132
(% of AGI for various income ranges: 26.6% for AGIs $100k-200k, 480.7% for AGIs over 200k)
Total itemized deductions: $33,079 (reported on 5.7% of returns)
Here:
$33,079
State:
$34,117
(% of AGI for various income ranges: 50.7% for AGIs below $25k, 67.2% for AGIs $25k-50k, 169.9% for AGIs $50k-75k, 218.1% for AGIs $75k-100k, 564.8% for AGIs $100k-200k, 5692.0% for AGIs over 200k)
Charity contributions: $14,389 (reported on 5.0% of returns)
Here:
$14,389
State:
$13,548
(% of AGI for various income ranges: 6.3% for AGIs below $25k, 13.0% for AGIs $25k-50k, 38.6% for AGIs $50k-75k, 66.2% for AGIs $75k-100k, 226.8% for AGIs $100k-200k, 2862.0% for AGIs over 200k)
Taxes paid: $7,372 (reported on 5.7% of returns)
49428:
$7,372
State:
$7,972
(% of AGI for various income ranges: 4.9% for AGIs below $25k, 9.3% for AGIs $25k-50k, 32.1% for AGIs $50k-75k, 54.6% for AGIs $75k-100k, 151.3% for AGIs $100k-200k, 1203.3% for AGIs over 200k)
Earned income credit: $1,896 (reported on 6.9% of returns)
Here:
$1,896
State:
$2,251
(% of AGI for various income ranges: 36.4% for AGIs below $25k, 41.3% for AGIs $25k-50k, 1.7% for AGIs $50k-75k)
Percentage of individuals using paid preparers for their 2020 taxes: 93.5%
Here:
94%
State:
93%
(% for various income ranges: 91.2% for AGIs below $25k, 94.3% for AGIs $25k-50k, 94.2% for AGIs $50k-75k, 94.7% for AGIs $75k-100k, 94.7% for AGIs $100k-200k, 93.3% for AGIs over 200k)
Averages for the 2012 tax year for zip code 49428, filed in 2013:
Average Adjusted Gross Income (AGI) in 2012: $53,573 (Individual Income Tax Returns)
Here:
$53,573
State:
$55,609
Salary/wage: $48,374 (reported on 83.1% of returns)
Here:
$48,374
State:
$46,782
(% of AGI for various income ranges: 66.3% for AGIs below $25k, 74.0% for AGIs $25k-50k, 78.4% for AGIs $50k-75k, 82.3% for AGIs $75k-100k, 80.5% for AGIs $100k-200k, 50.4% for AGIs over 200k)
Taxable interest for individuals: $1,009 (reported on 44.5% of returns)
This zip code:
$1,009
Michigan:
$1,491
(% of AGI for various income ranges: 1.8% for AGIs below $25k, 0.9% for AGIs $25k-50k, 0.6% for AGIs $50k-75k, 0.4% for AGIs $75k-100k, 0.6% for AGIs $100k-200k, 1.8% for AGIs over 200k)
Ordinary dividends: $2,943 (reported on 24.0% of returns)
Here:
$2,943
State:
$6,225
(% of AGI for various income ranges: 2.8% for AGIs below $25k, 1.3% for AGIs $25k-50k, 1.0% for AGIs $50k-75k, 0.7% for AGIs $75k-100k, 1.1% for AGIs $100k-200k, 2.6% for AGIs over 200k)
Net capital gain/loss in AGI: +$6,068 (reported on 17.8% of returns)
Here:
+$6,068
State:
+$9,326
(% of AGI for various income ranges: 0.2% for AGIs $25k-50k, 0.3% for AGIs $50k-75k, 0.3% for AGIs $75k-100k, 0.8% for AGIs $100k-200k, 14.8% for AGIs over 200k)
Profit/loss from business: +$11,339 (reported on 14.4% of returns)
Here:
+$11,339
State:
+$11,523
(% of AGI for various income ranges: 4.9% for AGIs below $25k, 3.1% for AGIs $25k-50k, 3.0% for AGIs $50k-75k, 2.5% for AGIs $75k-100k, 2.5% for AGIs $100k-200k, 4.3% for AGIs over 200k)
Taxable individual retirement arrangement distribution: $12,609 (reported on 15.6% of returns)
49428:
$12,609
Michigan:
$15,298
(% of AGI for various income ranges: 8.3% for AGIs below $25k, 4.7% for AGIs $25k-50k, 3.0% for AGIs $50k-75k, 3.1% for AGIs $75k-100k, 3.4% for AGIs $100k-200k, 2.5% for AGIs over 200k)
Self-employment retirement plans: $19,817 (reported on 0.5% of returns)
49428:
$19,817
Michigan:
$20,834
Total itemized deductions: $18,654 (20% of AGI, reported on 35.1% of returns)
Here:
$18,654
State:
$21,628
Here:
20.3% of AGI
State:
18.4% of AGI
(% of AGI for various income ranges: 10.4% for AGIs below $25k, 10.9% for AGIs $25k-50k, 11.3% for AGIs $50k-75k, 12.6% for AGIs $75k-100k, 14.1% for AGIs $100k-200k, 11.8% for AGIs over 200k)
Charity contributions: $4,940 (reported on 30.8% of returns)
Here:
$4,940
State:
$4,225
(% of AGI for various income ranges: 1.7% for AGIs below $25k, 1.9% for AGIs $25k-50k, 2.4% for AGIs $50k-75k, 2.9% for AGIs $75k-100k, 3.6% for AGIs $100k-200k, 3.7% for AGIs over 200k)
Taxes paid: $6,259 (reported on 35.0% of returns)
49428:
$6,259
State:
$8,327
(% of AGI for various income ranges: 1.8% for AGIs below $25k, 2.7% for AGIs $25k-50k, 3.3% for AGIs $50k-75k, 4.3% for AGIs $75k-100k, 5.4% for AGIs $100k-200k, 5.3% for AGIs over 200k)
Earned income credit: $1,946 (reported on 10.1% of returns)
Here:
$1,946
State:
$2,306
(% of AGI for various income ranges: 3.1% for AGIs below $25k, 1.0% for AGIs $25k-50k)
Percentage of individuals using paid preparers for their 2012 taxes: 51.5%
Here:
51%
State:
57%
(% for various income ranges: 48.4% for AGIs below $25k, 52.4% for AGIs $25k-50k, 53.0% for AGIs $50k-75k, 51.3% for AGIs $75k-100k, 53.4% for AGIs $100k-200k, 80.0% for AGIs over 200k)
Averages for the 2004 tax year for zip code 49428, filed in 2005:
Average Adjusted Gross Income (AGI) in 2004: $47,581 (Individual Income Tax Returns)
Here:
$47,581
State:
$48,204
Salary/wage: $43,480 (reported on 86.2% of returns)
Here:
$43,480
State:
$42,791
(% of AGI for various income ranges: 94.3% for AGIs below $10k, 67.6% for AGIs $10k-25k, 77.6% for AGIs $25k-50k, 84.8% for AGIs $50k-75k, 86.4% for AGIs $75k-100k, 69.7% for AGIs over 100k)
Taxable interest for individuals: $1,329 (reported on 56.2% of returns)
This zip code:
$1,329
Michigan:
$1,725
(% of AGI for various income ranges: 6.5% for AGIs below $10k, 3.8% for AGIs $10k-25k, 1.8% for AGIs $25k-50k, 0.9% for AGIs $50k-75k, 0.8% for AGIs $75k-100k, 1.9% for AGIs over 100k)
Taxable dividends: $1,956 (reported on 30.2% of returns)
Here:
$1,956
State:
$3,420
(% of AGI for various income ranges: 5.0% for AGIs below $10k, 2.9% for AGIs $10k-25k, 1.2% for AGIs $25k-50k, 0.6% for AGIs $50k-75k, 0.7% for AGIs $75k-100k, 1.7% for AGIs over 100k)
Net capital gain/loss: +$5,636 (reported on 22.2% of returns)
Here:
+$5,636
State:
+$8,532
(% of AGI for various income ranges: -1.6% for AGIs below $10k, 0.3% for AGIs $10k-25k, 0.2% for AGIs $25k-50k, 0.6% for AGIs $50k-75k, 1.2% for AGIs $75k-100k, 7.8% for AGIs over 100k)
Profit/loss from business: +$11,758 (reported on 15.3% of returns)
Here:
+$11,758
State:
+$9,547
(% of AGI for various income ranges: 3.0% for AGIs below $10k, 3.6% for AGIs $10k-25k, 4.2% for AGIs $25k-50k, 3.3% for AGIs $50k-75k, 2.5% for AGIs $75k-100k, 5.0% for AGIs over 100k)
IRA payment deduction: $3,155 (reported on 2.7% of returns)
49428:
$3,155
Michigan:
$2,875
(% of AGI for various income ranges: 0.2% for AGIs $10k-25k, 0.4% for AGIs $25k-50k, 0.2% for AGIs $50k-75k, 0.1% for AGIs $75k-100k, 0.1% for AGIs over 100k)
Self-employed pension: $10,319 (reported on 0.8% of returns)
Here:
$10,319
Michigan:
$13,826
(% of AGI for various income ranges: 0.2% for AGIs $25k-50k, 0.0% for AGIs $50k-75k, 0.1% for AGIs $75k-100k, 0.4% for AGIs over 100k)
Total itemized deductions: $16,676 (22% of AGI, reported on 44.4% of returns)
Here:
$16,676
State:
$18,509
Here:
22.2% of AGI
State:
20.7% of AGI
(% of AGI for various income ranges: 14.7% for AGIs below $10k, 13.7% for AGIs $10k-25k, 15.4% for AGIs $25k-50k, 16.1% for AGIs $50k-75k, 16.2% for AGIs $75k-100k, 15.2% for AGIs over 100k)
Charity contributions deductions: $4,282 (6% of AGI, reported on 41.0% of returns)
Here:
$4,282
State:
$3,365
Here:
5.5% of AGI
State:
3.6% of AGI
(% of AGI for various income ranges: 1.7% for AGIs below $10k, 2.5% for AGIs $10k-25k, 3.2% for AGIs $25k-50k, 3.5% for AGIs $50k-75k, 3.8% for AGIs $75k-100k, 4.5% for AGIs over 100k)
Total tax: $6,089 (reported on 78.2% of returns)
49428:
$6,089
State:
$7,691
(% of AGI for various income ranges: 2.7% for AGIs below $10k, 4.3% for AGIs $10k-25k, 6.4% for AGIs $25k-50k, 7.6% for AGIs $50k-75k, 9.5% for AGIs $75k-100k, 16.5% for AGIs over 100k)
Earned income credit: $1,488 (reported on 5.9% of returns)
Here:
$1,488
State:
$1,737
Percentage of individuals using paid preparers for their 2004 taxes: 51.1%
Here:
51%
State:
60%
(% for various income ranges: 42.1% for AGIs below $10k, 50.8% for AGIs $10k-25k, 54.7% for AGIs $25k-50k, 52.7% for AGIs $50k-75k, 52.8% for AGIs $75k-100k, 58.2% for AGIs over 100k)
Likely homosexual households (counted as self-reported same-sex unmarried-partner households)
Lesbian couples: 0.1% of all households
Gay men: 0.3% of all households
Household received Food Stamps/SNAP in the past 12 months: 206 Household did not receive Food Stamps/SNAP in the past 12 months: 10,109
Women who had a birth in the past 12 months: 452 (423 now married, 38 unmarried) Women who did not have a birth in the past 12 months: 5,056 (3,082 now married, 1,949 unmarried)
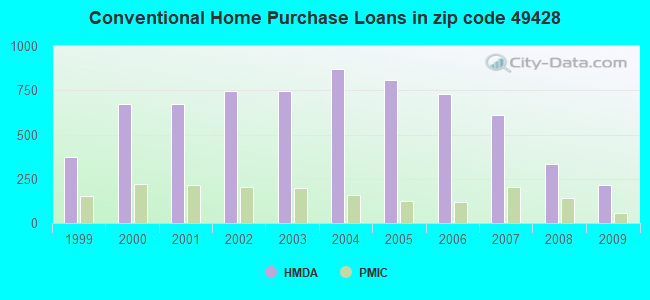
Housing units in zip code 49428 with a mortgage: 5,830 (706 second mortgage, 645 both second mortgage and home equity loan) Houses without a mortgage: 449
Median monthly owner costs for units with a mortgage: $1,407 Median monthly owner costs for units without a mortgage: $500
Residents with income below the poverty level in 2022:
This zip code:
4.7%
Whole state:
13.4%
Residents with income below 50% of the poverty level in 2022:
This zip code:
2.7%
Whole state:
6.9%
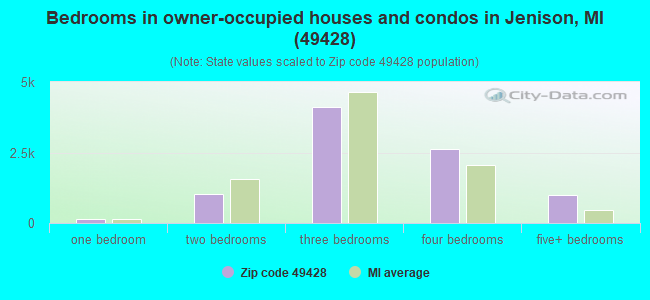
Median number of rooms in houses and condos:
Here:
7.3
State:
6.5
Median number of rooms in apartments:
Here:
3.6
State:
4.3
Notable locations in this zip code not listed on our city pages
Notable locations in zip code 49428: Jenison Station (A), Jenison Plaza (B), Wallinwood Springs Golf Club (C), Georgetown Township Fire Department Station 1 (D), Georgetown Township Fire Department Station 2 (E). Display/hide their locations on the map
Churches in zip code 49428 include: First Christian Reformed Church (A), Jenison Christian Church (B), Fellowship Covenant Church (C), Jenison Baptist Temple (D), Cottonwood Heights Christian Church (E), First Jenison Christian Reformed Church (F), Twelfth Avenue Christian Church (G), Ridgewood Christian Reformed Church (H), Rock of Ages Evangelical Lutheran Church (I). Display/hide their locations on the map
5,854 married couples with children.
845 single-parent households (302 men, 543 women).
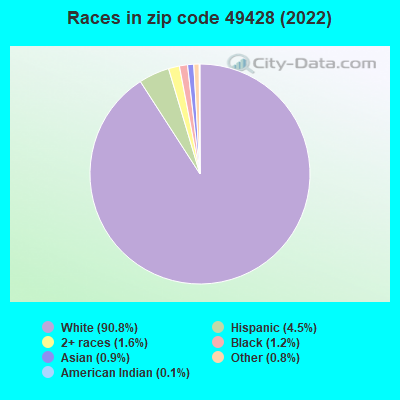
96.2% of residents of 49428 zip code speak English at home.
2.6% of residents speak Spanish at home (68% very well, 20% well, 12% not well).
0.7% of residents speak other Indo-European language at home (100% very well).
0.4% of residents speak Asian or Pacific Island language at home (94% very well, 6% well).
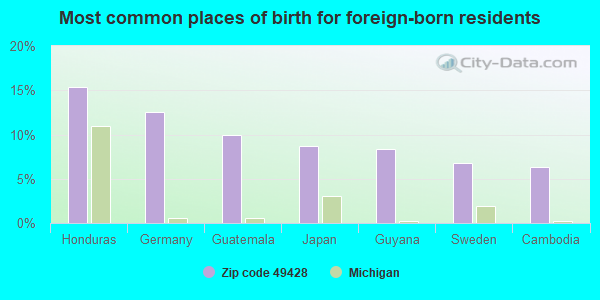
Foreign born population: 790 (2.9%) (80.2% of them are naturalized citizens)
This zip code:
2.9%
Whole state:
6.9%
15%Honduras
13%Germany
10%Guatemala
9%Japan
8%Guyana
7%Sweden
6%Cambodia
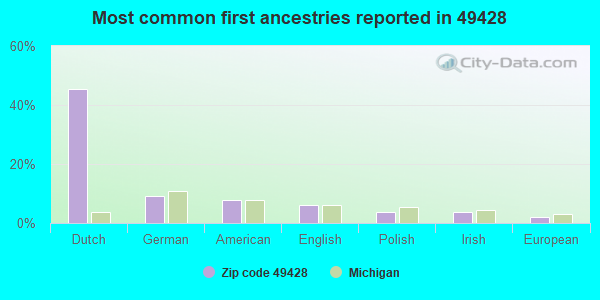
45%Dutch
9%German
8%American
6%English
4%Polish
4%Irish
2%European
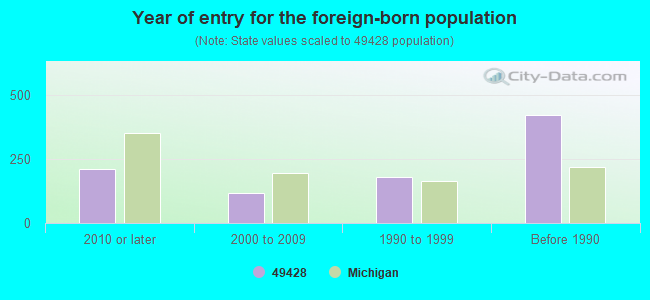
Year of entry for the foreign-born population
2092010 or later
1162000 to 2009
1781990 to 1999
421Before 1990
Major facilities with environmental interests located in this zip code:
BAUERWOOD SCHOOL (1443 BAUER ROAD in JENISON, MI)
(National Center for Education Statistics) - STATE ID-00225 Organizations: JENISON PUBLIC SCHOOLS (SCHOOL DISTRICT)
AUTOZONE INC (7500 COTTONWOOD DR in JENISON, MI)
Conditionally Exempt Small Quantity Generators, less than 100 kg/month of hazardous waste (Resource Conservation and Recovery Act (tracking hazardous waste)) Organizations: JENISON PARTNERS LLC (CONTACT/OWNER)
MI DEPT/ENVIRONMENTAL QUALITY (6680 WILSHERE in JENISON, MI)
(Resource Conservation and Recovery Act (tracking hazardous waste)) Alternative names: ROZEMA WASTE GARAGE MDNR
FLEET IMAGE OF GRAND RAPIDS (6549 WILSHERE in JENISON, MI)
(Resource Conservation and Recovery Act (tracking hazardous waste))
GEORGETOWN CONSTRUCTION CO. (6601 WILSHERE in JENISON, MI)
National Pollutant Discharge Elimination System NON-MAJOR (Tracking pollutant discharge elimination systems) - permit
GEORGETOWN DAMPPROOFING (672 CHICAGO DR in JENISON, MI)
(Resource Conservation and Recovery Act (tracking hazardous waste))
DODGEN AIRCRAFT REF INC (805 TAYLOR ST in JENISON, MI)
(Resource Conservation and Recovery Act (tracking hazardous waste))
EAGLES EYE GRAPHICS LLC (02050 CHICAGO DRIVE in JENISON, MI)
Conditionally Exempt Small Quantity Generators, less than 100 kg/month of hazardous waste (Resource Conservation and Recovery Act (tracking hazardous waste)) Business NAICS classification: MEN'S AND BOYS' CUT AND SEW SHIRT (EXCEPT WORK SHIRT) MANUFACTURING. Organizations: TIMOTHY G ROUGHLY (CONTACT/OWNER)
EFFECTIVE FLOW IDEAS (01765 CHICAGO DR in JENISON, MI)
(Resource Conservation and Recovery Act (tracking hazardous waste))
ENDLESS DESIGN (2720 EDWARD ST in JENISON, MI)
(Resource Conservation and Recovery Act (tracking hazardous waste))
FABRI-TECH INC (6719 PINE RIDGE COURT in JENISON, MI)
Conditionally Exempt Small Quantity Generators, less than 100 kg/month of hazardous waste (Resource Conservation and Recovery Act (tracking hazardous waste)) Organizations: DAN HOLTROP (CONTACT/OPERATOR)
ACTION COLLISION SERVICE INC (2417 PORT SHELDON RD in JENISON, MI)
Conditionally Exempt Small Quantity Generators, less than 100 kg/month of hazardous waste (Resource Conservation and Recovery Act (tracking hazardous waste)) Organizations: R KNOTT & D MOELKER (CONTACT/OWNER)
ACTION TRUCK AND AUTO COLLISION SVC (6665 MARCAN in JENISON, MI)
Conditionally Exempt Small Quantity Generators, less than 100 kg/month of hazardous waste (Resource Conservation and Recovery Act (tracking hazardous waste)) - notification Organizations: ROBERT KNOTT AND DAVE MOELKER (CONTACT/OPERATOR)
Housing units lacking complete plumbing facilities: 0.5% Housing units lacking complete kitchen facilities: 1.2%
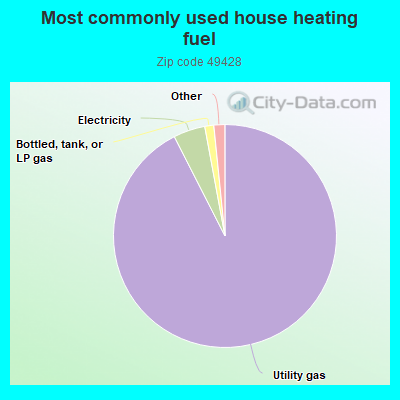
92.5%Utility gas
4.6%Electricity
1.3%Bottled, tank, or LP gas
0.6%No fuel used
0.5%Wood
Population in 1990: 23,358. Population change in the 1990s: +1,094 (+4.7%).
Place of birth for U.S.-born residents:
This state: 23,406
Northeast: 331
Midwest: 1,959
South: 696
West: 345
63% of the 49428 zip code residents lived in the same house 5 years ago. Out of people who lived in different houses, 42% lived in this county. Out of people who lived in different counties, 50% lived in Michigan.
94% of the 49428 zip code residents lived in the same house 1 year ago. Out of people who lived in different houses, 38% moved from this county. Out of people who lived in different houses, 50% moved from different county within same state. Out of people who lived in different houses, 15% moved from different state.
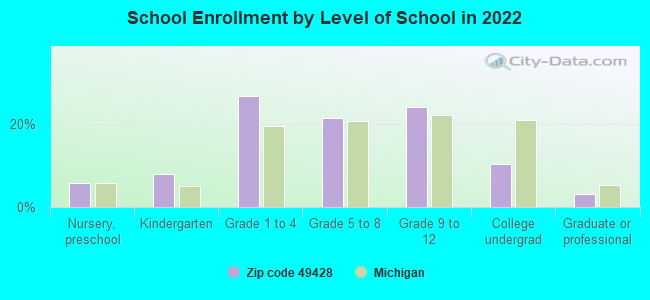
Private vs. public school enrollment:
Students in private schools in grades 1 to 8 (elementary and middle school): 548
Here:
16.9%
Michigan:
12.4%
Students in private schools in grades 9 to 12 (high school): 337
Here:
20.9%
Michigan:
9.8%
Students in private undergraduate colleges: 140
Here:
20.4%
Michigan:
14.9%
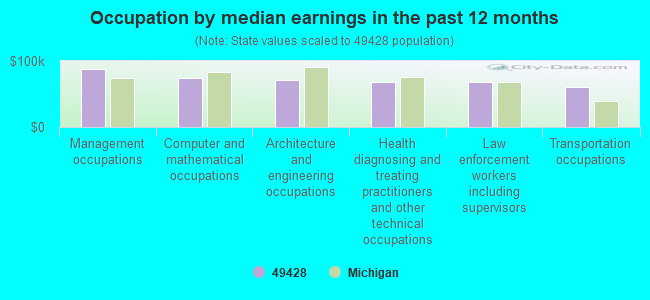
Occupation by median earnings in the past 12 months ($)
88,409Management occupations
74,206Computer and mathematical occupations
71,786Architecture and engineering occupations
67,959Health diagnosing and treating practitioners and other technical occupations
67,754Law enforcement workers including supervisors
61,210Transportation occupations
Companies with federal contracts located in this zip code (JENISON, MI):
GLUCO INC (705 PLUM INDUSTRIAL COURT; small business)
$63,160 with Navy for Miscellaneous Special Industry Machinery. Signed on 2000-09-29. Completion date: 2000-10-02.
GREAT LAKES SYSTEMS, INC (2286 PORT SHELDON COURT; small business) : $59,080 in 2 contractsfrom 2001 to 2002
$31,150 with Navy for Maintenance, Repair or Alteration of Real Property -- Other Administrative Facilities and Service Buildings. Signed on 2001-09-27. Completion date: 2001-12-12.
$27,930, same as above.Signed on 2002-04-11. Completion date: 2002-05-25.
INTELLIGENT OFFICE PRODUCTS (7310 WINDGATE DR; small business)
$44,363 with Army for Miscellaneous Construction Materials. Signed on 2002-08-01. Completion date: 2002-09-03.
VISUAL WORKPLACE LLC (6578 ROGER DRIVE; small business)
$4,991 with Navy for Signs, Advertising Displays, and Identification Plates. Taking place in FL. Signed on 2004-08-11. Completion date: 2004-08-11.
BETTER BOLTING, INC (8278 BIRCHWOOD AVE; small business)
$4,675 with Army for Hand Tools, Power Driven. Signed on 2004-08-12. Completion date: 2004-08-26.
Top industries in this zip code by the number of employees in 2005:
2002 - 2018 National Fire Incident Reporting System (NFIRS) incidents
Based on the data from the years 2002 - 2018 the average number of fire incidents per year is 27. The highest number of reported fires - 52 took place in 2003, and the least - 5 in 2006. The data has a growing trend.
When looking into fire subcategories, the most incidents belonged to: Structure Fires (52.0%), and Outside Fires (24.4%).
Fire incident types reported to NFIRS in Zip Code 49428


 Nearest zip codes: 49534, 49426, 49418, 49435, 49401, 49519.
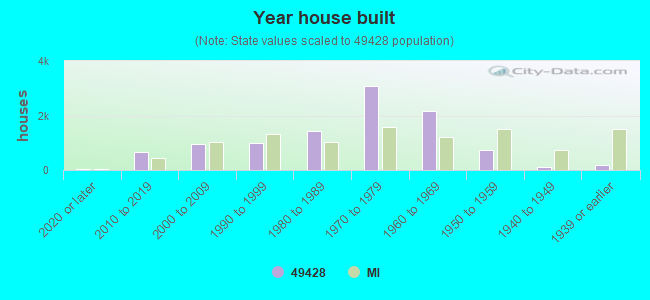


 Based on the data from the years 2002 - 2018 the average number of fire incidents per year is 27. The highest number of reported fires - 52 took place in 2003, and the least - 5 in 2006. The data has a growing trend.
 When looking into fire subcategories, the most incidents belonged to: Structure Fires (52.0%), and Outside Fires (24.4%).