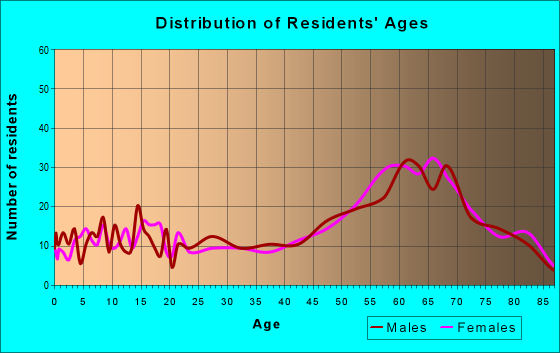
Estimated zip code population in 2022: 2,696 Zip code population in 2010: 2,675 Zip code population in 2000: 2,800
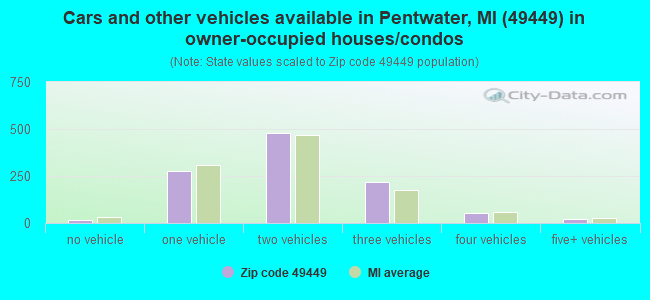
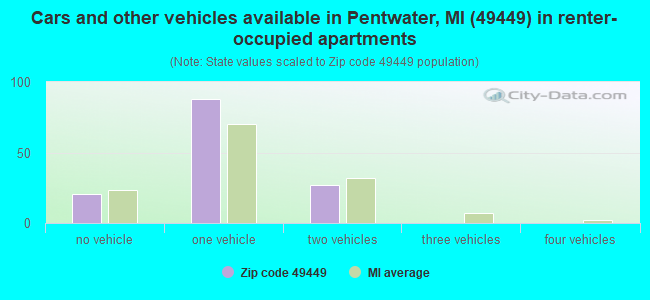
Houses and condos: 2,596 Renter-occupied apartments: 134
% of renters here:
11%
State:
27%
March 2022 cost of living index in zip code 49449: 81.8 (low, U.S. average is 100)
Land area: 40.2 sq. mi. Water area: 9.5 sq. mi.
Population density: 67 people per square mile
(very low).
OSM Map
General Map
Google Map
MSN Map
OSM Map
General Map
Google Map
MSN Map
OSM Map
General Map
Google Map
MSN Map
OSM Map
General Map
Google Map
MSN Map
Please wait while loading the map...
Real estate property taxes paid for housing units in 2022:
This zip code:
1.1% ($3,265)
Michigan:
1.2% ($2,746)
Median real estate property taxes paid for housing units with mortgages in 2022: $3,264 (1.0%) Median real estate property taxes paid for housing units with no mortgage in 2022: $3,292 (1.2%)
Averages for the 2020 tax year for zip code 49449, filed in 2021:
Average Adjusted Gross Income (AGI) in 2020: $69,402 (Individual Income Tax Returns)
Here:
$69,402
State:
$68,945
Salary/wage: $49,444 (reported on 61.5% of returns)
Here:
$49,444
State:
$57,142
(% of AGI for various income ranges: 921.9% for AGIs below $25k, 2502.1% for AGIs $25k-50k, 4796.9% for AGIs $50k-75k, 6672.5% for AGIs $75k-100k, 9795.7% for AGIs $100k-200k)
Taxable interest for individuals: $1,499 (reported on 45.3% of returns)
This zip code:
$1,499
Michigan:
$1,630
(% of AGI for various income ranges: 36.9% for AGIs below $25k, 60.8% for AGIs $25k-50k, 99.2% for AGIs $50k-75k, 150.0% for AGIs $75k-100k, 180.7% for AGIs $100k-200k)
Ordinary dividends: $5,850 (reported on 33.8% of returns)
Here:
$5,850
State:
$6,972
(% of AGI for various income ranges: 77.3% for AGIs below $25k, 100.4% for AGIs $25k-50k, 146.2% for AGIs $50k-75k, 460.0% for AGIs $75k-100k, 620.0% for AGIs $100k-200k)
Net capital gain/loss in AGI: +$15,716 (reported on 30.4% of returns)
Here:
+$15,716
State:
+$20,064
(% of AGI for various income ranges: 28.5% for AGIs below $25k, 45.4% for AGIs $25k-50k, 166.9% for AGIs $50k-75k, 646.2% for AGIs $75k-100k, 1286.4% for AGIs $100k-200k)
Profit/loss from business: +$9,433 (reported on 16.2% of returns)
Here:
+$9,433
State:
+$11,172
(% of AGI for various income ranges: 108.1% for AGIs below $25k, 124.2% for AGIs $25k-50k, 275.4% for AGIs $50k-75k, 550.0% for AGIs $75k-100k, 496.4% for AGIs $100k-200k)
Taxable individual retirement arrangement distribution: $22,538 (reported on 25.0% of returns)
49449:
$22,538
Michigan:
$19,803
(% of AGI for various income ranges: 248.1% for AGIs below $25k, 420.4% for AGIs $25k-50k, 456.2% for AGIs $50k-75k, 1862.5% for AGIs $75k-100k, 2372.1% for AGIs $100k-200k)
Total itemized deductions: $38,136 (reported on 7.4% of returns)
Here:
$38,136
State:
$34,117
(% of AGI for various income ranges: 201.5% for AGIs below $25k, 556.2% for AGIs $50k-75k, 1008.6% for AGIs $100k-200k)
Charity contributions: $7,780 (reported on 6.8% of returns)
Here:
$7,780
State:
$13,548
(% of AGI for various income ranges: 113.1% for AGIs $50k-75k, 302.9% for AGIs $100k-200k)
Taxes paid: $7,618 (reported on 7.4% of returns)
49449:
$7,618
State:
$7,972
(% of AGI for various income ranges: 46.9% for AGIs below $25k, 120.8% for AGIs $50k-75k, 243.6% for AGIs $100k-200k)
Earned income credit: $1,918 (reported on 11.5% of returns)
Here:
$1,918
State:
$2,251
(% of AGI for various income ranges: 70.4% for AGIs below $25k, 59.6% for AGIs $25k-50k)
Percentage of individuals using paid preparers for their 2020 taxes: 93.9%
Here:
94%
State:
93%
(% for various income ranges: 91.8% for AGIs below $25k, 93.9% for AGIs $25k-50k, 94.7% for AGIs $50k-75k, 100.0% for AGIs $75k-100k, 92.0% for AGIs $100k-200k, 100.0% for AGIs over 200k)
Averages for the 2012 tax year for zip code 49449, filed in 2013:
Average Adjusted Gross Income (AGI) in 2012: $54,718 (Individual Income Tax Returns)
Here:
$54,718
State:
$55,609
Salary/wage: $38,062 (reported on 66.7% of returns)
Here:
$38,062
State:
$46,782
(% of AGI for various income ranges: 55.4% for AGIs below $25k, 53.4% for AGIs $25k-50k, 49.4% for AGIs $50k-75k, 47.5% for AGIs $75k-100k, 44.1% for AGIs $100k-200k, 37.6% for AGIs over 200k)
Taxable interest for individuals: $1,712 (reported on 44.4% of returns)
This zip code:
$1,712
Michigan:
$1,491
(% of AGI for various income ranges: 2.2% for AGIs below $25k, 2.0% for AGIs $25k-50k, 0.7% for AGIs $50k-75k, 1.5% for AGIs $75k-100k, 1.8% for AGIs $100k-200k, 0.6% for AGIs over 200k)
Ordinary dividends: $6,228 (reported on 29.6% of returns)
Here:
$6,228
State:
$6,225
(% of AGI for various income ranges: 4.0% for AGIs below $25k, 2.4% for AGIs $25k-50k, 2.7% for AGIs $50k-75k, 2.6% for AGIs $75k-100k, 4.4% for AGIs $100k-200k, 3.7% for AGIs over 200k)
Net capital gain/loss in AGI: +$6,014 (reported on 26.7% of returns)
Here:
+$6,014
State:
+$9,326
(% of AGI for various income ranges: 0.2% for AGIs $25k-50k, 0.4% for AGIs $50k-75k, 1.6% for AGIs $75k-100k, 3.6% for AGIs $100k-200k, 8.1% for AGIs over 200k)
Profit/loss from business: +$10,716 (reported on 18.5% of returns)
Here:
+$10,716
State:
+$11,523
(% of AGI for various income ranges: 5.8% for AGIs below $25k, 4.2% for AGIs $25k-50k, 3.5% for AGIs $50k-75k, 2.6% for AGIs $75k-100k, 6.3% for AGIs $100k-200k)
Taxable individual retirement arrangement distribution: $17,945 (reported on 21.5% of returns)
49449:
$17,945
Michigan:
$15,298
(% of AGI for various income ranges: 7.8% for AGIs below $25k, 6.6% for AGIs $25k-50k, 5.6% for AGIs $50k-75k, 9.0% for AGIs $75k-100k, 12.9% for AGIs $100k-200k)
Total itemized deductions: $24,213 (24% of AGI, reported on 33.3% of returns)
Here:
$24,213
State:
$21,628
Here:
23.9% of AGI
State:
18.4% of AGI
(% of AGI for various income ranges: 19.1% for AGIs below $25k, 13.3% for AGIs $25k-50k, 13.7% for AGIs $50k-75k, 14.0% for AGIs $75k-100k, 14.9% for AGIs $100k-200k, 15.1% for AGIs over 200k)
Charity contributions: $4,444 (reported on 28.9% of returns)
Here:
$4,444
State:
$4,225
(% of AGI for various income ranges: 1.6% for AGIs below $25k, 1.8% for AGIs $25k-50k, 1.9% for AGIs $50k-75k, 2.2% for AGIs $75k-100k, 2.6% for AGIs $100k-200k, 3.1% for AGIs over 200k)
Taxes paid: $8,540 (reported on 33.3% of returns)
49449:
$8,540
State:
$8,327
(% of AGI for various income ranges: 4.5% for AGIs below $25k, 3.7% for AGIs $25k-50k, 4.8% for AGIs $50k-75k, 5.2% for AGIs $75k-100k, 6.2% for AGIs $100k-200k, 5.8% for AGIs over 200k)
Earned income credit: $1,884 (reported on 14.1% of returns)
Here:
$1,884
State:
$2,306
(% of AGI for various income ranges: 4.0% for AGIs below $25k, 1.0% for AGIs $25k-50k)
Percentage of individuals using paid preparers for their 2012 taxes: 63.0%
Here:
63%
State:
57%
(% for various income ranges: 53.6% for AGIs below $25k, 62.1% for AGIs $25k-50k, 70.0% for AGIs $50k-75k, 75.0% for AGIs $75k-100k, 78.6% for AGIs $100k-200k, 75.0% for AGIs over 200k)
Averages for the 2004 tax year for zip code 49449, filed in 2005:
Average Adjusted Gross Income (AGI) in 2004: $40,956 (Individual Income Tax Returns)
Here:
$40,956
State:
$48,204
Salary/wage: $29,755 (reported on 71.9% of returns)
Here:
$29,755
State:
$42,791
(% of AGI for various income ranges: 136.8% for AGIs below $10k, 57.4% for AGIs $10k-25k, 61.6% for AGIs $25k-50k, 52.6% for AGIs $50k-75k, 52.3% for AGIs $75k-100k, 39.6% for AGIs over 100k)
Taxable interest for individuals: $2,483 (reported on 57.4% of returns)
This zip code:
$2,483
Michigan:
$1,725
(% of AGI for various income ranges: 12.9% for AGIs below $10k, 5.2% for AGIs $10k-25k, 2.4% for AGIs $25k-50k, 2.9% for AGIs $50k-75k, 4.2% for AGIs $75k-100k, 3.1% for AGIs over 100k)
Taxable dividends: $4,829 (reported on 35.5% of returns)
Here:
$4,829
State:
$3,420
(% of AGI for various income ranges: 12.5% for AGIs below $10k, 4.5% for AGIs $10k-25k, 3.2% for AGIs $25k-50k, 3.1% for AGIs $50k-75k, 2.4% for AGIs $75k-100k, 6.1% for AGIs over 100k)
Net capital gain/loss: +$8,067 (reported on 28.3% of returns)
Here:
+$8,067
State:
+$8,532
(% of AGI for various income ranges: -6.9% for AGIs below $10k, -1.1% for AGIs $10k-25k, -0.2% for AGIs $25k-50k, 2.8% for AGIs $50k-75k, 6.9% for AGIs $75k-100k, 13.5% for AGIs over 100k)
Profit/loss from business: +$7,071 (reported on 18.6% of returns)
Here:
+$7,071
State:
+$9,547
(% of AGI for various income ranges: 5.8% for AGIs below $10k, 5.8% for AGIs $10k-25k, 2.3% for AGIs $25k-50k, 1.9% for AGIs $50k-75k, 2.8% for AGIs $75k-100k, 4.0% for AGIs over 100k)
Profit/loss from farming: +$115 (reported on 1.9% of returns)
Here:
+$115
State:
-$4,492
IRA payment deduction: $2,950 (reported on 2.9% of returns)
49449:
$2,950
Michigan:
$2,875
Total itemized deductions: $18,522 (25% of AGI, reported on 31.5% of returns)
Here:
$18,522
State:
$18,509
Here:
25.3% of AGI
State:
20.7% of AGI
(% of AGI for various income ranges: 27.5% for AGIs below $10k, 11.3% for AGIs $10k-25k, 11.6% for AGIs $25k-50k, 15.2% for AGIs $50k-75k, 17.0% for AGIs $75k-100k, 14.1% for AGIs over 100k)
Charity contributions deductions: $3,891 (5% of AGI, reported on 27.6% of returns)
Here:
$3,891
State:
$3,365
Here:
5.0% of AGI
State:
3.6% of AGI
(% of AGI for various income ranges: 1.1% for AGIs below $10k, 1.0% for AGIs $10k-25k, 1.8% for AGIs $25k-50k, 2.0% for AGIs $50k-75k, 3.7% for AGIs $75k-100k, 3.6% for AGIs over 100k)
Total tax: $5,749 (reported on 73.8% of returns)
49449:
$5,749
State:
$7,691
(% of AGI for various income ranges: 4.5% for AGIs below $10k, 4.1% for AGIs $10k-25k, 6.6% for AGIs $25k-50k, 8.9% for AGIs $50k-75k, 10.1% for AGIs $75k-100k, 16.5% for AGIs over 100k)
Earned income credit: $1,614 (reported on 12.5% of returns)
Here:
$1,614
State:
$1,737
Percentage of individuals using paid preparers for their 2004 taxes: 62.1%
Here:
62%
State:
60%
(% for various income ranges: 48.6% for AGIs below $10k, 59.2% for AGIs $10k-25k, 64.6% for AGIs $25k-50k, 74.3% for AGIs $50k-75k, 70.9% for AGIs $75k-100k, 75.0% for AGIs over 100k)
Likely homosexual households (counted as self-reported same-sex unmarried-partner households)
Lesbian couples: 0.0% of all households
Gay men: 0.3% of all households
Household received Food Stamps/SNAP in the past 12 months: 125 Household did not receive Food Stamps/SNAP in the past 12 months: 1,067
Women who had a birth in the past 12 months: 7 (7 now married, 0 unmarried) Women who did not have a birth in the past 12 months: 407 (135 now married, 273 unmarried)
Housing units in zip code 49449 with a mortgage: 577 (71 second mortgage, 66 both second mortgage and home equity loan) Houses without a mortgage: 99
Median monthly owner costs for units with a mortgage: $1,461 Median monthly owner costs for units without a mortgage: $638
Residents with income below the poverty level in 2022:
This zip code:
10.1%
Whole state:
13.4%
Residents with income below 50% of the poverty level in 2022:
This zip code:
6.5%
Whole state:
6.9%
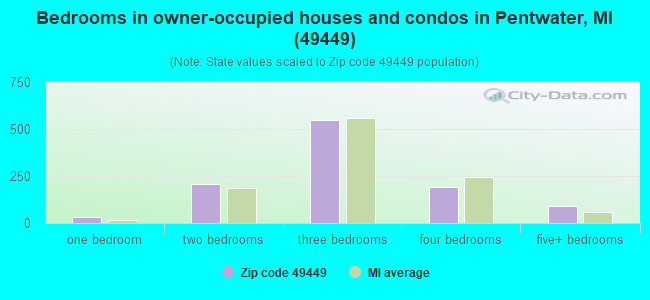
Median number of rooms in houses and condos:
Here:
6.6
State:
6.5
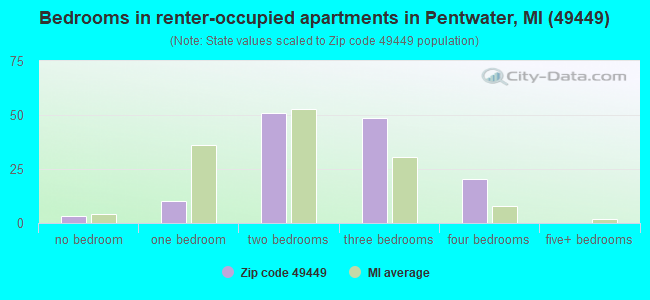
Median number of rooms in apartments:
Here:
4.3
State:
4.3
Notable locations in this zip code not listed on our city pages
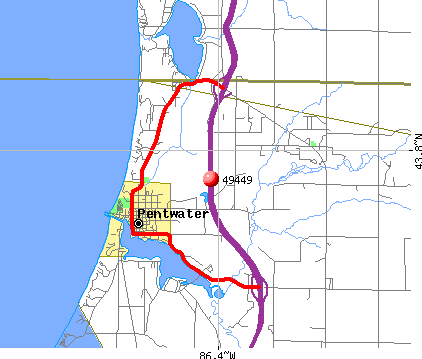
Notable locations in zip code 49449: Bucks Corners (A), Driftwood Golf Course (B), Whispering Surf Camping Resort (C), Mears State Park Campground (D), Hill and Hollow Campground (E), Snug Harbor Marina (F), River Farm Campground (G), Oceana County Emergency Ambulance Services Station 3 (H), Pentwater Township Library (I), Pentwater Fire Department (J), Pentwater Police Department (K). Display/hide their locations on the map
Churches in zip code 49449 include: Saint James Episcopal Church (A), Centenary United Methodist Church (B), Baptist Church of Pentwater (C), Lighthouse Lutheran Church (D), Lake Michigan United Methodist Church (E), Saint Vincents Church (F), Bethel Church (G). Display/hide their locations on the map
Streams, rivers, and creeks: Big Springs Creek (A), Kibby Creek (B), Watson Creek (C), Pentwater River (D), Lambricks Creek (E), Cedar Creek (F), Allen Drain (G), Quinn Creek (H), Dumaw Creek (I). Display/hide their locations on the map
Parks in zip code 49449 include: Charles Mears State Park (1), Rentwater River State Game Area (2), Village Green and Gazebo (3), Channel Lake Park (4), Veterans Day Storm Historical Marker (5), Graveyard of Ships Historical Marker (6). Display/hide their locations on the map
Size of family households: 610 2-persons, 130 3-persons, 78 4-persons, 28 5-persons, 28 6-persons, 7 7-or-more-persons
Size of nonfamily households: 249 1-person, 68 2-persons
206 married couples with children.
107 single-parent households (12 men, 95 women).
97.9% of residents of 49449 zip code speak English at home.
2.2% of residents speak Spanish at home (88% very well, 7% well, 5% not well).
0.5% of residents speak other Indo-European language at home (100% very well).
0.4% of residents speak Asian or Pacific Island language at home (100% very well).
0.1% of residents speak other language at home (100% very well).
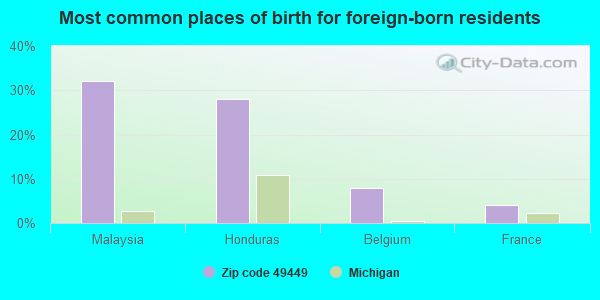
Foreign born population: 24 (0.9%) (53.3% of them are naturalized citizens)
This zip code:
0.9%
Whole state:
6.9%
32%Malaysia
28%Honduras
8%Belgium
4%France
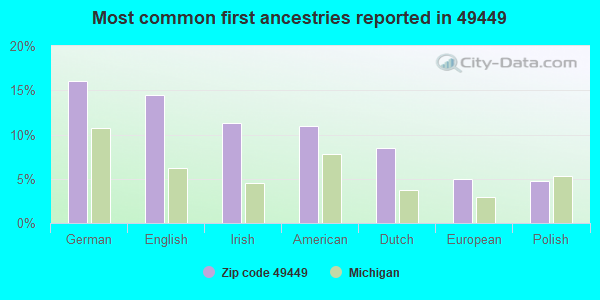
16%German
14%English
11%Irish
11%American
9%Dutch
5%European
5%Polish
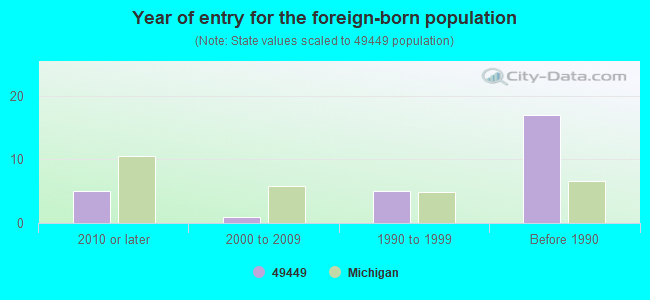
Year of entry for the foreign-born population
52010 or later
12000 to 2009
51990 to 1999
17Before 1990
Facilities with environmental interests located in this zip code:
ADAMS TRUCKING AND EXCAVATING (9109 N. 72ND in PENTWATER, MI)
(Resource Conservation and Recovery Act (tracking hazardous waste))
MI DEPT/STATE POLICE (6020 THIELE in PENTWATER, MI)
(Resource Conservation and Recovery Act (tracking hazardous waste)) Alternative names: MI DEPT/STATE POLICE (E)
Housing units lacking complete plumbing facilities: 1.1% Housing units lacking complete kitchen facilities: 1.1%
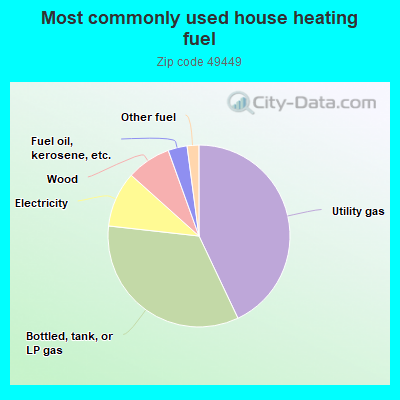
43.1%Utility gas
33.9%Bottled, tank, or LP gas
9.9%Electricity
7.9%Wood
3.4%Fuel oil, kerosene, etc.
2.1%Other fuel
Population in 1990: 3,915.
Place of birth for U.S.-born residents:
This state: 2,057
Northeast: 48
Midwest: 407
South: 102
West: 51
64% of the 49449 zip code residents lived in the same house 5 years ago. Out of people who lived in different houses, 39% lived in this county. Out of people who lived in different counties, 50% lived in Michigan.
95% of the 49449 zip code residents lived in the same house 1 year ago. Out of people who lived in different houses, 11% moved from this county. Out of people who lived in different houses, 52% moved from different county within same state. Out of people who lived in different houses, 44% moved from different state.
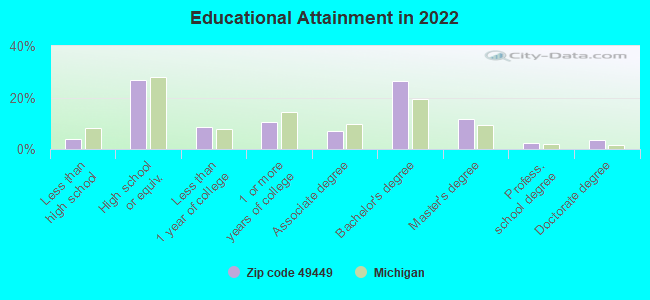
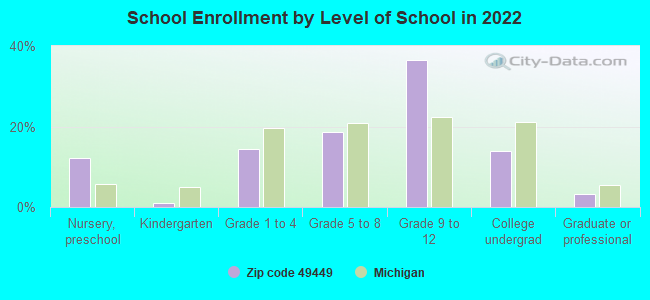
Private vs. public school enrollment:
Students in private schools in grades 1 to 8 (elementary and middle school): 21
Here:
17.1%
Michigan:
12.4%
Students in private schools in grades 9 to 12 (high school): 14
Here:
11.1%
Michigan:
9.8%
Students in private undergraduate colleges: 29
Here:
58.2%
Michigan:
14.9%
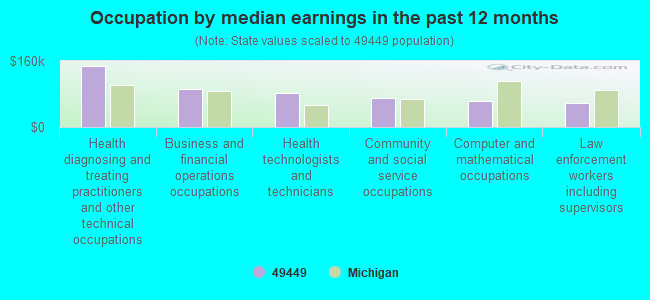
Occupation by median earnings in the past 12 months ($)
147,387Health diagnosing and treating practitioners and other technical occupations
92,755Business and financial operations occupations
81,624Health technologists and technicians
70,709Community and social service occupations
61,897Computer and mathematical occupations
57,442Law enforcement workers including supervisors
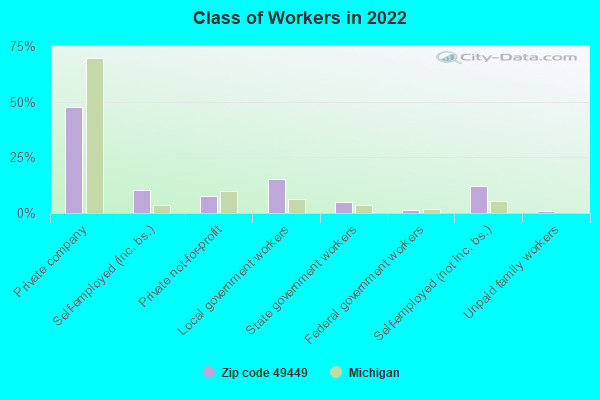
Top industries in this zip code by the number of employees in 2005:
Construction: New Single-Family Housing Construction (except Operative Builders) (10-19: 1, 1-4: 2)
Construction: Water and Sewer Line and Related Structures Construction (10-19: 1)
Health Care and Social Assistance: Offices of Physicians (except Mental Health Specialists) (10-19: 1)
Other Services (except Public Administration): Religious Organizations (5-9: 1, 1-4: 3)
Accommodation and Food Services: Limited-Service Restaurants (5-9: 1, 1-4: 2)
Arts, Entertainment, and Recreation: Marinas (5-9: 1, 1-4: 1)
People in group quarters in 2010:
8 people in group homes intended for adults
People in group quarters in 2000:
9 people in unknown juvenile institutions
6 people in homes for the mentally retarded
5 people in agriculture workers' dormitories on farms
Fatal accident statistics in 2013:
Fatal accident count: 1
Vehicles involved in fatal accidents: 1
Fatal accidents caused by drunken drivers: 0
Fatalities: 1
Persons involved in fatal accidents: 1
Pedestrians involved in fatal accidents: 0
2002 - 2018 National Fire Incident Reporting System (NFIRS) incidents
According to the data from the years 2002 - 2018 the average number of fire incidents per year is 11. The highest number of reported fire incidents - 20 took place in 2005, and the least - 0 in 2013. The data has a declining trend.
When looking into fire subcategories, the most incidents belonged to: Structure Fires (44.7%), and Outside Fires (35.1%).
Fire incident types reported to NFIRS in Zip Code 49449


+$115
-$4,492
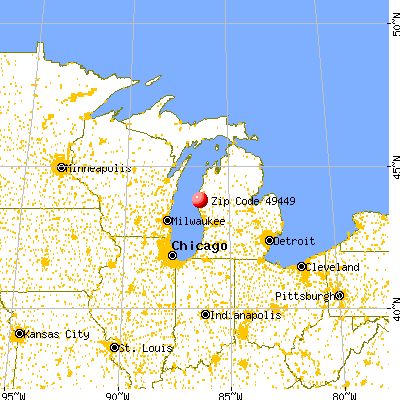
 Nearest zip codes: 49420, 49436, 49455, 49454, 49431, 49405.


 According to the data from the years 2002 - 2018 the average number of fire incidents per year is 11. The highest number of reported fire incidents - 20 took place in 2005, and the least - 0 in 2013. The data has a declining trend.
 When looking into fire subcategories, the most incidents belonged to: Structure Fires (44.7%), and Outside Fires (35.1%).