Estimated zip code population in 2022: 7,628 Zip code population in 2010: 7,665 Zip code population in 2000: 7,536
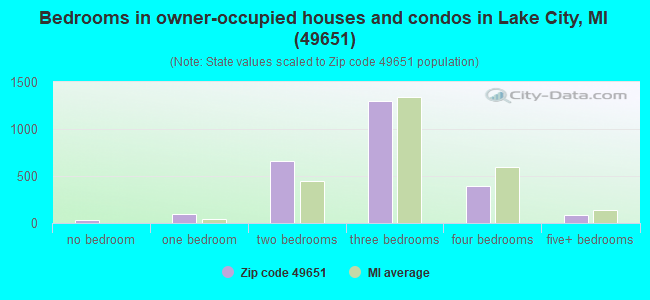
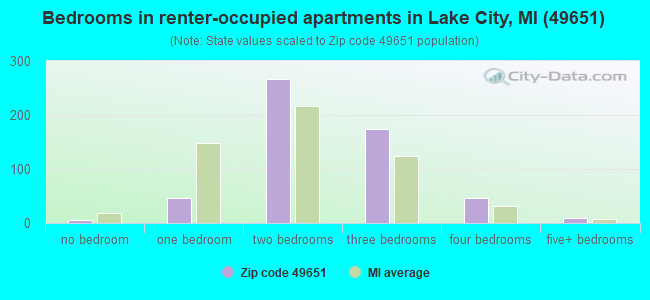
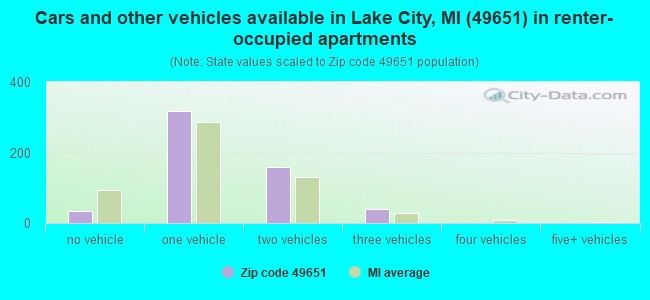
Houses and condos: 4,978 Renter-occupied apartments: 549
% of renters here:
18%
State:
27%
March 2022 cost of living index in zip code 49651: 81.5 (low, U.S. average is 100)
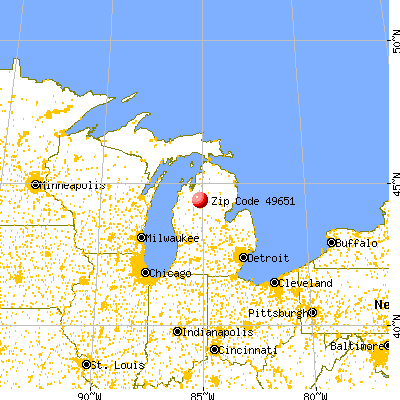
Land area: 223.7 sq. mi. Water area: 5.9 sq. mi.
Population density: 34 people per square mile
(very low).
OSM Map
General Map
Google Map
MSN Map
OSM Map
General Map
Google Map
MSN Map
OSM Map
General Map
Google Map
MSN Map
OSM Map
General Map
Google Map
MSN Map
Please wait while loading the map...
Real estate property taxes paid for housing units in 2022:
This zip code:
1.0% ($1,672)
Michigan:
1.2% ($2,746)
Median real estate property taxes paid for housing units with mortgages in 2022: $1,768 (0.9%) Median real estate property taxes paid for housing units with no mortgage in 2022: $1,591 (1.0%)
Business Search- 14 Million verified businesses
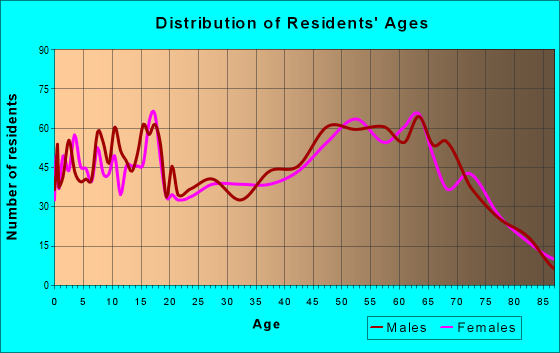
Males: 3,925
(51.5%)
Females: 3,703
(48.5%)
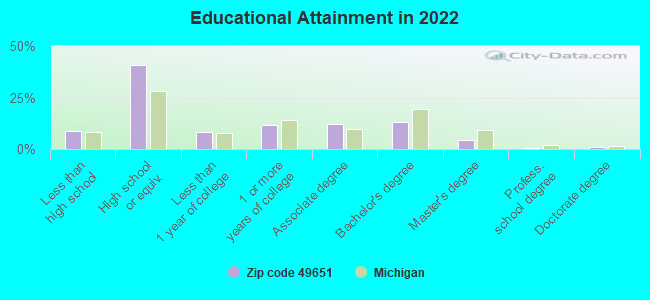
For population 25 years and over in 49651:
High school or higher: 90.9%
Bachelor's degree or higher: 18.7%
Graduate or professional degree: 5.8%
Unemployed: 4.9%
Mean travel time to work (commute): 26.4 minutes
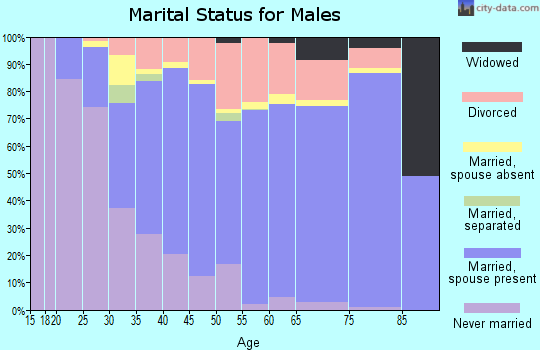
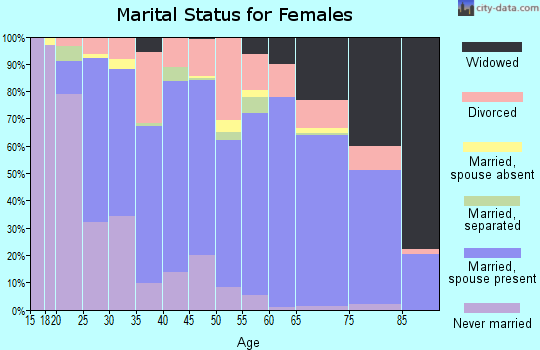
For population 15 years and over in 49651:
Never married: 20.7%
Now married: 56.6%
Separated: 0.9%
Widowed: 7.6%
Divorced: 14.1%
Zip code 49651 compared to state average:
Black race population percentage significantly below state average.
Hispanic race population percentage significantly below state average.
Median age above state average.
Foreign-born population percentage significantly below state average.
Renting percentage below state average.
Length of stay since moving in above state average.
Number of college students below state average.
Percentage of population with a bachelor's degree or higher below state average.
Averages for the 2020 tax year for zip code 49651, filed in 2021:
Average Adjusted Gross Income (AGI) in 2020: $48,242 (Individual Income Tax Returns)
Here:
$48,242
State:
$68,945
Salary/wage: $39,992 (reported on 73.6% of returns)
Here:
$39,992
State:
$57,142
(% of AGI for various income ranges: 946.1% for AGIs below $25k, 3092.3% for AGIs $25k-50k, 5984.7% for AGIs $50k-75k, 7830.9% for AGIs $75k-100k, 13599.5% for AGIs $100k-200k)
Taxable interest for individuals: $1,575 (reported on 26.9% of returns)
This zip code:
$1,575
Michigan:
$1,630
(% of AGI for various income ranges: 20.0% for AGIs below $25k, 25.9% for AGIs $25k-50k, 48.9% for AGIs $50k-75k, 47.8% for AGIs $75k-100k, 268.0% for AGIs $100k-200k)
Ordinary dividends: $4,691 (reported on 14.4% of returns)
Here:
$4,691
State:
$6,972
(% of AGI for various income ranges: 17.3% for AGIs below $25k, 30.7% for AGIs $25k-50k, 65.0% for AGIs $50k-75k, 122.6% for AGIs $75k-100k, 266.5% for AGIs $100k-200k)
Net capital gain/loss in AGI: +$16,727 (reported on 12.8% of returns)
Here:
+$16,727
State:
+$20,064
(% of AGI for various income ranges: 13.6% for AGIs below $25k, 53.1% for AGIs $25k-50k, 108.2% for AGIs $50k-75k, 405.2% for AGIs $75k-100k, 1387.5% for AGIs $100k-200k)
Profit/loss from business: +$9,942 (reported on 13.3% of returns)
Here:
+$9,942
State:
+$11,172
(% of AGI for various income ranges: 84.5% for AGIs below $25k, 73.6% for AGIs $25k-50k, 198.4% for AGIs $50k-75k, 249.1% for AGIs $75k-100k, 1111.0% for AGIs $100k-200k)
Taxable individual retirement arrangement distribution: $16,027 (reported on 11.7% of returns)
49651:
$16,027
Michigan:
$19,803
(% of AGI for various income ranges: 81.4% for AGIs below $25k, 113.0% for AGIs $25k-50k, 239.2% for AGIs $50k-75k, 575.7% for AGIs $75k-100k, 1550.0% for AGIs $100k-200k)
Total itemized deductions: $31,911 (reported on 2.4% of returns)
Here:
$31,911
State:
$34,117
(% of AGI for various income ranges: 47.5% for AGIs below $25k, 202.6% for AGIs $50k-75k, 823.0% for AGIs $100k-200k)
Charity contributions: $14,188 (reported on 2.1% of returns)
Here:
$14,188
State:
$13,548
(% of AGI for various income ranges: 65.8% for AGIs $50k-75k, 442.5% for AGIs $100k-200k)
Taxes paid: $6,822 (reported on 2.4% of returns)
49651:
$6,822
State:
$7,972
(% of AGI for various income ranges: 8.0% for AGIs below $25k, 43.2% for AGIs $50k-75k, 186.5% for AGIs $100k-200k)
Earned income credit: $2,170 (reported on 17.6% of returns)
Here:
$2,170
State:
$2,251
(% of AGI for various income ranges: 84.7% for AGIs below $25k, 74.6% for AGIs $25k-50k)
Percentage of individuals using paid preparers for their 2020 taxes: 93.6%
Here:
94%
State:
93%
(% for various income ranges: 91.6% for AGIs below $25k, 95.1% for AGIs $25k-50k, 94.5% for AGIs $50k-75k, 93.9% for AGIs $75k-100k, 94.3% for AGIs $100k-200k, 100.0% for AGIs over 200k)
Averages for the 2012 tax year for zip code 49651, filed in 2013:
Average Adjusted Gross Income (AGI) in 2012: $37,988 (Individual Income Tax Returns)
Here:
$37,988
State:
$55,609
Salary/wage: $30,665 (reported on 75.4% of returns)
Here:
$30,665
State:
$46,782
(% of AGI for various income ranges: 61.9% for AGIs below $25k, 68.5% for AGIs $25k-50k, 64.5% for AGIs $50k-75k, 59.3% for AGIs $75k-100k, 61.8% for AGIs $100k-200k, 27.5% for AGIs over 200k)
Taxable interest for individuals: $1,246 (reported on 30.5% of returns)
This zip code:
$1,246
Michigan:
$1,491
(% of AGI for various income ranges: 1.6% for AGIs below $25k, 0.8% for AGIs $25k-50k, 0.8% for AGIs $50k-75k, 0.8% for AGIs $75k-100k, 1.2% for AGIs $100k-200k, 1.2% for AGIs over 200k)
Ordinary dividends: $3,315 (reported on 16.2% of returns)
Here:
$3,315
State:
$6,225
(% of AGI for various income ranges: 1.4% for AGIs below $25k, 1.1% for AGIs $25k-50k, 1.2% for AGIs $50k-75k, 0.9% for AGIs $75k-100k, 3.3% for AGIs $100k-200k)
Net capital gain/loss in AGI: +$7,944 (reported on 12.9% of returns)
Here:
+$7,944
State:
+$9,326
(% of AGI for various income ranges: 4.6% for AGIs below $25k, 1.0% for AGIs $25k-50k, 1.4% for AGIs $50k-75k, 2.5% for AGIs $75k-100k, 10.9% for AGIs $100k-200k)
Profit/loss from business: +$8,972 (reported on 16.2% of returns)
Here:
+$8,972
State:
+$11,523
(% of AGI for various income ranges: 6.0% for AGIs below $25k, 4.0% for AGIs $25k-50k, 1.8% for AGIs $50k-75k, 1.4% for AGIs $75k-100k, 8.5% for AGIs $100k-200k)
Taxable individual retirement arrangement distribution: $11,343 (reported on 12.6% of returns)
49651:
$11,343
Michigan:
$15,298
(% of AGI for various income ranges: 4.0% for AGIs below $25k, 2.6% for AGIs $25k-50k, 3.9% for AGIs $50k-75k, 4.0% for AGIs $75k-100k, 6.7% for AGIs $100k-200k)
Total itemized deductions: $17,560 (23% of AGI, reported on 17.1% of returns)
Here:
$17,560
State:
$21,628
Here:
22.7% of AGI
State:
18.4% of AGI
(% of AGI for various income ranges: 6.2% for AGIs below $25k, 5.7% for AGIs $25k-50k, 8.4% for AGIs $50k-75k, 8.1% for AGIs $75k-100k, 11.3% for AGIs $100k-200k, 9.0% for AGIs over 200k)
Charity contributions: $3,814 (reported on 12.9% of returns)
Here:
$3,814
State:
$4,225
(% of AGI for various income ranges: 0.7% for AGIs below $25k, 0.6% for AGIs $25k-50k, 1.4% for AGIs $50k-75k, 1.1% for AGIs $75k-100k, 2.5% for AGIs $100k-200k, 1.9% for AGIs over 200k)
Taxes paid: $5,304 (reported on 17.1% of returns)
49651:
$5,304
State:
$8,327
(% of AGI for various income ranges: 1.0% for AGIs below $25k, 1.3% for AGIs $25k-50k, 2.1% for AGIs $50k-75k, 2.8% for AGIs $75k-100k, 4.3% for AGIs $100k-200k, 4.5% for AGIs over 200k)
Earned income credit: $2,216 (reported on 22.5% of returns)
Here:
$2,216
State:
$2,306
(% of AGI for various income ranges: 6.7% for AGIs below $25k, 1.4% for AGIs $25k-50k)
Percentage of individuals using paid preparers for their 2012 taxes: 56.9%
Here:
57%
State:
57%
(% for various income ranges: 50.0% for AGIs below $25k, 60.5% for AGIs $25k-50k, 60.9% for AGIs $50k-75k, 69.6% for AGIs $75k-100k, 75.0% for AGIs $100k-200k, 66.7% for AGIs over 200k)
Averages for the 2004 tax year for zip code 49651, filed in 2005:
Average Adjusted Gross Income (AGI) in 2004: $31,888 (Individual Income Tax Returns)
Here:
$31,888
State:
$48,204
Salary/wage: $27,415 (reported on 79.6% of returns)
Here:
$27,415
State:
$42,791
(% of AGI for various income ranges: 100.2% for AGIs below $10k, 62.6% for AGIs $10k-25k, 69.9% for AGIs $25k-50k, 72.0% for AGIs $50k-75k, 73.4% for AGIs $75k-100k, 58.0% for AGIs over 100k)
Taxable interest for individuals: $1,749 (reported on 39.2% of returns)
This zip code:
$1,749
Michigan:
$1,725
(% of AGI for various income ranges: 6.6% for AGIs below $10k, 2.6% for AGIs $10k-25k, 1.4% for AGIs $25k-50k, 1.6% for AGIs $50k-75k, 1.0% for AGIs $75k-100k, 3.9% for AGIs over 100k)
Taxable dividends: $1,963 (reported on 19.0% of returns)
Here:
$1,963
State:
$3,420
(% of AGI for various income ranges: 3.9% for AGIs below $10k, 1.8% for AGIs $10k-25k, 1.1% for AGIs $25k-50k, 0.9% for AGIs $50k-75k, 0.5% for AGIs $75k-100k, 1.0% for AGIs over 100k)
Net capital gain/loss: +$8,395 (reported on 16.2% of returns)
Here:
+$8,395
State:
+$8,532
(% of AGI for various income ranges: -2.1% for AGIs below $10k, 1.0% for AGIs $10k-25k, 3.1% for AGIs $25k-50k, 2.1% for AGIs $50k-75k, 3.0% for AGIs $75k-100k, 14.0% for AGIs over 100k)
Profit/loss from business: +$5,392 (reported on 18.0% of returns)
Here:
+$5,392
State:
+$9,547
(% of AGI for various income ranges: 10.3% for AGIs below $10k, 6.0% for AGIs $10k-25k, 1.3% for AGIs $25k-50k, 1.9% for AGIs $50k-75k, 0.8% for AGIs $75k-100k, 5.3% for AGIs over 100k)
IRA payment deduction: $2,364 (reported on 2.3% of returns)
49651:
$2,364
Michigan:
$2,875
Total itemized deductions: $15,443 (25% of AGI, reported on 21.1% of returns)
Here:
$15,443
State:
$18,509
Here:
24.6% of AGI
State:
20.7% of AGI
(% of AGI for various income ranges: 10.2% for AGIs below $10k, 7.4% for AGIs $10k-25k, 9.0% for AGIs $25k-50k, 10.8% for AGIs $50k-75k, 13.1% for AGIs $75k-100k, 12.3% for AGIs over 100k)
Charity contributions deductions: $3,210 (5% of AGI, reported on 16.6% of returns)
Here:
$3,210
State:
$3,365
Here:
4.8% of AGI
State:
3.6% of AGI
(% of AGI for various income ranges: 0.6% for AGIs below $10k, 0.7% for AGIs $10k-25k, 1.1% for AGIs $25k-50k, 1.6% for AGIs $50k-75k, 2.5% for AGIs $75k-100k, 3.3% for AGIs over 100k)
Total tax: $3,775 (reported on 69.2% of returns)
49651:
$3,775
State:
$7,691
(% of AGI for various income ranges: 4.0% for AGIs below $10k, 3.8% for AGIs $10k-25k, 6.1% for AGIs $25k-50k, 8.1% for AGIs $50k-75k, 10.1% for AGIs $75k-100k, 15.6% for AGIs over 100k)
Earned income credit: $1,721 (reported on 19.1% of returns)
Here:
$1,721
State:
$1,737
Percentage of individuals using paid preparers for their 2004 taxes: 61.9%
Here:
62%
State:
60%
(% for various income ranges: 57.2% for AGIs below $10k, 58.9% for AGIs $10k-25k, 64.8% for AGIs $25k-50k, 65.9% for AGIs $50k-75k, 68.5% for AGIs $75k-100k, 77.9% for AGIs over 100k)
Likely homosexual households (counted as self-reported same-sex unmarried-partner households)
Lesbian couples: 0.0% of all households
Gay men: 0.5% of all households
Household received Food Stamps/SNAP in the past 12 months: 447 Household did not receive Food Stamps/SNAP in the past 12 months: 2,666
Women who had a birth in the past 12 months: 73 (60 now married, 13 unmarried) Women who did not have a birth in the past 12 months: 1,382 (669 now married, 710 unmarried)
Housing units in zip code 49651 with a mortgage: 1,273 (133 second mortgage, 5 home equity loan, 116 both second mortgage and home equity loan) Houses without a mortgage: 23
Median monthly owner costs for units with a mortgage: $1,163 Median monthly owner costs for units without a mortgage: $458
Residents with income below the poverty level in 2022:
This zip code:
12.1%
Whole state:
13.4%
Residents with income below 50% of the poverty level in 2022:
This zip code:
6.3%
Whole state:
6.9%
Median number of rooms in houses and condos:
Here:
6.0
State:
6.5
Median number of rooms in apartments:
Here:
4.4
State:
4.3
Notable locations in this zip code not listed on our city pages
Notable locations in zip code 49651: Lakeside School (A), Long Lake State Forest Campground (B), Goose Lake State Forest Campground (C), Merritt Speedway (D), Stoney Creek Golf Course (E), Missaukee Golf Course (F), Missaukee County Emergency Medical Services Lake City (G), Lake Missaukee Area Fire Department (H), Norwich Township Fire Department (I), Missaukee County Courthouse (J), Missaukee County Sheriff Department (K), Missaukee District Library (L), Forest Township Hall (M), Lake City Fire Department (N), Reeder Township Hall (O), Lake Township Hall (P), Norwich Township Hall (Q). Display/hide their locations on the map
Churches in zip code 49651 include: Kingdom Hall (A), Christian Reformed Church (B), Covenant Life Church (C), Free Methodist Church (D), Evangelical Presbyterian Church (E), First Presbyterian Church (F), United Methodist Church (G), Saint Stephens Catholic Church (H), Lake City Seventh Day Adventist Church (I). Display/hide their locations on the map
Cemeteries: West Branch Cemetery (1), Reeder Cemetery (2), Star City Cemetery (3), Lake City Cemetery (4), Moorestown Cemetery (5), Pioneer Cemetery (6), New Jennings Cemetery (7). Display/hide their locations on the map
Lakes, reservoirs, and swamps: Loon Lake (A), Long Lake (B), Big Cannon Creek Swamp (C), Little Goose Lake (D), Horseshoe Lake (E), Lake Julia (F), Twin Lakes (G), Rose Lake (H). Display/hide their locations on the map
Parks in zip code 49651 include: Miltner Park (1), Maple Grove Park (2), Pioneer Township Park (3), Lake City Park (4), Crooked Lake Park (5), Missaukee County Park (6). Display/hide their locations on the map
In group quarters: 82 (-1 institutionalized population)
Size of family households: 1,168 2-persons, 458 3-persons, 372 4-persons, 107 5-persons, 50 6-persons, 24 7-or-more-persons
Size of nonfamily households: 739 1-person, 172 2-persons, 17 4-persons
821 married couples with children.
372 single-parent households (127 men, 245 women).
98.8% of residents of 49651 zip code speak English at home.
0.2% of residents speak Spanish at home (77% very well, 23% not well).
0.7% of residents speak other Indo-European language at home (61% very well, 33% well, 6% not well).
0.2% of residents speak Asian or Pacific Island language at home (100% very well).
0.1% of residents speak other language at home (38% well, 38% not well, 25% not at all).
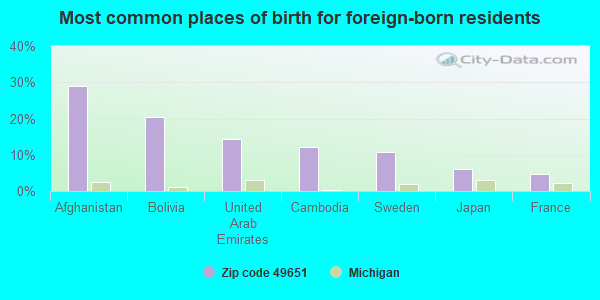
Foreign born population: 83 (1.1%) (57.9% of them are naturalized citizens)
This zip code:
1.1%
Whole state:
6.9%
29%Afghanistan
20%Bolivia
14%United Arab Emirates
12%Cambodia
11%Sweden
6%Japan
5%France
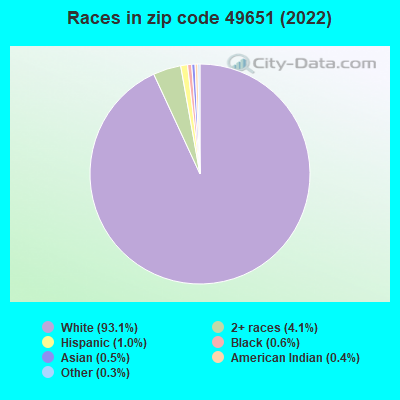
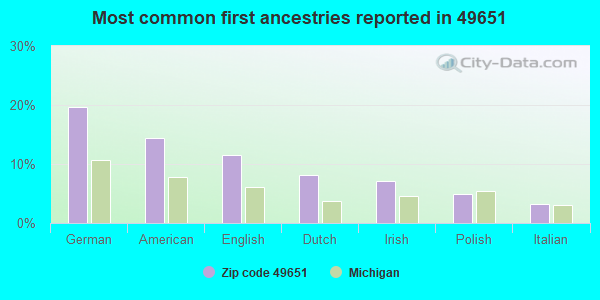
20%German
14%American
12%English
8%Dutch
7%Irish
5%Polish
3%Italian
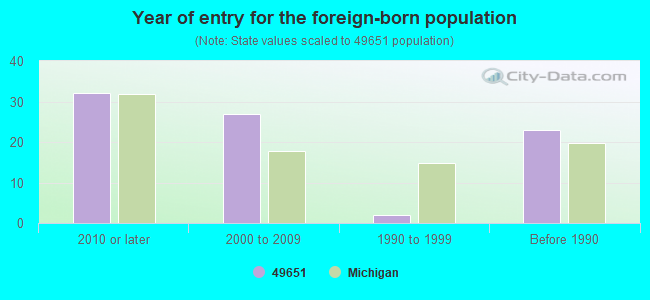
Year of entry for the foreign-born population
322010 or later
272000 to 2009
21990 to 1999
23Before 1990
Facilities with environmental interests located in this zip code:
MERIT ENERGY (11576 E OILWELL RD in MOORESTOWN, MI)
(Integrated Compliance Information System) - ICIS-05-2000-0355, FORMAL ENFORCEMENT ACTION, ENFORCEMENT/COMPLIANCE ACTIVITY Business SIC classification: CRUDE PETROLEUM AND NATURAL GAS
BOHNING CO LTD (7361 N 7 MILE RD in LAKE CITY, MI)
AIR MINOR (AIRS/AFS) Small Quantity Generators, between 100 kg and 1000 kg of hazardous waste/month (Resource Conservation and Recovery Act (tracking hazardous waste)) - notification TRI REPORTER (Tracking of toxic chemicals releasing facilities) Business SIC classification: SPORTING AND ATHLETIC GOODS Organizations: LARRY GRIFFITH (CONTACT/OPERATOR)
BAKER PETROLITE (702 MITCHELL CT in LAKE CITY, MI)
(Resource Conservation and Recovery Act (tracking hazardous waste))
MERIT ENERGY CO (SEC 15 in LAKE CITY, MI)
(Resource Conservation and Recovery Act (tracking hazardous waste)) Organizations: MERIT ENERGY COMPANY (CONTACT/OPERATOR)
MI DEPT/ENVIRONMENTAL QUALITY (111 S CRAPO RD in LAKE CITY, MI)
(Resource Conservation and Recovery Act (tracking hazardous waste))
ALAN PIERCE (101 N MAIN ST in LAKE CITY, MI)
(Resource Conservation and Recovery Act (tracking hazardous waste))
MI DEPT/ENVIRONMENTAL QUALITY (369 LACHANCE in LAKE CITY, MI)
(Resource Conservation and Recovery Act (tracking hazardous waste))
E N D SVC (88 N MOREY RD in LAKE CITY, MI)
(Resource Conservation and Recovery Act (tracking hazardous waste))
Housing units lacking complete plumbing facilities: 5.5% Housing units lacking complete kitchen facilities: 6.3%
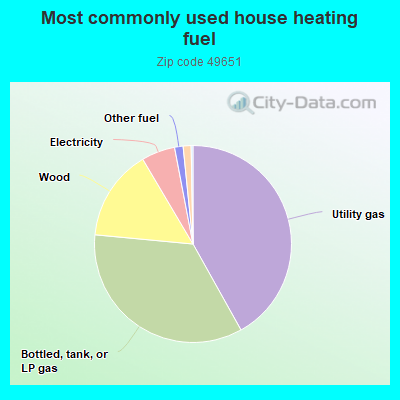
41.9%Utility gas
34.6%Bottled, tank, or LP gas
15.0%Wood
5.5%Electricity
1.4%Other fuel
1.3%Fuel oil, kerosene, etc.
Population in 1990: 6,225. Population change in the 1990s: +1,311 (+21.1%).
Place of birth for U.S.-born residents:
This state: 6,694
Northeast: 64
Midwest: 408
South: 227
West: 138
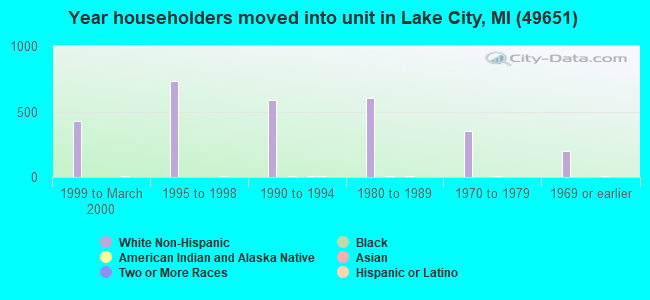
64% of the 49651 zip code residents lived in the same house 5 years ago. Out of people who lived in different houses, 43% lived in this county. Out of people who lived in different counties, 50% lived in Michigan.
88% of the 49651 zip code residents lived in the same house 1 year ago. Out of people who lived in different houses, 43% moved from this county. Out of people who lived in different houses, 41% moved from different county within same state. Out of people who lived in different houses, 13% moved from different state. Out of people who lived in different houses, 3% moved from abroad.
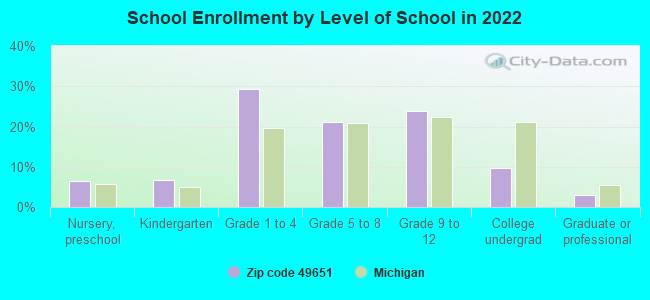
Private vs. public school enrollment:
Students in private schools in grades 1 to 8 (elementary and middle school): 19
Here:
3.0%
Michigan:
12.4%
Students in private schools in grades 9 to 12 (high school): 37
Here:
12.0%
Michigan:
9.8%
Students in private undergraduate colleges: 10
Here:
8.6%
Michigan:
14.9%
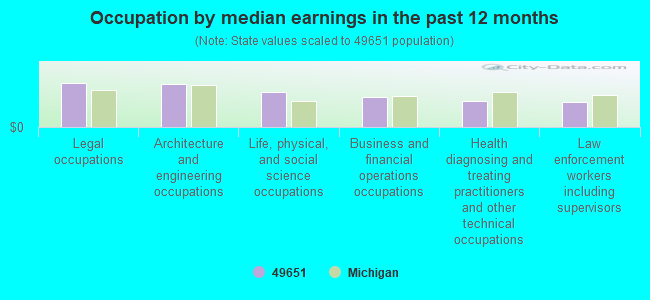
Occupation by median earnings in the past 12 months ($)
106,599Legal occupations
103,830Architecture and engineering occupations
84,817Life, physical, and social science occupations
73,095Business and financial operations occupations
62,304Health diagnosing and treating practitioners and other technical occupations
61,041Law enforcement workers including supervisors
Top industries in this zip code by the number of employees in 2005:
Health Care and Social Assistance: Child Day Care Services (20-49: 1, 1-4: 3)
Accommodation and Food Services: Recreational and Vacation Camps (except Campgrounds) (20-49: 1)
Wholesale Trade: Farm and Garden Machinery and Equipment Merchant Wholesalers (20-49: 1)
Other Services (except Public Administration): Religious Organizations (5-9: 2, 1-4: 5)
People in group quarters in 2010:
40 people in local jails and other municipal confinement facilities
31 people in group homes intended for adults
7 people in residential treatment centers for adults
People in group quarters in 2000:
31 people in homes for the mentally retarded
23 people in local jails and other confinement facilities (including police lockups)
8 people in other noninstitutional group quarters
7 people in other group homes
2 people in homes for the mentally ill
Fatal accident statistics in 2014:
Fatal accident count: 1
Vehicles involved in fatal accidents: 2
Fatal accidents caused by drunken drivers: 0
Fatalities: 1
Persons involved in fatal accidents: 3
Pedestrians involved in fatal accidents: 0
Fatal accident statistics in 2012:
Fatal accident count: 1
Vehicles involved in fatal accidents: 1
Fatal accidents caused by drunken drivers: 0
Fatalities: 1
Persons involved in fatal accidents: 2
Pedestrians involved in fatal accidents: 1
2002 - 2018 National Fire Incident Reporting System (NFIRS) incidents
According to the data from the years 2002 - 2018 the average number of fires per year is 38. The highest number of reported fires - 57 took place in 2003, and the least - 21 in 2008. The data has a growing trend.
When looking into fire subcategories, the most incidents belonged to: Structure Fires (54.4%), and Outside Fires (28.0%).
Fire incident types reported to NFIRS in Zip Code 49651


 Nearest zip codes: 49657, 49667, 49633, 49632, 49663, 49665.


 According to the data from the years 2002 - 2018 the average number of fires per year is 38. The highest number of reported fires - 57 took place in 2003, and the least - 21 in 2008. The data has a growing trend.
 When looking into fire subcategories, the most incidents belonged to: Structure Fires (54.4%), and Outside Fires (28.0%).