Estimated zip code population in 2022: 2,120 Zip code population in 2010: 2,327 Zip code population in 2000: 2,112
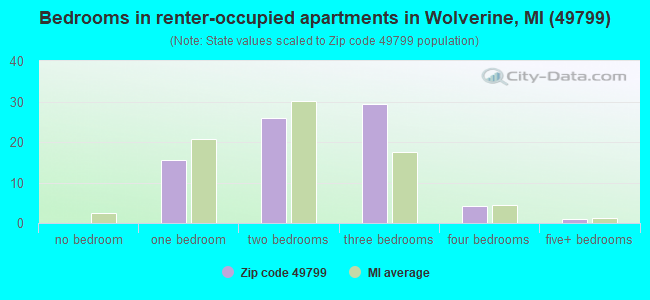
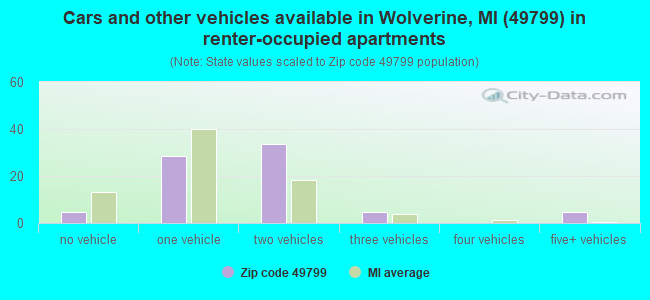
Houses and condos: 1,496 Renter-occupied apartments: 76
% of renters here:
9%
State:
27%
March 2022 cost of living index in zip code 49799: 81.4 (low, U.S. average is 100)
Land area: 110.5 sq. mi. Water area: 1.4 sq. mi.
Population density: 19 people per square mile
(very low).
OSM Map
General Map
Google Map
MSN Map
OSM Map
General Map
Google Map
MSN Map
OSM Map
General Map
Google Map
MSN Map
OSM Map
General Map
Google Map
MSN Map
Please wait while loading the map...
Real estate property taxes paid for housing units in 2022:
This zip code:
0.7% ($1,236)
Michigan:
1.2% ($2,746)
Median real estate property taxes paid for housing units with mortgages in 2022: $1,325 (0.7%) Median real estate property taxes paid for housing units with no mortgage in 2022: $1,167 (0.8%)
Business Search- 14 Million verified businesses
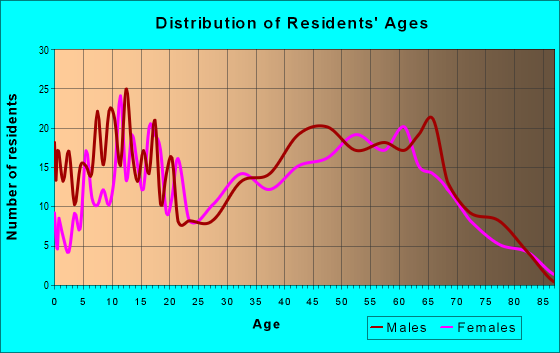
Males: 1,130
(53.3%)
Females: 990
(46.7%)
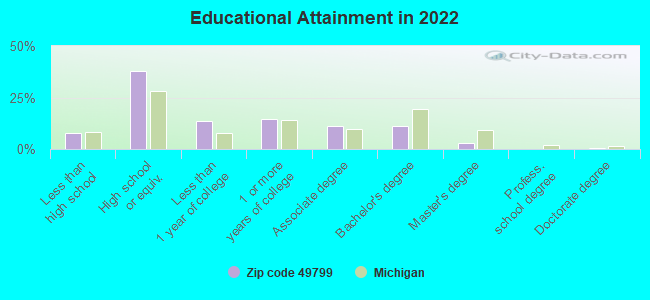
For population 25 years and over in 49799:
High school or higher: 91.4%
Bachelor's degree or higher: 14.8%
Graduate or professional degree: 3.9%
Unemployed: 6.3%
Mean travel time to work (commute): 30.1 minutes
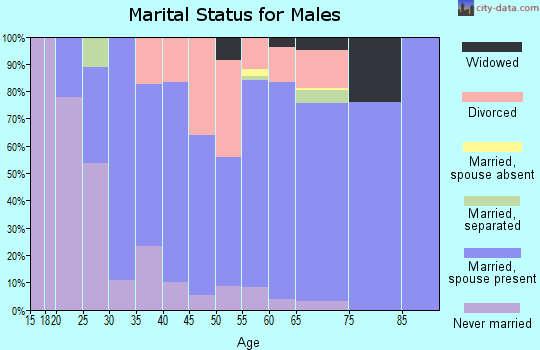
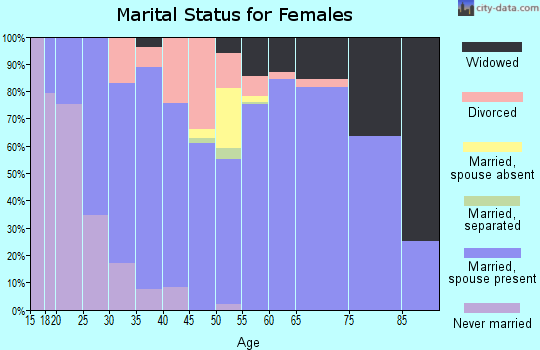
For population 15 years and over in 49799:
Never married: 19.4%
Now married: 62.1%
Separated: 0.8%
Widowed: 5.3%
Divorced: 12.4%
Zip code 49799 compared to state average:
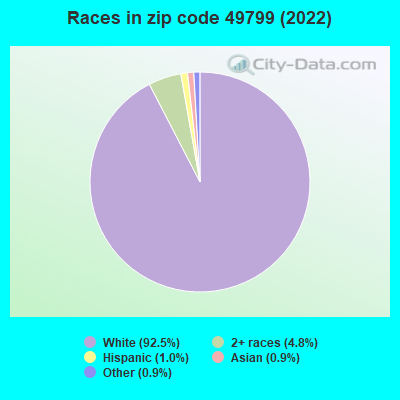
Black race population percentage significantly below state average.
Hispanic race population percentage significantly below state average.
Median age significantly above state average.
Foreign-born population percentage significantly below state average.
Renting percentage significantly below state average.
Length of stay since moving in above state average.
House age below state average.
Number of college students below state average.
Percentage of population with a bachelor's degree or higher below state average.
Averages for the 2020 tax year for zip code 49799, filed in 2021:
Average Adjusted Gross Income (AGI) in 2020: $44,359 (Individual Income Tax Returns)
Here:
$44,359
State:
$68,945
Salary/wage: $36,046 (reported on 74.6% of returns)
Here:
$36,046
State:
$57,142
(% of AGI for various income ranges: 951.2% for AGIs below $25k, 3045.0% for AGIs $25k-50k, 5532.7% for AGIs $50k-75k, 7871.4% for AGIs $75k-100k, 14030.0% for AGIs $100k-200k)
Taxable interest for individuals: $735 (reported on 27.9% of returns)
This zip code:
$735
Michigan:
$1,630
(% of AGI for various income ranges: 11.2% for AGIs below $25k, 11.9% for AGIs $25k-50k, 22.7% for AGIs $50k-75k, 7.1% for AGIs $75k-100k, 243.3% for AGIs $100k-200k)
Ordinary dividends: $3,164 (reported on 11.5% of returns)
Here:
$3,164
State:
$6,972
(% of AGI for various income ranges: 26.2% for AGIs below $25k, 19.7% for AGIs $25k-50k, 75.5% for AGIs $50k-75k, 355.0% for AGIs $100k-200k)
Net capital gain/loss in AGI: +$17,607 (reported on 11.5% of returns)
Here:
+$17,607
State:
+$20,064
(% of AGI for various income ranges: 3.1% for AGIs below $25k, 20.6% for AGIs $25k-50k, 164.5% for AGIs $50k-75k, 3680.0% for AGIs $100k-200k)
Profit/loss from business: +$6,755 (reported on 18.0% of returns)
Here:
+$6,755
State:
+$11,172
(% of AGI for various income ranges: 208.1% for AGIs below $25k, 158.1% for AGIs $25k-50k, 123.6% for AGIs $50k-75k, 254.3% for AGIs $75k-100k)
Taxable individual retirement arrangement distribution: $17,315 (reported on 10.7% of returns)
49799:
$17,315
Michigan:
$19,803
(% of AGI for various income ranges: 69.1% for AGIs below $25k, 87.2% for AGIs $25k-50k, 570.0% for AGIs $50k-75k, 1873.3% for AGIs $100k-200k)
Taxes paid: $6,050 (reported on 1.6% of returns)
49799:
$6,050
State:
$7,972
(% of AGI for various income ranges: 37.8% for AGIs below $25k)
Earned income credit: $2,236 (reported on 20.5% of returns)
Here:
$2,236
State:
$2,251
(% of AGI for various income ranges: 90.6% for AGIs below $25k, 84.1% for AGIs $25k-50k)
Percentage of individuals using paid preparers for their 2020 taxes: 94.3%
Here:
94%
State:
93%
(% for various income ranges: 91.7% for AGIs below $25k, 95.0% for AGIs $25k-50k, 93.3% for AGIs $50k-75k, 100.0% for AGIs $75k-100k, 100.0% for AGIs $100k-200k)
Averages for the 2012 tax year for zip code 49799, filed in 2013:
Average Adjusted Gross Income (AGI) in 2012: $32,319 (Individual Income Tax Returns)
Here:
$32,319
State:
$55,609
Salary/wage: $25,840 (reported on 77.7% of returns)
Here:
$25,840
State:
$46,782
(% of AGI for various income ranges: 63.6% for AGIs below $25k, 67.8% for AGIs $25k-50k, 72.8% for AGIs $50k-75k, 60.6% for AGIs $75k-100k, 41.9% for AGIs $100k-200k)
Taxable interest for individuals: $729 (reported on 30.1% of returns)
This zip code:
$729
Michigan:
$1,491
(% of AGI for various income ranges: 1.0% for AGIs below $25k, 0.5% for AGIs $25k-50k, 0.6% for AGIs $50k-75k, 0.4% for AGIs $75k-100k, 0.8% for AGIs $100k-200k)
Ordinary dividends: $2,092 (reported on 11.7% of returns)
Here:
$2,092
State:
$6,225
(% of AGI for various income ranges: 1.1% for AGIs below $25k, 0.6% for AGIs $25k-50k, 0.6% for AGIs $50k-75k, 1.9% for AGIs $75k-100k)
Net capital gain/loss in AGI: +$1,850 (reported on 9.7% of returns)
Here:
+$1,850
State:
+$9,326
(% of AGI for various income ranges: 5.8% for AGIs $75k-100k)
Profit/loss from business: +$5,861 (reported on 17.5% of returns)
Here:
+$5,861
State:
+$11,523
(% of AGI for various income ranges: 8.3% for AGIs below $25k, 3.6% for AGIs $25k-50k, 2.1% for AGIs $50k-75k)
Taxable individual retirement arrangement distribution: $12,355 (reported on 10.7% of returns)
49799:
$12,355
Michigan:
$15,298
(% of AGI for various income ranges: 2.3% for AGIs below $25k, 6.1% for AGIs $25k-50k, 15.2% for AGIs $75k-100k)
Total itemized deductions: $15,712 (25% of AGI, reported on 16.5% of returns)
Here:
$15,712
State:
$21,628
Here:
24.9% of AGI
State:
18.4% of AGI
(% of AGI for various income ranges: 6.1% for AGIs below $25k, 7.0% for AGIs $25k-50k, 13.4% for AGIs $50k-75k, 11.3% for AGIs $100k-200k)
Charity contributions: $2,064 (reported on 10.7% of returns)
Here:
$2,064
State:
$4,225
(% of AGI for various income ranges: 1.0% for AGIs $25k-50k, 0.9% for AGIs $50k-75k, 1.2% for AGIs $100k-200k)
Taxes paid: $3,953 (reported on 16.5% of returns)
49799:
$3,953
State:
$8,327
(% of AGI for various income ranges: 0.9% for AGIs below $25k, 1.5% for AGIs $25k-50k, 3.4% for AGIs $50k-75k, 3.9% for AGIs $100k-200k)
Earned income credit: $2,241 (reported on 28.2% of returns)
Here:
$2,241
State:
$2,306
(% of AGI for various income ranges: 7.4% for AGIs below $25k, 1.5% for AGIs $25k-50k)
Percentage of individuals using paid preparers for their 2012 taxes: 53.4%
Here:
53%
State:
57%
(% for various income ranges: 48.2% for AGIs below $25k, 59.3% for AGIs $25k-50k, 60.0% for AGIs $50k-75k, 60.0% for AGIs $75k-100k, 60.0% for AGIs $100k-200k)
Averages for the 2004 tax year for zip code 49799, filed in 2005:
Average Adjusted Gross Income (AGI) in 2004: $29,528 (Individual Income Tax Returns)
Here:
$29,528
State:
$48,204
Salary/wage: $25,006 (reported on 82.4% of returns)
Here:
$25,006
State:
$42,791
(% of AGI for various income ranges: 84.1% for AGIs below $10k, 71.5% for AGIs $10k-25k, 75.4% for AGIs $25k-50k, 73.4% for AGIs $50k-75k, 69.8% for AGIs $75k-100k, 37.3% for AGIs over 100k)
Taxable interest for individuals: $1,083 (reported on 38.3% of returns)
This zip code:
$1,083
Michigan:
$1,725
(% of AGI for various income ranges: 2.6% for AGIs below $10k, 1.6% for AGIs $10k-25k, 1.2% for AGIs $25k-50k, 0.7% for AGIs $50k-75k, 1.0% for AGIs $75k-100k, 3.3% for AGIs over 100k)
Taxable dividends: $1,102 (reported on 13.1% of returns)
Here:
$1,102
State:
$3,420
(% of AGI for various income ranges: 0.3% for AGIs below $10k, 1.0% for AGIs $10k-25k, 0.4% for AGIs $25k-50k, 0.4% for AGIs $50k-75k, 0.5% for AGIs $75k-100k)
Net capital gain/loss: +$1,288 (reported on 11.3% of returns)
Here:
+$1,288
State:
+$8,532
(% of AGI for various income ranges: -1.6% for AGIs below $10k, 0.3% for AGIs $10k-25k, 0.2% for AGIs $25k-50k, 0.3% for AGIs $50k-75k, 3.8% for AGIs $75k-100k)
Profit/loss from business: +$5,232 (reported on 20.7% of returns)
Here:
+$5,232
State:
+$9,547
(% of AGI for various income ranges: 9.7% for AGIs below $10k, 9.3% for AGIs $10k-25k, 3.4% for AGIs $25k-50k, 1.8% for AGIs $50k-75k)
IRA payment deduction: $3,000 (reported on 2.1% of returns)
49799:
$3,000
Michigan:
$2,875
Total itemized deductions: $13,900 (26% of AGI, reported on 20.4% of returns)
Here:
$13,900
State:
$18,509
Here:
26.2% of AGI
State:
20.7% of AGI
(% of AGI for various income ranges: 6.8% for AGIs $10k-25k, 9.1% for AGIs $25k-50k, 13.3% for AGIs $50k-75k, 12.5% for AGIs $75k-100k, 8.9% for AGIs over 100k)
Charity contributions deductions: $1,605 (3% of AGI, reported on 15.5% of returns)
Here:
$1,605
State:
$3,365
Here:
2.8% of AGI
State:
3.6% of AGI
(% of AGI for various income ranges: 0.6% for AGIs $10k-25k, 0.8% for AGIs $25k-50k, 1.2% for AGIs $50k-75k, 0.6% for AGIs $75k-100k, 1.2% for AGIs over 100k)
Total tax: $3,344 (reported on 68.8% of returns)
49799:
$3,344
State:
$7,691
(% of AGI for various income ranges: 3.4% for AGIs below $10k, 4.7% for AGIs $10k-25k, 5.9% for AGIs $25k-50k, 8.3% for AGIs $50k-75k, 11.2% for AGIs $75k-100k, 16.6% for AGIs over 100k)
Earned income credit: $1,733 (reported on 24.5% of returns)
Here:
$1,733
State:
$1,737
Percentage of individuals using paid preparers for their 2004 taxes: 56.9%
Here:
57%
State:
60%
(% for various income ranges: 48.2% for AGIs below $10k, 55.6% for AGIs $10k-25k, 57.8% for AGIs $25k-50k, 66.7% for AGIs $50k-75k, 71.9% for AGIs $75k-100k, 85.0% for AGIs over 100k)
Likely homosexual households (counted as self-reported same-sex unmarried-partner households)
Lesbian couples: 0.0% of all households
Gay men: 0.5% of all households
Household received Food Stamps/SNAP in the past 12 months: 92 Household did not receive Food Stamps/SNAP in the past 12 months: 769
Women who had a birth in the past 12 months: 25 (15 now married, 10 unmarried) Women who did not have a birth in the past 12 months: 330 (202 now married, 126 unmarried)
Housing units in zip code 49799 with a mortgage: 390 (51 second mortgage, 1 home equity loan, 49 both second mortgage and home equity loan) Houses without a mortgage: 3
Median monthly owner costs for units with a mortgage: $1,136 Median monthly owner costs for units without a mortgage: $431
Residents with income below the poverty level in 2022:
This zip code:
15.5%
Whole state:
13.4%
Residents with income below 50% of the poverty level in 2022:
This zip code:
8.8%
Whole state:
6.9%
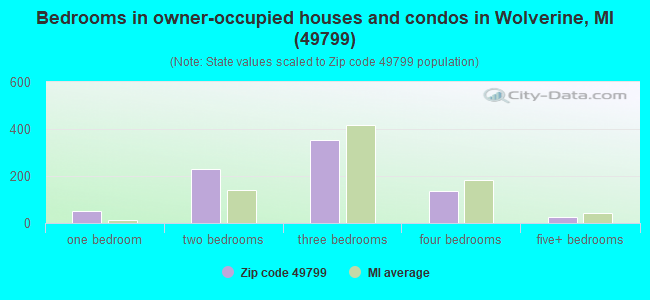
Median number of rooms in houses and condos:
Here:
6.0
State:
6.5
Median number of rooms in apartments:
Here:
4.3
State:
4.3
Notable locations in this zip code not listed on our city pages
Notable locations in zip code 49799: Haakwood (A), Pine Grove State Forest Campground (B), Weber Lake State Forest Campground (C), Haakwood State Forest Campground (D), Wildwood Lake Golf Course (E), Sturgeon River Campground (F), Elkwood Campground (G), Wolverine Joint Fire Board / Wolverine Volunteer Fire Department (H). Display/hide their locations on the map
Churches in zip code 49799 include: Joy Fellowship Assembly of God Church (A), Wolverine Baptist Church (B), Wolverine Congregational Church (C), Wolverine Free Methodist Church (D). Display/hide their locations on the map
Lakes and reservoirs: Weber Lake (A), Lance Lake (B), Mud Lake (C), Hemlock Lake (D), Wildwood Lake (E), Hackett Lake (F), Fulmer Lake (G), Doe Lake (H). Display/hide their locations on the map
Rivers and creeks: West Branch Sturgeon River (A), Beebe Creek (B), Stewart Creek (C), Blackjack Creek (D), Johnson Creek (E), Bradley Creek (F), Allen Creek (G), Burrows Creek (H), Dodge Creek (I). Display/hide their locations on the map
Size of family households: 339 2-persons, 100 3-persons, 118 4-persons, 35 5-persons, 4 6-persons, 7 7-or-more-persons
Size of nonfamily households: 194 1-person, 61 2-persons, 3 3-persons
324 married couples with children.
34 single-parent households (17 men, 17 women).
96.1% of residents of 49799 zip code speak English at home.
0.6% of residents speak Spanish at home (31% very well, 69% well).
1.7% of residents speak other Indo-European language at home (82% very well, 18% well).
0.1% of residents speak Asian or Pacific Island language at home (100% well).
1.4% of residents speak other language at home (71% very well, 18% well, 11% not well).
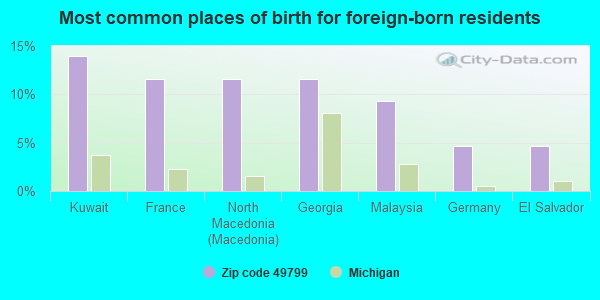
Foreign born population: 43 (2.1%) (91.1% of them are naturalized citizens)
This zip code:
2.1%
Whole state:
6.9%
14%Kuwait
12%France
12%North Macedonia (Macedonia)
12%Georgia
9%Malaysia
5%Germany
5%El Salvador
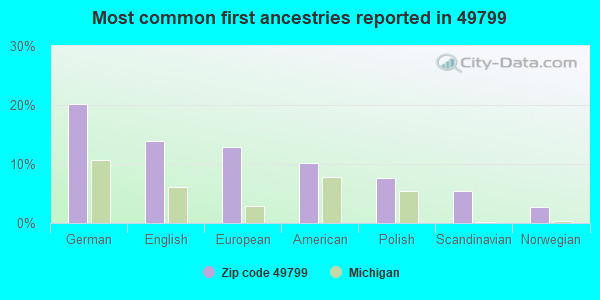
20%German
14%English
13%European
10%American
8%Polish
5%Scandinavian
3%Norwegian
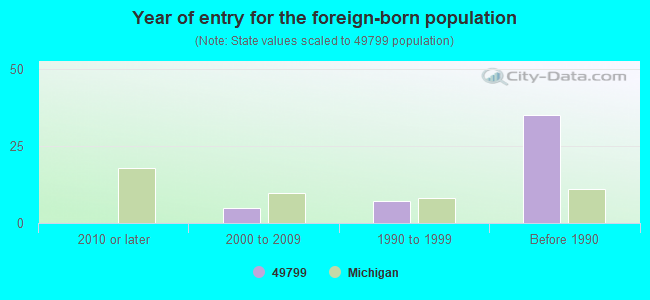
Year of entry for the foreign-born population
02010 or later
52000 to 2009
71990 to 1999
35Before 1990
Facilities with environmental interests located in this zip code:
MI DEPT/TRANSPORTATION BRIDGE (I75 BRIDGE OVER RAILROAD in WOLVERINE, MI)
(Resource Conservation and Recovery Act (tracking hazardous waste)) Organizations: MICH DEPT OF TRANSPORTATION (CONTACT/OPERATOR)
Alternative names: MIDOT BRIDGE I-75 OVER RR
Housing units lacking complete plumbing facilities: 2.0% Housing units lacking complete kitchen facilities: 2.4%
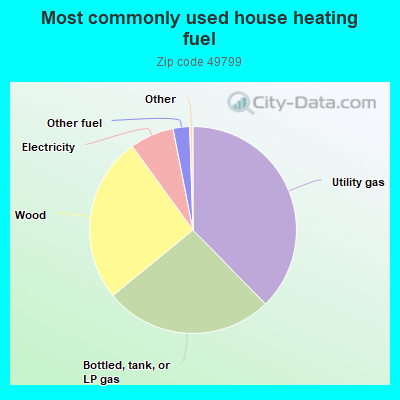
37.8%Utility gas
26.5%Bottled, tank, or LP gas
26.0%Wood
6.9%Electricity
2.6%Other fuel
Population in 1990: 1,857. Population change in the 1990s: +255 (+13.7%).
Place of birth for U.S.-born residents:
This state: 1,847
Northeast: 23
Midwest: 83
South: 82
West: 28
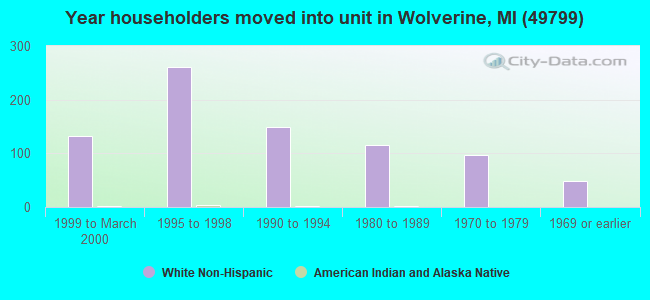
57% of the 49799 zip code residents lived in the same house 5 years ago. Out of people who lived in different houses, 38% lived in this county. Out of people who lived in different counties, 50% lived in Michigan.
94% of the 49799 zip code residents lived in the same house 1 year ago. Out of people who lived in different houses, 18% moved from this county. Out of people who lived in different houses, 58% moved from different county within same state. Out of people who lived in different houses, 27% moved from different state.
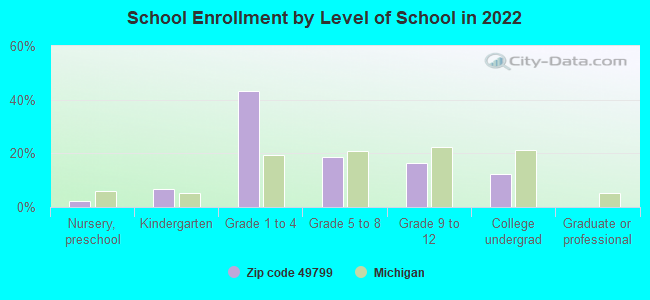
Private vs. public school enrollment:
Students in private schools in grades 1 to 8 (elementary and middle school): 49
Here:
22.6%
Michigan:
12.4%
Students in private schools in grades 9 to 12 (high school): 1
Here:
3.2%
Michigan:
9.8%
Students in private undergraduate colleges: 7
Here:
16.4%
Michigan:
14.9%
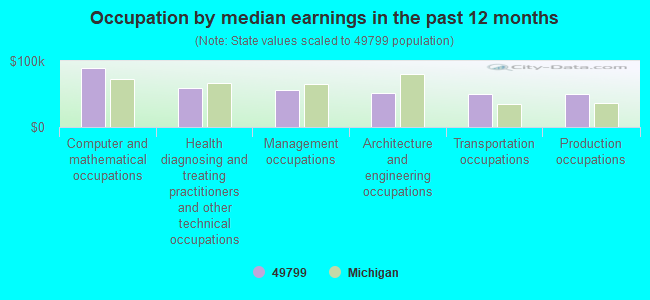
Occupation by median earnings in the past 12 months ($)
89,512Computer and mathematical occupations
59,038Health diagnosing and treating practitioners and other technical occupations
56,656Management occupations
52,215Architecture and engineering occupations
49,853Transportation occupations
49,820Production occupations
Top industries in this zip code by the number of employees in 2005:
Accommodation and Food Services: Recreational and Vacation Camps (except Campgrounds) (10-19 employees: 1 establishment)
Construction: New Single-Family Housing Construction (except Operative Builders) (5-9: 1, 1-4: 4)
Construction: Water and Sewer Line and Related Structures Construction (5-9: 1, 1-4: 1)
Accommodation and Food Services: Full-Service Restaurants (1-4: 2)
People in group quarters in 2000:
5 people in hospitals/wards and hospices for chronically ill
5 people in hospices or homes for chronically ill
Fatal accident statistics in 2014:
Fatal accident count: 1
Vehicles involved in fatal accidents: 1
Fatal accidents caused by drunken drivers: 1
Fatalities: 1
Persons involved in fatal accidents: 1
Pedestrians involved in fatal accidents: 0
Fatal accident statistics in 2011:
Fatal accident count: 1
Vehicles involved in fatal accidents: 2
Fatal accidents caused by drunken drivers: 0
Fatalities: 1
Persons involved in fatal accidents: 5
Pedestrians involved in fatal accidents: 0
2002 - 2018 National Fire Incident Reporting System (NFIRS) incidents
Based on the data from the years 2002 - 2018 the average number of fires per year is 11. The highest number of reported fire incidents - 29 took place in 2008, and the least - 0 in 2015. The data has a declining trend.
When looking into fire subcategories, the most incidents belonged to: Structure Fires (43.3%), and Outside Fires (39.4%).
Fire incident types reported to NFIRS in Zip Code 49799


 Nearest zip codes: 49795, 49705, 49749, 49717, 49791, 49706.
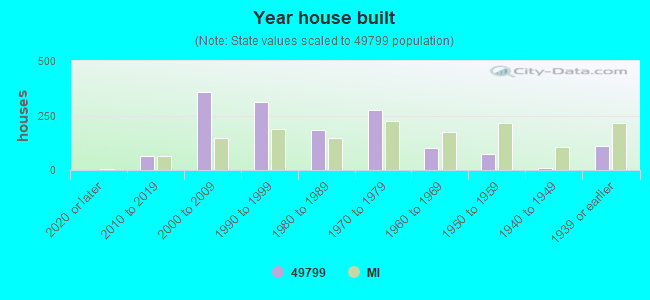


 Based on the data from the years 2002 - 2018 the average number of fires per year is 11. The highest number of reported fire incidents - 29 took place in 2008, and the least - 0 in 2015. The data has a declining trend.
 When looking into fire subcategories, the most incidents belonged to: Structure Fires (43.3%), and Outside Fires (39.4%).