Estimated zip code population in 2022: 3,501 Zip code population in 2010: 3,329 Zip code population in 2000: 3,467
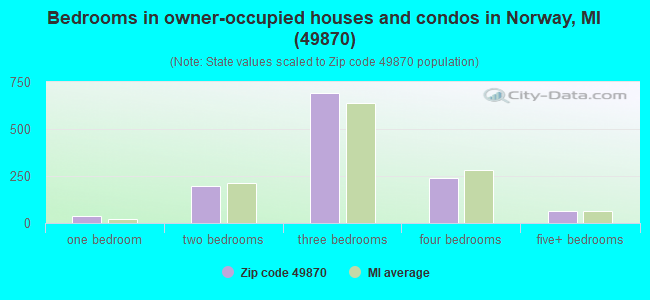
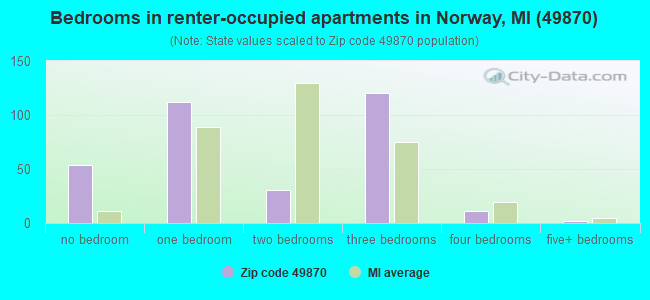
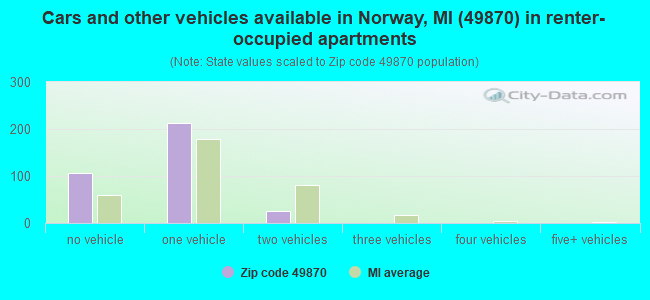
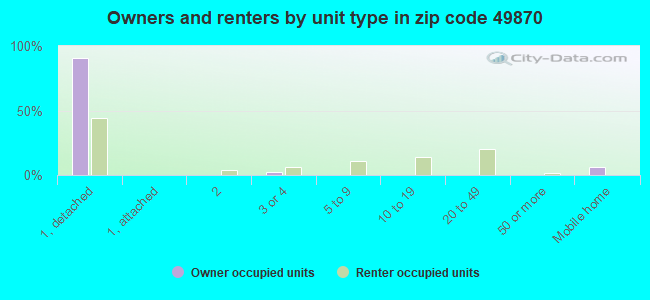
Houses and condos: 1,813 Renter-occupied apartments: 341
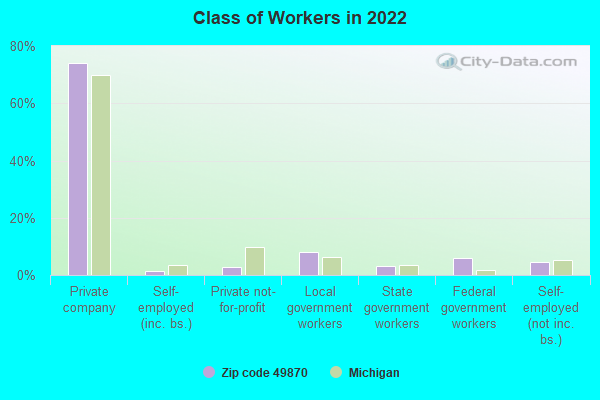
% of renters here:
22%
State:
27%
March 2022 cost of living index in zip code 49870: 74.2 (low, U.S. average is 100)
Land area: 55.0 sq. mi. Water area: 0.5 sq. mi.
Population density: 64 people per square mile
(very low).
OSM Map
General Map
Google Map
MSN Map
OSM Map
General Map
Google Map
MSN Map
OSM Map
General Map
Google Map
MSN Map
OSM Map
General Map
Google Map
MSN Map
Please wait while loading the map...
Real estate property taxes paid for housing units in 2022:
This zip code:
1.6% ($1,686)
Michigan:
1.2% ($2,746)
Median real estate property taxes paid for housing units with mortgages in 2022: $1,466 (1.5%) Median real estate property taxes paid for housing units with no mortgage in 2022: $1,857 (1.4%)
Business Search- 14 Million verified businesses
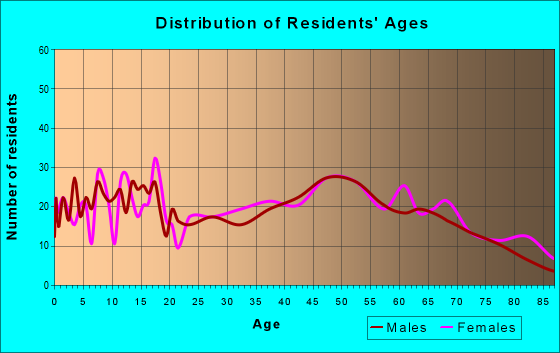
Males: 1,777
(50.8%)
Females: 1,723
(49.2%)
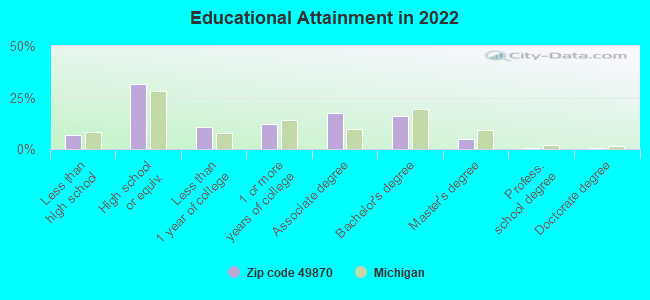
For population 25 years and over in 49870:
High school or higher: 92.7%
Bachelor's degree or higher: 21.4%
Graduate or professional degree: 5.6%
Unemployed: 1.4%
Mean travel time to work (commute): 17.0 minutes
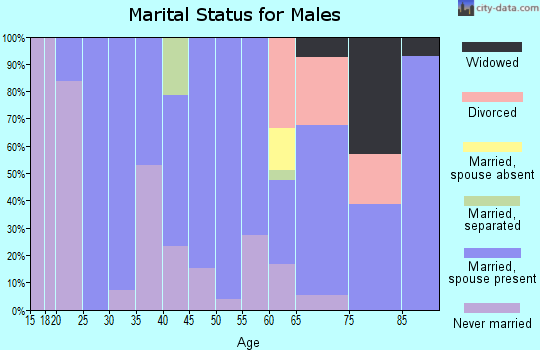
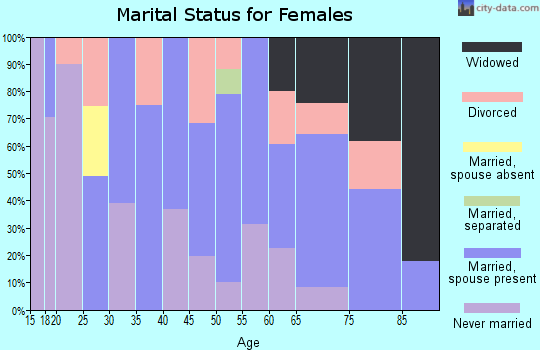
For population 15 years and over in 49870:
Never married: 30.6%
Now married: 46.5%
Separated: 0.3%
Widowed: 8.8%
Divorced: 13.9%
Zip code 49870 compared to state average:
Median house value below state average.
Unemployed percentage significantly below state average.
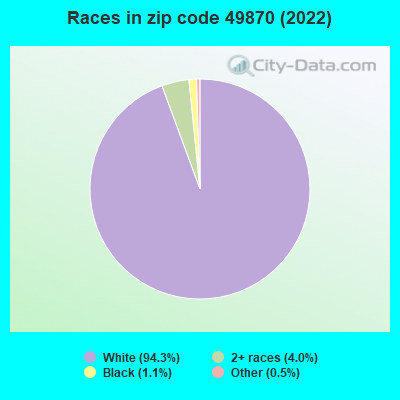
Black race population percentage significantly below state average.
Hispanic race population percentage significantly below state average.
Median age above state average.
Foreign-born population percentage significantly below state average.
Length of stay since moving in above state average.
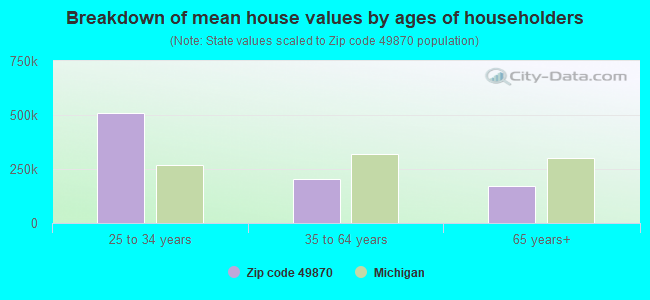
Estimated median house/condo value in 2022: $107,458
49870:
$107,458
Michigan:
$224,400
According to our research of Michigan and other state lists, there were 12 registered sex offenders living in 49870 zip code as of April 25, 2024. The ratio of all residents to sex offenders in zip code 49870 is 278 to 1. The ratio of registered sex offenders to all residents in this zip code is near the state average.
Median resident age:
This zip code:
45.9 years
Michigan median age:
40.3 years
Average household size:
This zip code:
2.2 people
Michigan:
2.4 people
Averages for the 2020 tax year for zip code 49870, filed in 2021:
Average Adjusted Gross Income (AGI) in 2020: $49,842 (Individual Income Tax Returns)
Here:
$49,842
State:
$68,945
Salary/wage: $45,440 (reported on 76.6% of returns)
Here:
$45,440
State:
$57,142
(% of AGI for various income ranges: 1054.8% for AGIs below $25k, 3362.6% for AGIs $25k-50k, 5857.5% for AGIs $50k-75k, 9373.0% for AGIs $75k-100k, 13985.8% for AGIs $100k-200k)
Taxable interest for individuals: $729 (reported on 33.9% of returns)
This zip code:
$729
Michigan:
$1,630
(% of AGI for various income ranges: 14.0% for AGIs below $25k, 42.0% for AGIs $25k-50k, 38.5% for AGIs $50k-75k, 49.0% for AGIs $75k-100k, 53.3% for AGIs $100k-200k)
Ordinary dividends: $3,736 (reported on 19.3% of returns)
Here:
$3,736
State:
$6,972
(% of AGI for various income ranges: 33.6% for AGIs below $25k, 55.7% for AGIs $25k-50k, 69.0% for AGIs $50k-75k, 190.0% for AGIs $75k-100k, 474.2% for AGIs $100k-200k)
Net capital gain/loss in AGI: +$4,004 (reported on 15.8% of returns)
Here:
+$4,004
State:
+$20,064
(% of AGI for various income ranges: 9.3% for AGIs below $25k, 7.4% for AGIs $25k-50k, 49.0% for AGIs $50k-75k, 73.0% for AGIs $75k-100k, 704.2% for AGIs $100k-200k)
Profit/loss from business: +$5,600 (reported on 9.9% of returns)
Here:
+$5,600
State:
+$11,172
(% of AGI for various income ranges: 39.3% for AGIs below $25k, 63.4% for AGIs $25k-50k, 55.5% for AGIs $50k-75k, 131.0% for AGIs $75k-100k, 269.2% for AGIs $100k-200k)
Taxable individual retirement arrangement distribution: $15,970 (reported on 11.7% of returns)
49870:
$15,970
Michigan:
$19,803
(% of AGI for various income ranges: 54.8% for AGIs below $25k, 172.0% for AGIs $25k-50k, 271.5% for AGIs $50k-75k, 433.0% for AGIs $75k-100k, 1155.0% for AGIs $100k-200k)
Total itemized deductions: $22,250 (reported on 1.2% of returns)
Here:
$22,250
State:
$34,117
(% of AGI for various income ranges: 127.1% for AGIs $25k-50k)
Taxes paid: $7,350 (reported on 1.2% of returns)
49870:
$7,350
State:
$7,972
(% of AGI for various income ranges: 42.0% for AGIs $25k-50k)
Earned income credit: $2,154 (reported on 14.0% of returns)
Here:
$2,154
State:
$2,251
(% of AGI for various income ranges: 72.9% for AGIs below $25k, 60.3% for AGIs $25k-50k)
Percentage of individuals using paid preparers for their 2020 taxes: 95.9%
Here:
96%
State:
93%
(% for various income ranges: 96.8% for AGIs below $25k, 95.6% for AGIs $25k-50k, 96.3% for AGIs $50k-75k, 93.3% for AGIs $75k-100k, 94.4% for AGIs $100k-200k, 100.0% for AGIs over 200k)
Averages for the 2012 tax year for zip code 49870, filed in 2013:
Average Adjusted Gross Income (AGI) in 2012: $41,320 (Individual Income Tax Returns)
Here:
$41,320
State:
$55,609
Salary/wage: $38,110 (reported on 78.7% of returns)
Here:
$38,110
State:
$46,782
(% of AGI for various income ranges: 67.0% for AGIs below $25k, 71.9% for AGIs $25k-50k, 74.1% for AGIs $50k-75k, 73.5% for AGIs $75k-100k, 74.0% for AGIs $100k-200k)
Taxable interest for individuals: $706 (reported on 41.4% of returns)
This zip code:
$706
Michigan:
$1,491
(% of AGI for various income ranges: 1.7% for AGIs below $25k, 0.8% for AGIs $25k-50k, 0.4% for AGIs $50k-75k, 0.6% for AGIs $75k-100k, 0.4% for AGIs $100k-200k)
Ordinary dividends: $2,692 (reported on 21.9% of returns)
Here:
$2,692
State:
$6,225
(% of AGI for various income ranges: 2.6% for AGIs below $25k, 1.6% for AGIs $25k-50k, 0.5% for AGIs $50k-75k, 1.4% for AGIs $75k-100k, 1.5% for AGIs $100k-200k)
Net capital gain/loss in AGI: +$408 (reported on 14.2% of returns)
Here:
+$408
State:
+$9,326
(% of AGI for various income ranges: 0.9% for AGIs $50k-75k, 0.3% for AGIs $100k-200k)
Profit/loss from business: +$4,094 (reported on 10.1% of returns)
Here:
+$4,094
State:
+$11,523
(% of AGI for various income ranges: 2.3% for AGIs below $25k, 0.9% for AGIs $25k-50k, 1.8% for AGIs $50k-75k, 0.5% for AGIs $100k-200k)
Taxable individual retirement arrangement distribution: $11,135 (reported on 13.6% of returns)
49870:
$11,135
Michigan:
$15,298
(% of AGI for various income ranges: 4.3% for AGIs below $25k, 3.8% for AGIs $25k-50k, 3.6% for AGIs $50k-75k, 8.5% for AGIs $75k-100k)
Total itemized deductions: $17,829 (21% of AGI, reported on 18.3% of returns)
Here:
$17,829
State:
$21,628
Here:
21.0% of AGI
State:
18.4% of AGI
(% of AGI for various income ranges: 4.6% for AGIs below $25k, 6.8% for AGIs $25k-50k, 6.5% for AGIs $50k-75k, 9.1% for AGIs $75k-100k, 10.8% for AGIs $100k-200k)
Charity contributions: $3,177 (reported on 15.4% of returns)
Here:
$3,177
State:
$4,225
(% of AGI for various income ranges: 0.5% for AGIs below $25k, 0.7% for AGIs $25k-50k, 0.9% for AGIs $50k-75k, 1.9% for AGIs $75k-100k, 1.6% for AGIs $100k-200k)
Taxes paid: $6,384 (reported on 18.3% of returns)
49870:
$6,384
State:
$8,327
(% of AGI for various income ranges: 1.0% for AGIs below $25k, 1.8% for AGIs $25k-50k, 2.0% for AGIs $50k-75k, 3.2% for AGIs $75k-100k, 5.0% for AGIs $100k-200k)
Earned income credit: $1,977 (reported on 18.3% of returns)
Here:
$1,977
State:
$2,306
(% of AGI for various income ranges: 5.4% for AGIs below $25k, 1.0% for AGIs $25k-50k)
Percentage of individuals using paid preparers for their 2012 taxes: 65.1%
Here:
65%
State:
57%
(% for various income ranges: 58.1% for AGIs below $25k, 68.2% for AGIs $25k-50k, 75.0% for AGIs $50k-75k, 71.4% for AGIs $75k-100k, 69.2% for AGIs $100k-200k)
Averages for the 2004 tax year for zip code 49870, filed in 2005:
Average Adjusted Gross Income (AGI) in 2004: $34,626 (Individual Income Tax Returns)
Here:
$34,626
State:
$48,204
Salary/wage: $31,680 (reported on 81.5% of returns)
Here:
$31,680
State:
$42,791
(% of AGI for various income ranges: 83.2% for AGIs below $10k, 64.5% for AGIs $10k-25k, 75.4% for AGIs $25k-50k, 79.5% for AGIs $50k-75k, 86.1% for AGIs $75k-100k, 61.5% for AGIs over 100k)
Taxable interest for individuals: $1,143 (reported on 57.1% of returns)
This zip code:
$1,143
Michigan:
$1,725
(% of AGI for various income ranges: 5.4% for AGIs below $10k, 3.5% for AGIs $10k-25k, 2.0% for AGIs $25k-50k, 1.3% for AGIs $50k-75k, 1.4% for AGIs $75k-100k, 1.3% for AGIs over 100k)
Taxable dividends: $1,985 (reported on 28.3% of returns)
Here:
$1,985
State:
$3,420
(% of AGI for various income ranges: 3.4% for AGIs below $10k, 2.9% for AGIs $10k-25k, 1.2% for AGIs $25k-50k, 1.5% for AGIs $50k-75k, 1.4% for AGIs $75k-100k, 1.4% for AGIs over 100k)
Net capital gain/loss: +$4,143 (reported on 17.3% of returns)
Here:
+$4,143
State:
+$8,532
(% of AGI for various income ranges: 0.2% for AGIs below $10k, 0.7% for AGIs $10k-25k, 0.3% for AGIs $25k-50k, 0.5% for AGIs $50k-75k, 1.5% for AGIs $75k-100k, 8.7% for AGIs over 100k)
Profit/loss from business: +$4,613 (reported on 11.5% of returns)
Here:
+$4,613
State:
+$9,547
(% of AGI for various income ranges: -0.5% for AGIs below $10k, 1.4% for AGIs $10k-25k, 1.5% for AGIs $25k-50k, 0.5% for AGIs $50k-75k, 1.1% for AGIs $75k-100k, 3.8% for AGIs over 100k)
IRA payment deduction: $2,316 (reported on 2.4% of returns)
49870:
$2,316
Michigan:
$2,875
Total itemized deductions: $13,660 (19% of AGI, reported on 19.3% of returns)
Here:
$13,660
State:
$18,509
Here:
19.3% of AGI
State:
20.7% of AGI
(% of AGI for various income ranges: 6.0% for AGIs $10k-25k, 7.1% for AGIs $25k-50k, 7.2% for AGIs $50k-75k, 10.9% for AGIs $75k-100k, 8.6% for AGIs over 100k)
Charity contributions deductions: $2,799 (4% of AGI, reported on 17.0% of returns)
Here:
$2,799
State:
$3,365
Here:
3.7% of AGI
State:
3.6% of AGI
(% of AGI for various income ranges: 0.9% for AGIs $10k-25k, 1.0% for AGIs $25k-50k, 1.3% for AGIs $50k-75k, 2.1% for AGIs $75k-100k, 1.9% for AGIs over 100k)
Total tax: $4,436 (reported on 70.0% of returns)
49870:
$4,436
State:
$7,691
(% of AGI for various income ranges: 2.1% for AGIs below $10k, 3.3% for AGIs $10k-25k, 6.8% for AGIs $25k-50k, 8.1% for AGIs $50k-75k, 10.2% for AGIs $75k-100k, 17.5% for AGIs over 100k)
Earned income credit: $1,509 (reported on 16.5% of returns)
Here:
$1,509
State:
$1,737
Percentage of individuals using paid preparers for their 2004 taxes: 62.8%
Here:
63%
State:
60%
(% for various income ranges: 54.8% for AGIs below $10k, 62.1% for AGIs $10k-25k, 64.5% for AGIs $25k-50k, 69.6% for AGIs $50k-75k, 71.8% for AGIs $75k-100k, 68.8% for AGIs over 100k)
Likely homosexual households (counted as self-reported same-sex unmarried-partner households)
Lesbian couples: 0.0% of all households
Gay men: 2.2% of all households
Household received Food Stamps/SNAP in the past 12 months: 235 Household did not receive Food Stamps/SNAP in the past 12 months: 1,329
Women who had a birth in the past 12 months: 45 (15 now married, 29 unmarried) Women who did not have a birth in the past 12 months: 612 (249 now married, 362 unmarried)
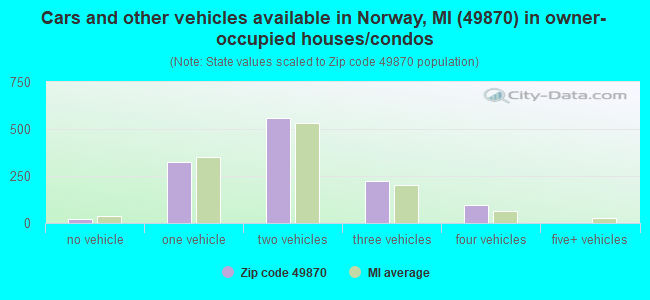
Housing units in zip code 49870 with a mortgage: 590 (45 second mortgage, 47 both second mortgage and home equity loan) Median monthly owner costs for units with a mortgage: $1,024 Median monthly owner costs for units without a mortgage: $534
Residents with income below the poverty level in 2022:
This zip code:
12.7%
Whole state:
13.4%
Residents with income below 50% of the poverty level in 2022:
This zip code:
10.3%
Whole state:
6.9%
Median number of rooms in houses and condos:
Here:
6.6
State:
6.5
Median number of rooms in apartments:
Here:
4.4
State:
4.3
Notable locations in this zip code not listed on our city pages
Notable locations in zip code 49870: Dickinson County Fairgrounds (A), Oak Crest Golf Course (B), Norway Station (C), Norway Speedway (D), North Alert Ambulance Authority (E), Jake Menghini Museum (F), Dickinson County Library (G), Norway Volunteer Fire Department (H), Norway Police Department (I), Michigan Department of Natural Resources Norway Field Office (J). Display/hide their locations on the map
Churches in zip code 49870 include: First Baptist Church (A), Saint Mary Catholic Church (B), Community Bible Church (C), Norway Baptist Church (D), Bethany Lutheran Church (E), United Pentecostal Church (F), Grace United Methodist Church (G), Evangelical Covenant Church (H). Display/hide their locations on the map
Parks in zip code 49870 include: Hanbury Lake Park (1), Strawberry Lake Park (2), Norway Spring Historical Marker (3), Menominee Iron Range Historical Marker (4), Marion Park (5). Display/hide their locations on the map
In group quarters: 43 (-1 institutionalized population)
Size of family households: 544 2-persons, 142 3-persons, 162 4-persons, 48 5-persons, 29 6-persons
Size of nonfamily households: 531 1-person, 110 2-persons
526 married couples with children.
90 single-parent households (57 men, 33 women).
97.7% of residents of 49870 zip code speak English at home.
0.1% of residents speak Spanish at home (100% very well).
2.2% of residents speak other Indo-European language at home (100% very well).
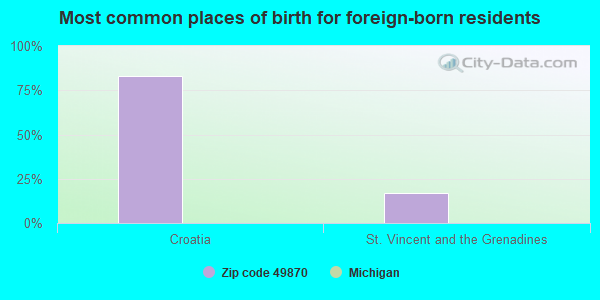
Foreign born population: 6 (0.2%) (100.0% of them are naturalized citizens)
This zip code:
0.2%
Whole state:
6.9%
83%Croatia
17%St. Vincent and the Grenadines
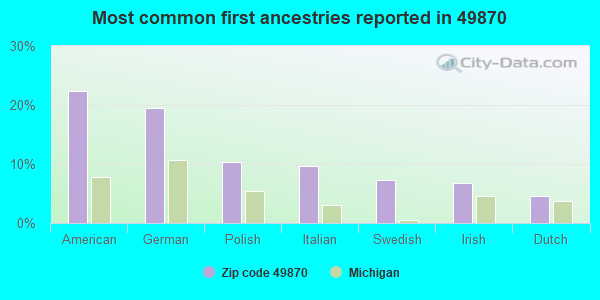
22%American
19%German
10%Polish
10%Italian
7%Swedish
7%Irish
5%Dutch
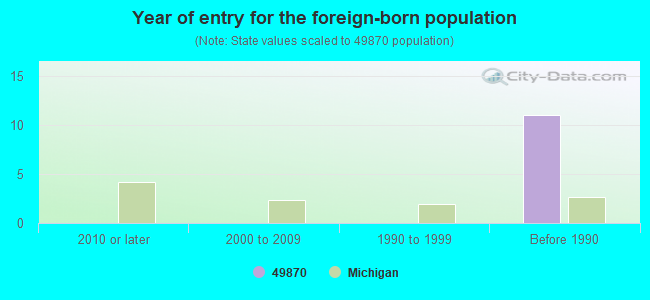
Year of entry for the foreign-born population
02010 or later
02000 to 2009
01990 to 1999
11Before 1990
Facilities with environmental interests located in this zip code:
MI DEPT/TRANSPORTATION BRIDGE B02-22051 (US-8 OVER MENOMINEE RIVER in NORWAY, MI)
(Resource Conservation and Recovery Act (tracking hazardous waste)) Organizations: MICH DEPT OF TRANSPORTATION (CONTACT/OPERATOR)
Alternative names: MIDOT BRIDGE US-8 OVER MENOMINEE RIVER
DICKINSON COUNTY OF EMER PREP (US 8-NORWAY FAIRGROUNDS in NORWAY, MI)
(Resource Conservation and Recovery Act (tracking hazardous waste))
ERA CHEVROLET INC (636 W US HWY 2 in NORWAY, MI)
Small Quantity Generators, between 100 kg and 1000 kg of hazardous waste/month (Resource Conservation and Recovery Act (tracking hazardous waste)) Organizations: ELWOOD R. ANDERSON (CONTACT/OPERATOR)
Housing units lacking complete plumbing facilities: 1.9% Housing units lacking complete kitchen facilities: 3.3%
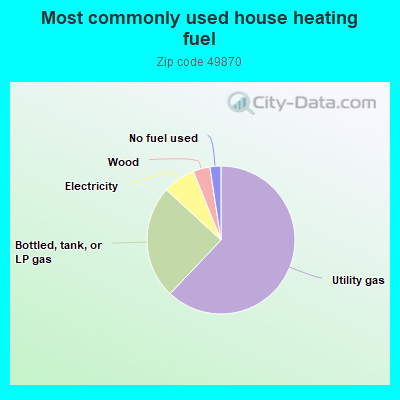
62.2%Utility gas
24.8%Bottled, tank, or LP gas
7.1%Electricity
3.7%Wood
2.4%No fuel used
Population in 1990: 3,300. Population change in the 1990s: +167 (+5.1%).
Place of birth for U.S.-born residents:
This state: 2,734
Northeast: 52
Midwest: 585
South: 112
West: 5
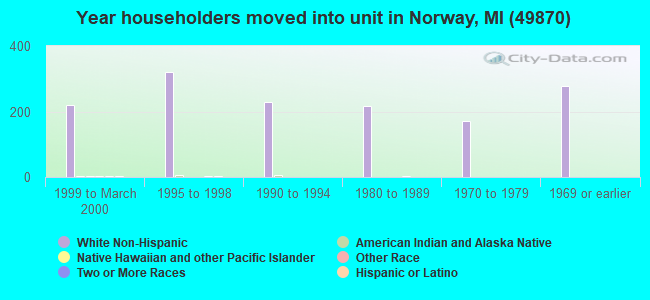
61% of the 49870 zip code residents lived in the same house 5 years ago. Out of people who lived in different houses, 62% lived in this county. Out of people who lived in different counties, 50% lived in Michigan.
90% of the 49870 zip code residents lived in the same house 1 year ago. Out of people who lived in different houses, 51% moved from this county. Out of people who lived in different houses, 23% moved from different county within same state. Out of people who lived in different houses, 28% moved from different state.
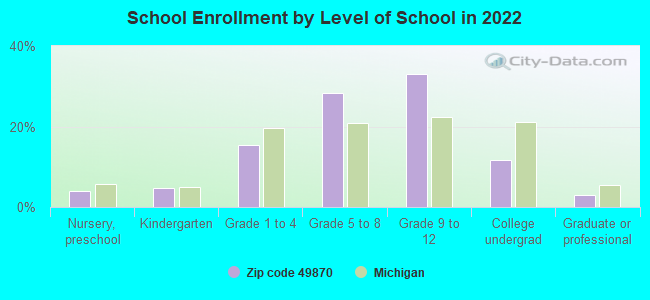
Private vs. public school enrollment:
Students in private schools in grades 1 to 8 (elementary and middle school): 44
Here:
14.3%
Michigan:
12.4%
Students in private schools in grades 9 to 12 (high school): 26
Here:
11.1%
Michigan:
9.8%
Students in private undergraduate colleges: 4
Here:
5.1%
Michigan:
14.9%
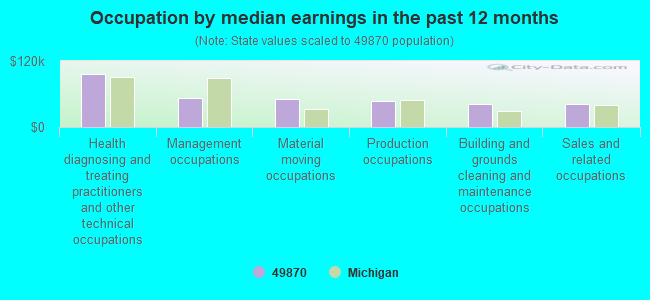
Occupation by median earnings in the past 12 months ($)
96,722Health diagnosing and treating practitioners and other technical occupations
53,609Management occupations
51,231Material moving occupations
46,973Production occupations
41,824Building and grounds cleaning and maintenance occupations
41,579Sales and related occupations
Top industries in this zip code by the number of employees in 2005:
Accommodation and Food Services: Limited-Service Restaurants (20-49 employees: 3 establishments)
Arts, Entertainment, and Recreation: Skiing Facilities (50-99: 1)
Administrative and Support and Waste Management and Remediation Services: Solid Waste Collection (20-49: 1, 10-19: 1)
Accommodation and Food Services: Full-Service Restaurants (20-49: 1, 5-9: 1)
Finance and Insurance: Commercial Banking (20-49: 1, 1-4: 1)
People in group quarters in 2010:
16 people in group homes intended for adults
16 people in residential treatment centers for adults
People in group quarters in 2000:
14 people in other noninstitutional group quarters
2 people in religious group quarters
2002 - 2018 National Fire Incident Reporting System (NFIRS) incidents
Based on the data from the years 2002 - 2018 the average number of fire incidents per year is 6. The highest number of reported fire incidents - 19 took place in 2007, and the least - 0 in 2009. The data has a rising trend.
When looking into fire subcategories, the most incidents belonged to: Outside Fires (41.3%), and Structure Fires (38.5%).
Fire incident types reported to NFIRS in Zip Code 49870
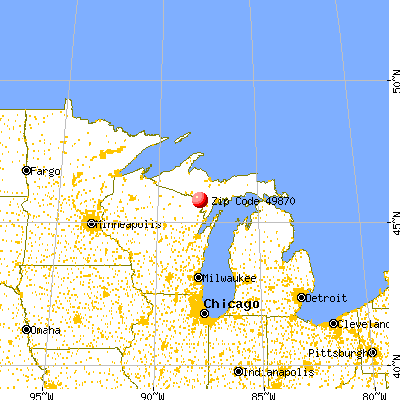


 Nearest zip codes: 49852, 49892, 49876, 49834, 49801, 49831.


 Based on the data from the years 2002 - 2018 the average number of fire incidents per year is 6. The highest number of reported fire incidents - 19 took place in 2007, and the least - 0 in 2009. The data has a rising trend.
 When looking into fire subcategories, the most incidents belonged to: Outside Fires (41.3%), and Structure Fires (38.5%).